

Abstract
The genomic region surrounding the TNF locus on human chromosome 6 has previously been associated with typhoid fever in Vietnam. We used a haplotypic approach to understand this association further. Eighty single nucleotide polymorphisms (SNPs) spanning a 150 kb region were genotyped in 95 Vietnamese individuals (typhoid case/mother/father trios). A subset of data from 33 SNPs with a minor allele frequency of >4.3% was used to construct haplotypes. Fifteen SNPs, which tagged the 42 constructed haplotypes were selected. The haplotype tagging SNPs (T1-T15) were genotyped in 380 confirmed typhoid cases and 380 Vietnamese ethnically matched controls. Allelic frequencies of seven SNPs (T1, T2, T3, T5, T6, T7, T8) were significantly different between typhoid cases and controls. Logistic regression results support the hypothesis that there is just one signal associated with disease at this locus. Haplotype-based analysis of the tag SNPs provided positive evidence of association with typhoid (posterior probability 0.821). The analysis highlighted a low-risk cluster of haplotypes that each carry the minor allele of T1 or T7, but not both, and otherwise carry the combination of alleles *12122*1111 at T1-T11, further supporting the one associated signal hypothesis. Finally, individuals that carry the typhoid fever protective haplotype *12122*1111 also produce a relatively low TNF-α response to LPS.
Introduction
Typhoid fever is a human specific systemic disease caused by infection with Salmonella enterica serotype Typhi (Parry et al. 2002). It is estimated that 22 million cases of typhoid fever occur worldwide per year, resulting in 200,000 deaths (Crump et al. 2004). There is a significant burden of disease in developing countries where sanitary conditions can be inadequate. In southern Vietnam, typhoid fever is the major cause of community-acquired septicemia (Hoa et al. 1998). Recent community based surveillance of disease prevalence reported incidence rates of 198 per 100,000 in the Mekong Delta, Vietnam (Lin et al. 2000). The 1990s saw the development and spread of multidrug resistant strains of S. Typhi in southern Vietnam. With approximately 90% of S. Typhi isolates now multi-drug resistant, the potential for a return to the pre-antibiotic era and untreatable typhoid fever exists. It is possible that the future control of typhoid fever may lie in alternative treatments or preventative measures to augment or replace existing therapies. Identification of typhoid fever susceptibility or resistance genes provides insight into the host-pathogen interaction and disease mechanisms, which may ultimately contribute to the development of new therapies.
The genomic region surrounding the TNF locus on human chromosome 6 has previously been associated with typhoid fever. We identified haplotypes that were either protective (TNFA*1[308].DRB1*04) or predisposed individuals to typhoid fever (TNFA*2[308].DRB1*0301) (Dunstan et al. 2001). In addition, a study in Indonesia suggested a protective role of DRB1*12021 for complicated typhoid fever (Dharmana et al. 2002). This genomic region encoding the major histocompatibility complex (MHC) is gene rich with a large number of genes related to immunity and inflammation (The MHC sequencing Consortium 1999). Therefore it is difficult to pinpoint the causal basis of a single SNP association with disease as a number of genes within this region could individually or collectively be responsible. Of these, the TNF gene, which encodes the pro-inflammatory cytokine TNF-α, is a strong candidate. Keuter et al. (1994) measured TNF-α levels in typhoid fever patients and found that the production of this cytokine was lower in the acute phase of the disease than in convalescence. Bhutta et al. (1997) have reported an association between circulating TNF-α levels and typhoid fever severity and more recently House et al. (2002) showed that low ex vivo production of TNF-α was associated with a delayed recovery. However, the typhoid associated TNFA -308 polymorphism may be behaving as a marker for the true causal polymorphism, which could be found within TNF or other genes in close physical or genetic proximity. To understand how an association between a TNF promoter polymorphism and typhoid arose it is necessary to first understand the haplotypic structure of the TNF region in the Vietnamese.
Investigating the genetic susceptibility to disease using a haplotypic approach is more powerful than genotyping individual genetic markers (Daly et al. 2001). The human genome can be divided into haplotype blocks, defined as sizeable regions of the genome with little evidence of historical recombination (Gabriel et al. 2002). Within these blocks only a small number of common haplotypes are observed (Gabriel et al. 2002). The potential of haplotype blocks to map human complex trait loci is being vigorously investigated and large-scale haplotype mapping projects in specific regions of the genome (Allcock et al. 2002), and throughout the genome, are underway (The International HapMap Project 2003). Once haplotype blocks for a genomic region are identified, the minimum number of SNPs that captures the most frequently occurring haplotypes can be determined (Johnson et al. 2001). Identification of these haplotype tagging SNPs (htSNPs) not only enables a significant reduction in genotyping but also allows a comprehensive and sensitive scan of the common variation within a genomic region.
Initial studies investigating haplotypic variation of the MHC region (Walsh et al. 2003) and more specifically in the MHC Class III region (Ackerman et al. 2003a, b) have been reported. Ackerman et al. (2003b) investigated the haplotypic structure of the TNF region, within MHC Class III, in a population of West Africans. Genotyping a small number of SNP markers (N = 25) over an 80 kb region they found that linkage disequilibrium (LD) was remarkably heterogenous and concluded that more detailed marker maps of the TNF region were needed when attempting to identify the causal basis of a genetic association with disease (Ackerman et al. 2003b).
In this study we aimed to define the haplotypic structure of the TNF region in a Vietnamese population, to identify the haplotype tagging SNPs of this region and to investigate how these individual SNPs and haplotypes may be associated with typhoid fever.
Subjects and methods
Study populations
Genomic DNA from patients with typhoid fever was collected as part of larger epidemiologic or treatment studies. These studies were either performed at the Hospital for Tropical Diseases in Ho Chi Minh City, Dong Thap Provincial Hospital in Dong Thap Province or Dong Nai Paediatric Center in Dong Nai Province. Venous blood (2 ml) was collected from 380 patients with blood culture positive typhoid fever admitted to one of the three hospitals. The samples and studies have been described previously (Chinh et al. 2000; Dunstan et al. 2001; Luxemburger et al. 2001; Phuong et al. 1999; Vinh et al. 2004). In addition umbilical cord blood samples from babies born at Huong Vuong Hospital in Ho Chi Minh City were collected.
To enable accurate construction of haplotypes we collected simplex families (case/parent trios). Venous blood was collected from patients with blood culture positive typhoid fever who were admitted to Dong Thap Provincial Hospital. Health care workers from Dong Thap Provincial Hospital then collected blood samples from both parents either in the hospital or during a home visit. In this study 93 case/parent trios were analysed.
All case patients and control subjects were unrelated and were of the Vietnamese Kinh ethnicity. Informed consent was obtained from the individuals admitted into the study. Ethical approval was obtained by the ethical and scientific committee of the Hospital for Tropical Diseases, the Dong Thap Hospital and the Health services of Dong Thap Province and the institutional review board of Dong Nai Paediatric Center. Ethical approval was also granted from the Oxford Tropical Research Ethics Committee (OXTREC) of Oxford University, UK.
DNA extraction, amplification and quantification
Genomic DNA from typhoid patients and their parents was extracted from approximately 2 ml of venous blood using either the blood midi kit from Qiagen (Qiagen, Lewes, UK) or the Nucleon BACC1 extraction kit (Nucleon Biosciences UK). For controls, genomic DNA was extracted from 10 ml of cord blood using the blood maxi kit from Qiagen (Qiagen, Lewes, UK). DNA concentration was determined by picogreen (Molecular Probes Invitrogen, Paisley, UK) using a Tecan fluorescent plate reader. Genomic DNA was amplified using primer extension pre-amplification (PEP) (Zhang et al. 1992).
SNP genotyping
High throughput genotyping was performed by allele-specific MALDITOF mass spectrometry using the Sequenom MassArray system. Briefly, a fragment of approximately 100 bp containing the SNP site was first amplified by PCR (Tetrad thermal cycler, MJ Research, Waltham, MA, USA). Multiplex PCR reactions (5 μl) were performed in a 384-well PCR plate by mixing 2 μl of PEP DNA (1:20 dilution) with 800 μM of dNTP, 1 × NH4 buffer, 2 mM MgCl2, 0.025 units of BioTaq (Bioline), and 0.2 μM of each primer. The cycling parameters were 96°C for 1 min then 5 cycles of 94°C for 45 s, 56°C for 45 s and 72°C for 30 s, then 29 cycles of 94°C for 45 s, 65°C for 45 s and 72°C for 30 s, then 72°C for 10 min once. Following PCR the unincorporated dNTPs were removed by treatment with shrimp alkaline phosphatase, the extension reaction performed and the subsequent products are desalted. Fifteen nanolitres of the reaction mixture were then “spotted” onto a SpectroCHIP. The CHIP was read in the Bruker Biflex III Mass spectrometer system, and the data analysed by SpectroTYPER. The data obtained for all typed SNPs was tested for HWE. All SNPs were in HWE (P > 0.05) when using Yates correction.
Analysis and statistical methods
Construction of haplotypes was performed using PHASE (Stephens et al. 2001) and PHAMILY (Ackerman et al. 2003a) software accessed via http://www.gmap.net/analysis.htm. The program PHAMILY reconstructs parental haplotypes where phase is unambiguous and this data is entered into PHASE to increase the accuracy of haplotype reconstruction by using all available information. PHASE is an implementation of the Stephens-Donnelly method of haplotype construction, which uses a Bayesian approach to assign the remaining phase-unknown sites among the unrelated parents. The program HaploXT (Abecasis and Cookson 2000) was used to define haplotype structure by measuring LD between the SNPs. The standardized disequilibrium coefficient (D′) values generated by HaploXT can be visualized using the graphical display program Marker beta (http://www.gmap.net/marker/). Haplotype tagging SNPs were selected by the Entropy program using the big_haplotype algorithim with a moving window size of 33 SNPs (Ackerman et al. 2003a) (http://www.well.ox.ac.uk/~rmott/SNPS/). This program chooses a subset of markers that best approximates the haplotypic diversity in the population by identifying the marker subset with maximum entropy, that is the entropy that is achieved when the complete set of markers are genotyped.
Pearson’s χ2 test was used to test associations between disease phenotypes and allele or genotype frequencies. Yates correction for 1 degree of freedom was applied. The Fisher’s exact test was used when an expected value in the contingency table was <5. P < 0.05 was considered significant. Step-wise logistic regression analysis was performed using SPSS for Windows 10.0.5 (SPSS Inc, Chicago, IL, USA). STAT/SE 8.0 (Stata Corporation, Texas, USA) was used in conjunction with a genetics specific statistical package, genassoc from http://www-gene.cimr.cam.ac.uk/clayton/software/stata.
The posterior probability of haplotype association with disease phenotypes was assessed using the GENEBPM algorithm (Morris 2005). The disease phenotype of each individual was modeled in a logistic regression framework, parameterized in terms of the odds of disease for each possible pair of haplotypes consistent with the observed SNP genotype, weighted by the corresponding phase assignment probabilities. A Bayesian partition model is utilized to cluster haplotypes according to their similarity, with each haplotype in the same cluster assigned the same odds of disease.
Ex vivo TNF-α release
Ex vivo whole blood stimulation with Escherichia coli LPS was performed, and TNF-α cytokine levels were measured, according to the methods of House et al. (2002).
Results
Selection of SNPs
Through genomic sequencing and public database interrogation approximately 200 SNPs were identified in a 150 kb segment of the MHC Class III region encompassing TNFA on chromosome 6 (Kwiatkowski et al., personal communication). Twelve genes span this region; MICB, BAT1 (UAP56), ATP6V1G2, NFKBIL1, LTA, TNF, LTB, LST1 (1C7), NCR3, AIF-1, BAT2, and BAT8 (Fig. 1). Genotyping these SNPs in individuals of Gambian and Caucasian ethnicity identified 80 SNPs with a minor allele frequency of >0.05 and an 80% genotyping success rate using the Sequenom MassArray (Kwiatkowski et al., personal communication). Figure 1 shows the location of the 80 SNPs in relation to the 12 genes spanning this 150 kb region.
Fig. 1.

A total of 150 kb segment of the MHC class III region encompassing TNFA on chromosome 6. Grey boxes denote the genes found within this region, whereas the diamonds, dashes and circles denote the approximate positions of the SNPs that were genotyped
Genotyping SNPs in family trios for haplotype construction
The 80 SNPs were genotyped in 95 Vietnamese individuals; 31 case/mother/father trios (93) plus one additional mother/father pair (2). Of these 80 SNPs genotyped, 7 SNPs completely failed, 8 SNPs had a failure rate >20%, 21 SNPs were monomorphic and 9 SNPs had a minor allele frequency of <4%. Table 1 shows the SNP name, position and minor allele frequency of the 80 SNPs in 64 unrelated Vietnamese individuals (32 mother/father pairs). In total, 35 SNPs had a genotyping failure rate of <20% and a minor allele frequency >4.3%, however data from 2 of these SNPs UAP56*7126 and NFKBIL1*15811, was not analysed further as their chromosomal location was not confirmed. The genotypes of these 33 SNPs in control individuals all displayed Hardy Weinberg Equilibrium (HWE; P >0.05).
Table 1.
Description of SNPs
| SNPs | rs number | Codea | Position | Function | Hap SNPsb | Tag SNP | Allele freq. |
|---|---|---|---|---|---|---|---|
| TNF*707887 | 707887 | R | 24758650 | UTR | 0 | ||
| MICB*2516412 | 2516412 | M | 31570300 | Locus | 0.139 | ||
| BAT1*3219190 | 3219190 | R | 31605954 | Intron | 0 | ||
| BAT1*11796 | 11796 | W | 31609191 | Intron | * | 0.367 | |
| UAP56*7126c | 11796 | W | 31609191 | Intron | 0.405 | ||
| BAT1*929138 | 929138 | R | 31611677 | Intron | * | 0.107 | |
| UAP56*1595 | 2516393 | M | 31614723 | Locus | * | T1 | 0.095 |
| BAT1*2071595 | 2071595 | S | 31615041 | Intron | * | T2 | 0.189 |
| BAT1*2239709 | 2239709 | Y | 31615426 | Intron | * | 0.191 | |
| BAT1*2239527 | 2239527 | S | 31617758 | UTR | * | T3 | 0.5 |
| BAT1*2523506 | 2523506 | M | 31617946 | UTR | * | 0.232 | |
| BAT1*2239528 | 2239528 | R | 31618084 | Promoter | * | 0.135 | |
| ATP6V1G2*2071593 | 2071593 | Y | 31620778 | UTR | 0 | ||
| ATP6V1G2*2239705 | 2239705 | Y | 31621381 | Coding | 0.079 | ||
| NFKBIL1-1068ATG | novel | R | 31622382 | Intron | 0 | ||
| NFKB-616d | novel | S | 31622765 | Locus | 0 | ||
| NFKBIL1-685ATG | novel | S | 31622765 | Locus | 0 | ||
| NFKBIL1*3219184 | 3219184 | Y | 31623119 | Promoter | * | 0.047 | |
| NFKB-63 | 2071592 | W | 31623319 | Promoter | * | 0.492 | |
| NFKBIL1*2230365 | 2230365 | Y | 31633427 | Synonymous | * | T4 | 0.19 |
| TNF*928815 | 928815 | M | 31639194 | Locus | * | 0.21 | |
| LTA*2009658 | 2009658 | S | 31646223 | Locus | * | 0.222 | |
| LTA*2516312 | 2516312 | Y | 31647414 | Locus | 0.008 | ||
| LTA*2071590 | 2071590 | Y | 31647747 | Locus | * | 0.125 | |
| LTA*1800683 | 1800683 | R | 31648049 | Locus | 0.314 | ||
| LTA*2239704 | 2239704 | K | 31648119 | UTR | 0.054 | ||
| LTA*3093546 | 3093546 | R | 31648121 | UTR | 0 | ||
| hLT-alpha_NcoI_B | 909253 | Y | 31648292 | UTR | * | T5 | 0.484 |
| LTA*746868 | 746868 | S | 31648408 | UTR | * | T6 | 0.19 |
| LTA*+492 | 2857713 | R | 31648535 | Nonsynone | 0 | ||
| LTA*3093542 | 3093542 | S | 31648672 | Intron | 0 | ||
| LTA*3093543 | 3093543 | M | 31648736 | Nonsynon | 0 | ||
| LTA*1041981 | 1041981 | M | 31648763 | Nonsynon | 0.47 | ||
| LTA*4647195 | 4647195 | Y | 31648936 | Intron | 0 | ||
| LTA*3093544 | 3093544 | R | 31649758 | UTR | 0 | ||
| hTNF*1799964 | 1799964 | Y | 31650287 | Locus | * | 0.27 | |
| TNF*1799724 | 1799724 | Y | 31650461 | Locus | * | 0.059 | |
| LTA*4248158 | 4248158 | Y | 31650513 | Locus | 0.016 | ||
| TNF*4248160 | 4248160 | R | 31650672 | Locus | 0.016 | ||
| TNF*4248161 | 4248161 | M | 31650746 | Locus | 0 | ||
| hTNF*1800629 | 1800629 | R | 31651010 | Locus | * | 0.063 | |
| hTNF*361525 | 361525 | R | 31651080 | Locus | 0.012 | ||
| TNF*1800610 | 1800610 | Y | 31651806 | UTR/intronic | * | T7 | 0.047 |
| TNF*3093662 | 3093662 | R | 31652168 | Intron | 0.035 | ||
| TNF*3093664 | 3093664 | R | 31652621 | Intron | * | 0.075 | |
| TNF*3093665 | 3093665 | M | 31653370 | UTR | 0 | ||
| TNF*3093667 | 3093667 | K | 31653746 | UTR | 0 | ||
| TNF*3093668 | 3093668 | S | 31654474 | Intergenic | * | T8 | 0.047 |
| TNF*3093726 | 3093726 | Y | 31654768 | Intergenic | 0 | ||
| TNF*3093671 | 3093671 | R | 31654959 | Intergenic | 0 | ||
| TNF*3093727 | 3093727 | R | 31655094 | Intergenic | 0 | ||
| TNF*3091258 | 3091258 | Y | 31655439 | Intergenic | 0 | ||
| LTB*769178 | 769178 | M | 31655493 | 5′ upstream | 0 | ||
| LTB+2591 | 769177 | R | 31655590 | 5′ upstream | 0.018 | ||
| LTB*3093559 | 3093559 | R | 31655771 | Locus | 0 | ||
| LTB*3093557 | 3093557 | Y | 31656175 | Locus | 0 | ||
| LTB*4645846 | 4645846 | S | 31656245 | Locus | 0 | ||
| LTB*3093556 | 3093556 | Y | 31656430 | UTR | 0 | ||
| LTB*3093555 | 3093555 | S | 31656869 | UTR | 0 | ||
| LTB*3093553 | 3093553 | M | 31657535 | Coding | 0 | ||
| LTB*4647175 | 4647175 | Y | 31659632 | Locus | 0.2 | ||
| LST1*2256974 | 2256974 | K | 31663371 | Intron | 0.397 | ||
| LST1*1052248 | 1052248 | W | 31664560 | Coding | * | T9 | 0.313 |
| 1C7*986475 | 986475 | Y | 31664688 | UTR | * | 0.043 | |
| 1C7*3179003 | 3179003 | M | 31664907 | Nonsynon | 0.024 | ||
| 1C7*2708 | 2708 | R | 31665770 | Coding | * | T10 | 0.054 |
| 1C7-172ATG | 11575837 | S | 31668649 | Locus | 0 | ||
| 1C7-412ATG | 2736191 | S | 31668889 | Locus | * | T11 | 0.46 |
| AIF1*2259571 | 2259571 | M | 31691806 | Intron | * | T12 | 0.492 |
| AIF1*2269475 | 2269475 | R | 31691910 | Coding | * | 0.08 | |
| BAT2*2736158 | 2736158 | S | 31708283 | Nonsynon | * | T13 | 0.25 |
| BAT2*2272593 | 2272593 | R | 31709323 | Nonsynon | 0.023 | ||
| BAT2*2242657 | 2242657 | Y | 31710468 | Intron | * | 0.102 | |
| BAT2*1046089 | 1046089 | R | 31710946 | Nonsynon | * | T14 | 0.433 |
| BAT2*2261033 | 2261033 | Y | 31711570 | Intron | * | T15 | 0.331 |
| BAT2 + 13510 | 17354367 | S | 31711749 | 0 | |||
| BAT2*13716 | 13716 | S | 31711989 | Synonymous | 0.486 | ||
| BAT2*10885 | 10885 | Y | 31712570 | Nonsynon | * | 0.065 | |
| BAT8 + 10309_B | 555007 | R | 31958311 | 0.016 | |||
| NFKBIL1*15811f | Not in chr6 | R | 158324741 | 0.293 |
Ambiguity code
SNP data used for haplotype construction
Same as BAT1*11796
Same as NFKBIL1-685ATG
Nonsynonomous
Not in chromosome 6
Construction of haplotypes
Haplotype construction from data of 124 unrelated parental chromosomes (31 mother/father pairs) genotyped for 33 SNPs was performed using the PHASE (Stephens et al. 2001) and PHAMILY (Ackerman et al. 2003a) programs. Forty-two haplotypes with a frequency of 1% or greater were reconstructed from 33 SNPs (Table 2). Haplotypes 2, 5, 8 and 10 are considered common with frequencies greater than 5%, with haplotype 5 being the most common at a frequency of 17%. Twenty haplotypes were found with a frequency of 1%, 13 haplotypes with 2%, 5 haplotypes with 3% and 3 haplotypes with 6-10%. Analysis of this data using HaploXT (Abecasis and Cookson 2000) and the graphical display program Marker beta showed that the level of LD within this genomic region is high and this is particularly evident in the block from BAT1*11796 to 1C7*2708 (Fig. 2).
Table 2.
Haplotypes constructed from genotyping 33 SNPs in 124 chromosomes
| No. | Haplotype of 33 SNP | Observed | Frequency |
|---|---|---|---|
| 1 | 112112111212122222111112112111111 | 1 | 0.01 |
| 2 | 111112211221212121111121112111121 | 10 | 0.08 |
| 3 | 111112211221212121111121111111111 | 1 | 0.01 |
| 4 | 121112121212122211111111111111111 | 3 | 0.02 |
| 5 | 211111111111111111111111122111111 | 21 | 0.17 |
| 6 | 111112211211212121111121211111212 | 4 | 0.03 |
| 7 | 111112211221212121111121111212221 | 3 | 0.02 |
| 8 | 111221111111111111111111121121211 | 12 | 0.10 |
| 9 | 112112111211112121112221112111111 | 3 | 0.02 |
| 10 | 211111111111111111111111121212221 | 7 | 0.06 |
| 11 | 111221111111112111111111121121211 | 1 | 0.01 |
| 12 | 111222122222112211111121112111121 | 4 | 0.03 |
| 13 | 112112111212122212121112112111111 | 3 | 0.02 |
| 14 | 121112121212122211111111112111121 | 4 | 0.03 |
| 15 | 211111111211111111112111111111111 | 3 | 0.02 |
| 16 | 112112111211112121112211122111121 | 2 | 0.02 |
| 17 | 211111111111111111111111122111121 | 3 | 0.02 |
| 18 | 111112211211212121111121111212221 | 2 | 0.02 |
| 19 | 211111111111111111211111111111212 | 4 | 0.03 |
| 20 | 111222122222112211111121111121111 | 1 | 0.01 |
| 21 | 211111111111111111111111121121211 | 3 | 0.02 |
| 22 | 211111111111111111211111111121211 | 4 | 0.03 |
| 23 | 111112211221212121111121111121211 | 3 | 0.02 |
| 24 | 111221111111111111111111122111111 | 2 | 0.02 |
| 25 | 121112121212122211111111111111211 | 1 | 0.01 |
| 26 | 211112111111111111111121111111111 | 1 | 0.01 |
| 27 | 112111111212122212121112112111121 | 1 | 0.01 |
| 28 | 112112111212122212121112122111121 | 1 | 0.01 |
| 29 | 121112121212122211111111111121211 | 2 | 0.02 |
| 30 | 121112121212112211111121112111111 | 1 | 0.01 |
| 31 | 111112211211212121111121212111121 | 1 | 0.01 |
| 32 | 111112211211212121111121211121211 | 1 | 0.01 |
| 33 | 111221111111111111111111122111121 | 1 | 0.01 |
| 34 | 111222122222112111111121112111121 | 1 | 0.01 |
| 35 | 112112111212122212121112112111121 | 1 | 0.01 |
| 36 | 112112111212122211111111112111121 | 1 | 0.01 |
| 37 | 112112111211112121112111122111121 | 1 | 0.01 |
| 38 | 111112211211212121111121111121211 | 2 | 0.02 |
| 39 | 111112211221212121111121112111111 | 1 | 0.01 |
| 40 | 121112121212122211111111112111111 | 1 | 0.01 |
| 41 | 211111111111111111111111121111211 | 1 | 0.01 |
| 42 | 111221111111111111111111121212221 | 1 | 0.01 |
Fig. 2.
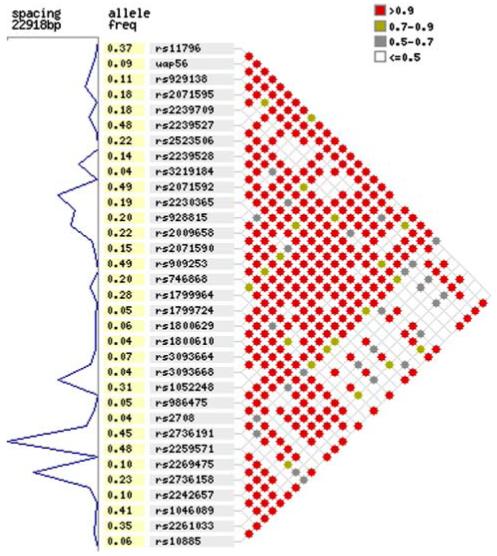
Linkage disequilibrium between the 33 SNPs used for haplotype construction. The standardized disequilibrium coefficient (D′) values generated by HaploXT are shown using the graphical display program Marker beta
Identification of haplotype tagging SNPs
The Entropy program was used to select haplotype tagging SNPs for the 42 haplotypes reconstructed from genotyping 33 SNPs in 124 chromosome (Ackerman et al. 2003a). A minimum subset of 15 tagging SNPs capturing the 42 haplotypes giving maximum entropy of 4.72238 was identified (Fig. 1). The 33 SNPs used for haplotype construction and the 15 tagging SNPs are shown in Table 1.
Case control analysis of disease association with individual SNPs: single point analysis
Fifteen tagging SNPs (labelled T1-T15) plus one additional SNP were genotyped in 380 typhoid cases and 380 cord blood controls. A sample size of 380 cases and controls is sufficient to detect relative risks of 2 or greater for all allele frequencies from 0.1 to 0.5 with at least 94% power and a P value of 0.05. The genotypes of the 16 SNPs in control individuals all displayed HWE (P > 0.05). The allele frequencies, genotypes, allelic comparisons and genotypic comparisons are shown in Table 3. Allelic frequencies of seven SNPs (T1, T2, T3, T5, T6, T7, T8) and genotypic frequencies of six SNPs (T1, T3, T5, T6, T7, T8) were significantly different between typhoid cases and controls.
Table 3.
Allelic and gentoypic comparison of TNF region SNPs typhoid cases and controls
| SNP name | Tag SNP no. | Typhoid cases |
Controls |
Genotypic comparisona |
Allelic comparisonb (1 vs. 2) |
HWEb controls P | |||||
|---|---|---|---|---|---|---|---|---|---|---|---|
| Minor Allele freq | Genotype 11/12/22 | Minor Allele freq | Genotype 11/12/22 | χ2 2 df | P | OR | P | χ2 1 df | |||
| UAP56*1595 | T1 | 0.11 | 289/65/7 | 0.16 | 260/88/15 | 7.89 | 0.019 | 0.63 | 0.004 | 8.24 | 0.055 |
| BAT1*2071595 | T2 | 0.21 | 229/125/16 | 0.17 | 261/100/12 | 5.43 | 0.066 | 1.35 | 0.028 | 4.82 | 0.634 |
| BAT1*2239527 | T3 | 0.49 | 93/183/86 | 0.55 | 84/160/117 | 6.73 | 0.035 | 0.80 | 0.040 | 4.22 | 0.053 |
| NFKBIL1*2230365 | T4 | 0.17 | 254/104/10 | 0.17 | 257/100/14 | 0.75 | 0.687 | 0.97 | 0.891 | 0.02 | 0.349 |
| hLT-alpha_NcoI_B | T5 | 0.49 | 97/186/89 | 0.55 | 81/174/120 | 6.42 | 0.040 | 0.78 | 0.018 | 5.64 | 0.266 |
| LTA*746868 | T6 | 0.23 | 212/114/25 | 0.30 | 184/140/40 | 7.87 | 0.020 | 0.70 | 0.004 | 8.21 | 0.111 |
| TNF*1800610 | T7 | 0.06 | 318/40/1 | 0.10 | 296/63/3 | 6.91 | 0.032 | 0.59 | 0.012 | 6.37 | 0.911 |
| TNF*3093664 | 0.08 | 318/54/1 | 0.06 | 329/43/0 | 2.43 | 0.296 | 1.32 | 0.217 | 1.52 | 0.480 | |
| TNF*3093668 | T8 | 0.06 | 331/44/1 | 0.04 | 345/27/0 | 5.34 | 0.040 | 1.73 | 0.035 | 4.47 | 0.922 |
| LST1*1052248 | T9 | 0.28 | 186/153/26 | 0.27 | 200/141/32 | 1.53 | 0.465 | 1.03 | 0.841 | 0.04 | 0.377 |
| 1C7*2708 | T10 | 0.06 | 326/44/1 | 0.07 | 326/45/3 | 1.00 | 0.762 | 0.90 | 0.705 | 0.14 | 0.492 |
| 1C7-412ATG | T11 | 0.41 | 131/174/66 | 0.39 | 141/175/59 | 0.74 | 0.690 | 1.09 | 0.422 | 0.65 | 0.757 |
| AIF1*2259571 | T12 | 0.46 | 106/192/73 | 0.49 | 104/178/94 | 3.16 | 0.206 | 0.88 | 0.248 | 1.33 | 0.350 |
| BAT2*2736158 | T13 | 0.23 | 209/138/13 | 0.21 | 234/116/18 | 4.04 | 0.133 | 1.13 | 0.357 | 0.85 | 0.549 |
| BAT2*1046089 | T14 | 0.49 | 93/191/85 | 0.46 | 119/166/88 | 4.97 | 0.083 | 1.13 | 0.257 | 1.28 | 0.054 |
| BAT2*2261033 | T15 | 0.28 | 188/129/35 | 0.33 | 161/152/39 | 4.19 | 0.123 | 0.81 | 0.082 | 3.02 | 0.805 |
Fisher exact test was applied when the observed frequency was <5
Yates correction for 1 df was applied
Case control analysis of disease association with individual SNPs: multi-locus analysis
An additive model, as opposed to a dominant or recessive model, best represented the data as evidenced by the strong odds ratio (OR) generated when comparing allelic frequencies (data not shown). Therefore all data was recoded to represent an additive model for logistic regression. To establish whether association effects seen at different loci are independent we used multiple logisitic regression analysis (Cordell and Clayton 2002). This approach can be used to test the null hypothesis of no association for each SNP, adjusted for the additive effects of all other SNPs (Table 4). For the model containing all 16 SNPs, only SNPs T1 and T7 were significant (P = 0.019 and P = 0.003, respectively). Dropping SNP T1 from the model, T7 remained highly significant (P = 0.006). Similarly, SNP T1 remains significant (P = 0.029) when T7 is dropped from the model. However, when both of these SNPs are dropped from the model, T6 demonstrates significant evidence of association (P = 0.036). These results suggest that the effects of T1 and T7 are independent in terms of their association with disease, but that the effect of T6 is partially correlated with that of both T1 and T7.
Table 4.
Forward step-wise logistic regression
| SNP in regression model | SNP | Wald | P |
|---|---|---|---|
| 16 SNPs | T1 | 5.498 | 0.019 |
| T7 | 8.742 | 0.003 | |
| 16 SNPs except T1 | T7 | 7.58 | 0.006 |
| 16 SNPs except T7 | T1 | 4.781 | 0.029 |
| 16 SNPs except T1, T7 | T6 | 4.398 | 0.036 |
| T1, T6, T7 | T1 | 8.537 | 0.003 |
| T7 | 8.562 | 0.003 |
To take into account the high level of missing data when using all 16 SNPs (24%) we decided to only put the highly significant SNPs (T1, T6, T7) into the regression model to reduce the missing data to 11.9%. This logistic regression analysis confirmed the initial findings i.e. when T1, T6 and T7 were put into the regression, markers T1 and T7 both became significant (P = 0.003 and P = 0.003, respectively). These combined logistic regression results support the hypothesis that there is just one signal associated with disease at this locus. A model of this hypothesis is graphically represented in Fig. 3.
Fig. 3.
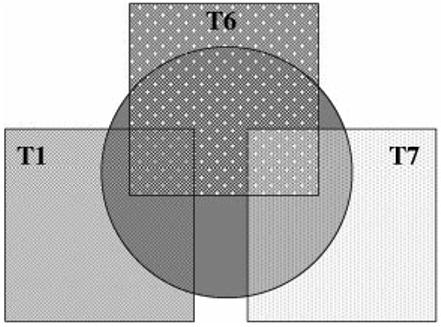
Model generated from logisitic regression analysis suggesting there is one signal associated with disease at this locus. The central grey circle represents the disease signal. The association effects of T1 (T1 box) and T7 (T7 box) are independent of each other but do not account for two separate association signals. T6 (T6 box) shares some of the correlation with disease that exists for T1 and some of the correlation with the disease that exists for T7
Case-control analysis of disease association with SNP haplotypes
We utilized the GENEBPM algorithm (Morris 2005) to approximate the posterior probability of association of tag SNP haplotypes with disease to further investigate the pattern of results obtained from the single-point and multi-locus analyses. The posterior probability was estimated to be 0.821, compared to a prior probability of 0.5, representing positive evidence of an association of tag SNP haplotypes with disease.
Figure 4 presents a cladogram of common haplotypes (frequency greater than 1%), constructed from output of the GENEBPM algorithm. The most common haplotype is labeled ‘1’, the second most common is labeled ‘2’, and so on. The cladogram can be used to represent the similarity of haplotypes in terms of the tag SNPs they carry and their disease risk. Haplotypes that cluster closely are likely to share recent common ancestry, and thus have similar risk of disease. Figure 4 highlights a specific low-risk clade of haplotypes, listed in Table 5 with their estimated frequency and posterior mean odds ratio, relative to the most common haplotype.
Fig. 4.
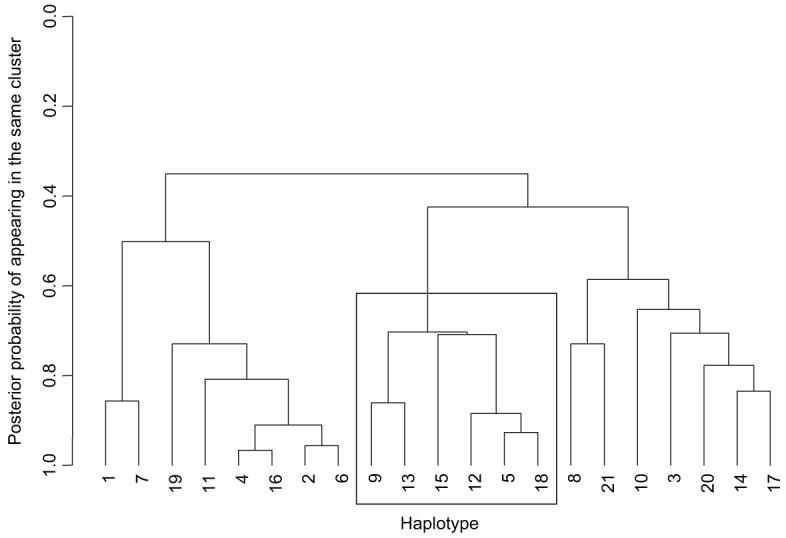
Cladogram to represent similarity between common haplotypes in terms of their allelic-makeup and disease risk. Haplotypes are numbered according to their frequency, where 1 is the most common. The boxed cluster of haplotypes have a total frequency of ~17%, and are at low-risk of disease, with odds-ratios in the range 0.85-0.92 (Table 5)
Table 5.
Low-risk cluster of haplotypes identiWed by GENEBPM algorithm
| Haplotype | Frequency | SNPs T1-T11 | Odds ratio |
|---|---|---|---|
| 5 | 0.057 | 21212211111 | 0.85 |
| 9 | 0.034 | 11212221111 | 0.86 |
| 12 | 0.021 | 21212211111 | 0.85 |
| 13 | 0.021 | 11212221111 | 0.89 |
| 15 | 0.018 | 21212211111 | 0.92 |
| 18 | 0.014 | 21212211111 | 0.87 |
Haplotypes in the low-risk cluster all carry the combination of alleles *12122*1111 at SNPs T1-T11, where * represents either allele. The minor allele at SNPs T1 and T7 occur only in this cluster, and define two independent segments of this clade, confirming the conclusions of the multi-locus analysis. Furthermore, the minor allele at SNP T6 occurs only in this clade, and one other rare haplotype. Thus, in the absence of SNPs T1 and T7, SNP T6 best isolates the low-risk clade, and thus becomes significant in the multi-locus analysis in the absence of T1 and T7.
TNF-α release in typhoid patients with and without the protective haplotype *12122*1111
Blood from typhoid patients on days 1, 4 and 7 of treatment were stimulated with 1 μg/ml LPS for 24 h and the level of TNF-α production in the supernatant was measured. Figure 5 shows the levels of TNF-α release in typhoid patients that either have or do not have the *12122*1111 haplotype. The amount of TNF-α produced by the patients who have the *12122*1111 haplotype is significantly less than those who do not have the haplotype on day 4 of treatment (P = 0.023). This trend is also observed on day 7 of treatment (P = 0.057).
Fig. 5.
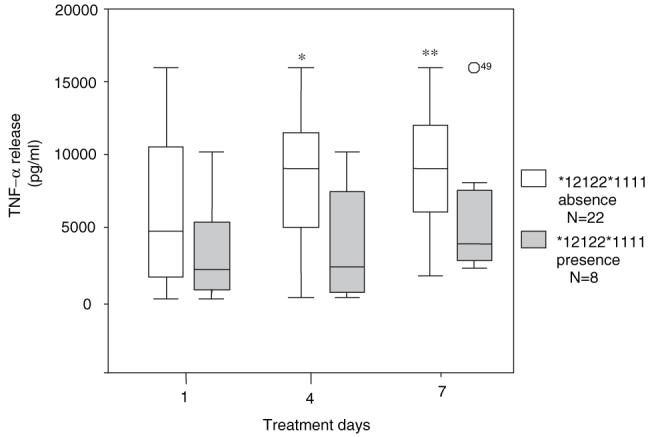
Ex vivo TNF-α response to LPS in typhoid patients. The ex vivo TNF-α response was measured on days 1, 4 and 7 of treatment in patients that have the *12122*1111 haplotype (n = 8) and patients that do not (n = 22). * P = 0.023 ** P = 0.057 by Mann-Whitney test
Discussion
Investigating the role of host genes in susceptibility and protection from disease historically involved genotyping individual genetic markers in candidate genes and looking for disease associations. However, this approach investigates only single gene loci and may identify only indirect markers of disease. In recent years development of a haplotypic approach to study disease susceptibility has progressed rapidly (Daly et al. 2001). Data from the recently released HapMap project offers a powerful tool to potentially identify the multiple genetic loci, and their interactions, that are responsible for protection or susceptibility to complex diseases (Altshuler et al. 2005). In this study we have investigated a genetic association between typhoid fever and the MHC class III region using a haplotypic approach.
With the aim to identify SNPs that are the most informative to common haplotypes in the TNF region in the Vietnamese we used an unstructured method to economically select htSNPs (Ackerman et al. 2003a). This method was appropriate for this data set as, (1) this genomic region has a high level of LD, (2) the average % missing data for all htSNPs was low (on average 3.3%) and (3) we used family trios for haplotype inference (Forton et al. 2005). To improve htSNP selection, a small number of additional SNPs could be identified in sites of increased inference error, which is determined by identifying loci that are most prone to haplotype reconstruction error (http://www.gmap.net/marker). In the htSNP set used here, SNPs rs2259571-rs10885 show high error profiles of 1-3% at each haplotype locus (data not shown). Although additional SNPs in this high error profile region may have increased the accuracy of haplotype reconstruction, the set of htSNPs that we found individually associated with typhoid fever lie within a region of lower error. This suggests that the htSNPs selected in the region of disease association were adequate.
Cladisitic analysis of SNPs is a novel approach to disease-gene mapping and provides considerably more power than single-locus methods (Durrant et al. 2004; Morris 2005). Cladisitic methods are based on the expectation that chromosomes with recent shared ancestry are similar in the vicinity of a disease gene. We used the GENEBPM algorithm to identify a cluster of low-risk haplotypes (*12122*1111) and identify groups of cases that harbour these haplotypes (Morris 2005). This algorithm gave a posterior probability of 0.821 (0.75 corresponds to 3:1 odds against the hypothesis that the haplotypes and disease are not associated), which represents positive evidence of an association between tag SNP haplotypes and typhoid fever. Both the combined logistic regression results and the cladisitic analysis support the hypothesis that there is just one signal associated with disease at this locus, and this signal is marked by the *12122*1111 haplotype.
Haplotype-based analysis revealed that the frequency of *12122*1111 was higher in the control population compared to typhoid fever patients. This strong association is with hospitalized typhoid as all cases genotyped in this study were inpatients, and although they did not show disease complications, they represent individuals with more severe infections than typhoid sufferers within the community that are more likely to have less symptomatic disease.
Although we have identified a haplotype in the TNF region that affords protection from typhoid fever we are yet to determine the causative disease loci. The seven associated htSNPs span a region of 44.7 kb and are found within the genes BAT1, LTA and TNF. BAT1, which is a member of the DEAD-box protein family encoding an ATP-dependent RNA helicase, has been shown to be a negative regulator of inflammation (Allcock et al. 2001). LTA encoding lymphotoxin-α, and TNF-α are members of the TNF super-family, mediating a large variety of inflammatory and immunostimulatory responses. All three genes, or haplotypes spanning these genes, have been associated with a variety of infectious and inflammatory diseases (Cabrera et al. 1995; Knight et al. 1999; Migita et al. 2005; Moffatt and Cookson 1997; Zeggini et al. 2002), and functional variation of these proteins could potentially effect susceptibility to typhoid fever. In this report we have shown that patients that carry the protective haplotype *12122*1111 produce less ex vivo TNF-α than patients without the haplotype on day 4 of treatment, and this trend is also seen on days 1 and 7 of treatment. Our future work will involve investigating TNF-α expression in healthy individuals with or without the protective haplotype to clearly examine this relationship. Future work to pinpoint the causative mutation responsible for the protective effect of the *12122*1111 haplotype will involve either a very high resolution association study of the region from TNF to BAT1 or re-sequencing of this region in Vietnamese individuals carrying this haplotype.
Acknowledgments
We acknowledge with thanks the directors and the staff of the Hospital for Tropical Disease, Dong Thap Provincial Hospital, Dong Nai Pediatric Hospital and Hung Vuong Hospital, Viet Nam for the clinical and microbiological work associated with this study. We thank the Vietnamese individuals who took part in this study. The Wellcome Trust funded this work.
Contributor Information
Sarah J. Dunstan, Oxford University Clinical Research Unit, Hospital for Tropical Diseases, 190 Ben Ham Tu, Quan 5, District 5, Ho Chi Minh City, Vietnam & Centre for Tropical Medicine, Nuffield Department of Clinical Medicine, Oxford University, OX3 7LJ Oxford, United Kingdom
Nguyen Thi Hue, Oxford University Clinical Research Unit, Hospital for Tropical Diseases, 190 Ben Ham Tu, Quan 5, District 5, Ho Chi Minh City, Vietnam & Hospital for Tropical Diseases, Ho Chi Minh City, Vietnam.
Kirk Rockett, Wellcome Trust Centre for Human Genetics, Oxford University, OX3 7BN Oxford, UK.
Julian Forton, Wellcome Trust Centre for Human Genetics, Oxford University, OX3 7BN Oxford, UK.
Andrew P. Morris, Wellcome Trust Centre for Human Genetics, Oxford University, OX3 7BN Oxford, UK
Mahamadou Diakite, Wellcome Trust Centre for Human Genetics, Oxford University, OX3 7BN Oxford, UK.
Mai Ngoc Lanh, Dong Thap Provincial Hospital, Dong Thap, Vietnam.
Le Thi Phuong, Dong Thap Provincial Hospital, Dong Thap, Vietnam.
Deborah House, Wellcome Trust Sanger Centre Hinxton, Cambridge, UK.
Christopher M. Parry, Oxford University Clinical Research Unit, Hospital for Tropical Diseases, 190 Ben Ham Tu, Quan 5, District 5, Ho Chi Minh City, Vietnam & Department of Medical Microbiology and Genitourinary Medicine, University of Liverpool, Liverpool, UK
Ha Vinh, Hospital for Tropical Diseases, Ho Chi Minh City, Vietnam.
Nguyen T. Hieu, Hung Vuong Hospital, Ho Chi Minh City, Vietnam
Gordon Dougan, Wellcome Trust Sanger Centre Hinxton, Cambridge, UK.
Tran Tinh Hien, Hospital for Tropical Diseases, Ho Chi Minh City, Vietnam.
Dominic Kwiatowski, Wellcome Trust Centre for Human Genetics, Oxford University, OX3 7BN Oxford, UK.
Jeremy J. Farrar, Oxford University Clinical Research Unit, Hospital for Tropical Diseases, 190 Ben Ham Tu, Quan 5, District 5, Ho Chi Minh City, Vietnam & Centre for Tropical Medicine, Nuffield Department of Clinical Medicine, Oxford University, OX3 7LJ Oxford, United Kingdom
References
- Abecasis GR, Cookson WO. GOLD-graphical overview of linkage disequilibrium. Bioinformatics. 2000;16:182–183. doi: 10.1093/bioinformatics/16.2.182. [DOI] [PubMed] [Google Scholar]
- Ackerman H, Usen S, Mott R, Richardson A, Sisay-Joof F, Katundu P, Taylor T, Ward R, Molyneux M, Pinder M, Kwiatkowski DP. Haplotypic analysis of the TNF locus by association efficiency and entropy. Genome Biol. 2003a;4:R24. doi: 10.1186/gb-2003-4-4-r24. [DOI] [PMC free article] [PubMed] [Google Scholar]
- Ackerman HC, Ribas G, Jallow M, Mott R, Neville M, Sisay-Joof F, Pinder M, Campbell RD, Kwiatkowski DP. Complex haplotypic structure of the central MHC region flanking TNF in a West African population. Genes Immun. 2003b;4:476–486. doi: 10.1038/sj.gene.6364008. [DOI] [PubMed] [Google Scholar]
- Allcock RJ, Williams JH, Price P. The central MHC gene, BAT1, may encode a protein that down-regulates cytokine production. Genes Cells. 2001;6:487–494. doi: 10.1046/j.1365-2443.2001.00435.x. [DOI] [PubMed] [Google Scholar]
- Allcock RJ, Atrazhev AM, Beck S, de Jong PJ, Elliott JF, Forbes S, Halls K, Horton R, Osoegawa K, Rogers J, Sawcer S, Todd JA, Trowsdale J, Wang Y, Williams S. The MHC haplotype project: a resource for HLA-linked association studies. Tissue Antigens. 2002;59:520–521. doi: 10.1034/j.1399-0039.2002.590609.x. [DOI] [PubMed] [Google Scholar]
- Altshuler D, Brooks LD, Chakravarti A, Collins FS, Daly MJ, Donnelly P. A haplotype map of the human genome. Nature. 2005;437:1299–1320. doi: 10.1038/nature04226. [DOI] [PMC free article] [PubMed] [Google Scholar]
- Bhutta ZA, Mansoorali N, Hussain R. Plasma cytokines in paediatric Typhoidal salmonellosis: correlation with clinical course and outcome. J Infect. 1997;35:253–256. doi: 10.1016/s0163-4453(97)93004-8. [DOI] [PubMed] [Google Scholar]
- Cabrera M, Shaw MA, Sharples C, Williams H, Castes M, Convit J, Blackwell JM. Polymorphism in tumor necrosis factor genes associated with mucocutaneous leishmaniasis. J Exp Med. 1995;182:1259–1264. doi: 10.1084/jem.182.5.1259. [DOI] [PMC free article] [PubMed] [Google Scholar]
- Chinh NT, Parry CM, Ly NT, Ha HD, Thong MX, Diep TS, Wain J, White NJ, Farrar JJ. A randomized controlled comparison of azithromycin and ofloxacin for treatment of multidrug-resistant or nalidixic acid-resistant enteric fever. Antimicrob Agents Chemother. 2000;44:1855–1859. doi: 10.1128/aac.44.7.1855-1859.2000. [DOI] [PMC free article] [PubMed] [Google Scholar]
- Cordell HJ, Clayton DG. A unified stepwise regression procedure for evaluating the relative effects of polymorphisms within a gene using case/control or family data: application to HLA in type 1 diabetes. Am J Hum Genet. 2002;70:124–141. doi: 10.1086/338007. [DOI] [PMC free article] [PubMed] [Google Scholar]
- Crump JA, Luby SP, Mintz ED. The global burden of typhoid fever. Bull World Health Org. 2004;82:346–353. [PMC free article] [PubMed] [Google Scholar]
- Daly MJ, Rioux JD, Schaffner SF, Hudson TJ, Lander ES. High-resolution haplotype structure in the human genome. Nat Genet. 2001;29:229–232. doi: 10.1038/ng1001-229. [DOI] [PubMed] [Google Scholar]
- Dharmana E, Joosten I, Tijssen HJ, Gasem MH, Indarwidayati R, Keuter M, Dolmans WM, Van Der Meer JW. HLA-DRB1*12 is associated with protection against complicated typhoid fever, independent of tumour necrosis factor alpha. Eur J Immunogenet. 2002;29:297–300. doi: 10.1046/j.1365-2370.2002.00318.x. [DOI] [PubMed] [Google Scholar]
- Dunstan SJ, Stephens HA, Blackwell JM, Duc CM, Lanh MN, Dudbridge F, Phuong CX, Luxemburger C, Wain J, Ho VA, Hien TT, Farrar J, Dougan G. Genes of the class II and class III major histocompatibility complex are associated with typhoid fever in Vietnam. J Infect Dis. 2001;183:261–268. doi: 10.1086/317940. [DOI] [PubMed] [Google Scholar]
- Durrant C, Zondervan KT, Cardon LR, Hunt S, Deloukas P, Morris AP. Linkage disequilibrium mapping via cladistic analysis of single-nucleotide polymorphism haplotypes. Am J Hum Genet. 2004;75:35–43. doi: 10.1086/422174. [DOI] [PMC free article] [PubMed] [Google Scholar]
- Forton J, Kwiatkowski D, Rockett K, Luoni G, Kimber M, Hull J. Accuracy of haplotype reconstruction from haplotype-tagging single-nucleotide polymorphisms. Am J Hum Genet. 2005;76:438–448. doi: 10.1086/428439. [DOI] [PMC free article] [PubMed] [Google Scholar]
- Gabriel SB, Schaffner SF, Nguyen H, Moore JM, Roy J, Blumenstiel B, Higgins J, DeFelice M, Lochner A, Faggart M, Liu-Cordero SN, Rotimi C, Adeyemo A, Cooper R, Ward R, Lander ES, Daly MJ, Altshuler D. The structure of haplotype blocks in the human genome. Science. 2002;296:2225–2229. doi: 10.1126/science.1069424. [DOI] [PubMed] [Google Scholar]
- Hoa NT, Diep TS, Wain J, Parry CM, Hien TT, Smith MD, Walsh AL, White NJ. Community-acquired septicaemia in southern Viet Nam: the importance of multidrug-resistant Salmonella typhi. Trans R Soc Trop Med Hyg. 1998;92:503–508. doi: 10.1016/s0035-9203(98)90891-4. [DOI] [PubMed] [Google Scholar]
- House D, Chinh NT, Hien TT, Parry CP, Ly NT, Diep TS, Wain J, Dunstan S, White NJ, Dougan G, Farrar JJ. Cytokine release by lipopolysaccharide-stimulated whole blood from patients with typhoid Fever. J Infect Dis. 2002;186:240–245. doi: 10.1086/341298. [DOI] [PubMed] [Google Scholar]
- Johnson GC, Esposito L, Barratt BJ, Smith AN, Heward J, Di Genova G, Ueda H, Cordell HJ, Eaves IA, Dudbridge F, Twells RC, Payne F, Hughes W, Nutland S, Stevens H, Carr P, Tuomilehto-Wolf E, Tuomilehto J, Gough SC, Clayton DG, Todd JA. Haplotype tagging for the Identification of common disease genes. Nat Genet. 2001;29:233–237. doi: 10.1038/ng1001-233. [DOI] [PubMed] [Google Scholar]
- Keuter M, Dharmana E, Gasem MH, van der Ven-Jongekrijg J, Djokomoeljanto R, Dolmans WM, Demacker P, Sauerwein R, Gallati H, van der Meer JW. Patterns of proinflammatory cytokines and inhibitors during typhoid fever. J Infect Dis. 1994;169:1306–1311. doi: 10.1093/infdis/169.6.1306. [DOI] [PubMed] [Google Scholar]
- Knight JC, Udalova I, Hill AV, Greenwood BM, Peshu N, Marsh K, Kwiatkowski D. A polymorphism that affects OCT-1 binding to the TNF promoter region is associated with severe malaria. Nat Genet. 1999;22:145–150. doi: 10.1038/9649. [DOI] [PubMed] [Google Scholar]
- Lin FY, Vo AH, Phan VB, Nguyen TT, Bryla D, Tran CT, Ha BK, Dang DT, Robbins JB. The epidemiology of typhoid fever in the Dong Thap Province, Mekong Delta region of Vietnam. Am J Trop Med Hyg. 2000;62:644–648. doi: 10.4269/ajtmh.2000.62.644. [DOI] [PubMed] [Google Scholar]
- Luxemburger C, Chau MC, Mai NL, Wain J, Tran TH, Simpson JA, Le HK, Nguyen TT, White NJ, Farrar JJ. Risk factors for typhoid fever in the Mekong delta, southern Viet Nam: a case-control study. Trans R Soc Trop Med Hyg. 2001;95:19–23. doi: 10.1016/s0035-9203(01)90318-9. [DOI] [PubMed] [Google Scholar]
- Migita O, Noguchi E, Koga M, Jian Z, Shibasaki M, Migita T, Ito S, Ichikawa K, Matsui A, Arinami T. Haplotype analysis of a 100 kb region spanning TNF-LTA identiWes a polymorphism in the LTA promoter region that is associated with atopic asthma susceptibility in Japan. Clin Exp Allergy. 2005;35:790–796. doi: 10.1111/j.1365-2222.2005.02265.x. [DOI] [PubMed] [Google Scholar]
- Moffatt MF, Cookson WO. Tumour necrosis factor haplotypes and asthma. Hum Mol Genet. 1997;6:551–554. doi: 10.1093/hmg/6.4.551. [DOI] [PubMed] [Google Scholar]
- Morris AP. Direct analysis of unphased SNP genotype data in population-based association studies via Bayesian partition modelling of haplotypes. Genet Epidemiol. 2005;29:91–107. doi: 10.1002/gepi.20080. [DOI] [PubMed] [Google Scholar]
- Parry CM, Hien TT, Dougan G, White NJ, Farrar JJ. Typhoid fever. N Engl J Med. 2002;347:1770–1782. doi: 10.1056/NEJMra020201. [DOI] [PubMed] [Google Scholar]
- Phuong CXT, Kneen R, Nguyen TA, Truong DL, White NJ, Parry CM, The Dong Nai Pediatric Center Typhoid Study Group A comparative study of ofloxacin and cefixime for treatment of typhoid fever in children. Pediatr Infect Dis J. 1999;18:245–248. doi: 10.1097/00006454-199903000-00007. [DOI] [PubMed] [Google Scholar]
- Stephens M, Smith NJ, Donnelly P. A new statistical method for haplotype reconstruction from population data. Am J Hum Genet. 2001;68:978–989. doi: 10.1086/319501. [DOI] [PMC free article] [PubMed] [Google Scholar]
- The International HapMap Project Nature. 2003;426:789–796. doi: 10.1038/nature02168. [DOI] [PubMed] [Google Scholar]
- The MHC sequencing Consortium Complete sequence and gene map of a human major histocompatibility complex. Nature. 1999;401:921–923. doi: 10.1038/44853. [DOI] [PubMed] [Google Scholar]
- Vinh H, Parry CM, Hanh VT, Chinh MT, House D, Tham CT, Thao NT, Diep TS, Wain J, Day NP, White NJ, Farrar JJ. Double blind comparison of ibuprofen and paracetamol for adjunctive treatment of uncomplicated typhoid fever. Pediatr Infect Dis J. 2004;23:226–230. doi: 10.1097/01.inf.0000114905.87426.c2. [DOI] [PubMed] [Google Scholar]
- Walsh EC, Mather KA, Schaffner SF, Farwell L, Daly MJ, Patterson N, Cullen M, Carrington M, Bugawan TL, Erlich H, Campbell J, Barrett J, Miller K, Thomson G, Lander ES, Rioux JD. An integrated haplotype map of the human major histocompatibility complex. Am J Hum Genet. 2003;73:580–590. doi: 10.1086/378101. [DOI] [PMC free article] [PubMed] [Google Scholar]
- Zeggini E, Thomson W, Kwiatkowski D, Richardson A, Ollier W, Donn R. Linkage and association studies of single-nucleotide polymorphism-tagged tumor necrosis factor haplotypes in juvenile oligoarthritis. Arthritis Rheum. 2002;46:3304–11. doi: 10.1002/art.10698. [DOI] [PubMed] [Google Scholar]
- Zhang L, Cui X, Schmitt K, Hubert R, Navidi W, Arnheim N. Whole genome amplification from a single cell: implications for genetic analysis. Proc Natl Acad Sci USA. 1992;89:5847–5851. doi: 10.1073/pnas.89.13.5847. [DOI] [PMC free article] [PubMed] [Google Scholar]