

Abstract
Profiling miRNA levels in cells with miRNA microarrays is becoming a widely used technique. Although normalization methods for mRNA gene expression arrays are well established, miRNA array normalization has so far not been investigated in detail. In this study we investigate the impact of normalization on data generated with the Agilent miRNA array platform. We have developed a method to select nonchanging miRNAs (invariants) and use them to compute linear regression normalization coefficients or variance stabilizing normalization (VSN) parameters. We compared the invariants normalization to normalization by scaling, quantile, and VSN with default parameters as well as to no normalization using samples with strong differential expression of miRNAs (heart–brain comparison) and samples where only a few miRNAs are affected (by p53 overexpression in squamous carcinoma cells versus control). All normalization methods performed better than no normalization. Normalization procedures based on the set of invariants and quantile were the most robust over all experimental conditions tested. Our method of invariant selection and normalization is not limited to Agilent miRNA arrays and can be applied to other data sets including those from one color miRNA microarray platforms, focused gene expression arrays, and gene expression analysis using quantitative PCR.
Keywords: miRNA profiling, microarray, normalization, invariants
INTRODUCTION
Micro-RNAs (miRNAs) are regulators of mRNA translation and stability that play key roles in a variety of processes, including development, cell proliferation, and differentiation (Alvarez-Garcia and Miska 2005; Pasquinelli et al. 2005; Fabbri et al. 2008). They are derived from long RNA precursors (pri-miRNA) that are first processed into hairpin miRNA precursors (pre-miRNA) of ∼70 nucleotides (nt), then into mature 19- to 25-nt-long single-stranded RNAs (Bartel 2004; Kim and Nam 2006). Release 11.0 of the miRBase database cataloged 678 human miRNAs (http://microrna.sanger.ac.uk) (Griffiths-Jones 2006). In order to quantify the expression of different mature molecules simultaneously, DNA microarray technology, originally developed for messenger RNA (mRNA) profiling, has been adapted to miRNAs (Krichevsky et al. 2003). In contrast to mRNA profiling, miRNA profiling must distinguish between mature miRNAs and their precursors and must also distinguish between miRNAs that differ in sequence by as little as a single nucleotide (Shingara et al. 2005). Commercial miRNAs microarrays are manufactured with a variety of design strategies. One approach uses locked nucleic acid (LNA)-modified capture probes that increase the stability of the hybrids and allow the discrimination between single nucleotide differences (Castoldi et al. 2006). These arrays are hybridized with two samples labeled with two different fluorescent colors (Cy3 and Cy5). Other approaches use a single-color array format with only one sample hybridized per array. Among those, Agilent Technologies has developed a miRNA profiling assay that is based on a highly efficient labeling method and a novel microarray probe design (Wang et al. 2007). This system's simple direct-labeling method has little sequence bias and normally requires only 100 ng of total RNA. Furthermore, the probe design strategy used with Agilent arrays provides both sequence and size discrimination for mature miRNAs.
An important goal of microarray data analysis is to remove systematic differences between samples that do not represent true biological variation. This is usually done at the data normalization stage of the analysis process. Different normalization methods have been used on miRNA microarray expression profiling data sets, but there is currently no clear consensus about their relative performances. Some have even chosen to omit normalization (Baskerville and Bartel 2005; Liang et al. 2005; Wang et al. 2007). The first normalization methods to be used with miRNA array data employed centering to median values (Sun et al. 2004; Castoldi et al. 2006; Garzon et al. 2006) or scaling based on total array intensities (Miska et al. 2004; Tian et al. 2008). Recently, quantile normalization, a popular method for large-scale mRNA array expression data, has also been used with miRNA data (Laurent et al. 2008; Sengupta et al. 2008). Another method developed for mRNA array data analysis—variance stabilizing normalization (VSN)—has also been applied to miRNA array data (Davison et al. 2006; Pan et al. 2008). VSN was developed for mRNA arrays and is based on a parameterized arsinh transformation (instead of a logarithmic transformation) that calibrates sample-to-sample variations and renders variance approximately independent of the mean intensity (Huber et al. 2002). VSN assumes that most genes are not differentially expressed (i.e., are invariant). This concept was used by Garzon et al. (2008), who based their normalization on a set of small noncoding “housekeeping” RNAs, and by Perkins et al. (2007), who used rank invariants. Overall, the normalization methods cited above were developed for the analysis of large-scale mRNA profiling data sets, and no assessment of their relative performances exists for miRNA data sets. Hua et al. (2008) investigated the effect of different normalization methods on data from a custom two-color microarray that does not differentiate between precursor and mature miRNAs. They evaluated the effectiveness of the methods by comparing the normalized microarray data to QPCR data. The correlation between the microarray and QPCR data tended to be low.
The objective of this study is to apply different normalization methods to miRNA profiling data sets generated using the one-color Agilent platform and to assess the impact on sensitivity, specificity, and fold-change measurement relative to QPCR. There are very significant differences between miRNA and mRNA data sets: the number of measurements is much smaller (a few hundred versus 10,000–50,000), and the majority of the miRNAs are either not expressed or are expressed at very low levels. Therefore, normalization methods used for mRNA expression array may not be appropriate for miRNA arrays. Considering the unique characteristics of miRNA profiling data, we have developed a method based on the minimal assumption that there exists a set of miRNAs whose expression is constant across all the arrays in the experiment (i.e., are invariant). The “invariant” probes are those that have medium-high mean intensity and low variance across arrays, and these probes are identified using mixture models of the mean and variance distributions (Fig. 1). Once these invariant probes are identified, we use robust linear regression to estimate scale and offset. In short, the method is a way to select stable expression miRNAs from the data, in contrast to an a priori preselection of “housekeeping” RNAs as described by Garzon et al. (2008) and the method of Perkins et al. (2007) that uses all probes. The performance of this normalization method was compared to that of no normalization as well as VSN, scaling, and quantile normalization.
FIGURE 1.

Example of invariant probes selection. Removal of standard deviation (SD)-versus-mean trend is done by fitting loess (red line) to the scatter plot of SD versus mean (inset scatter plot). The invariant probes are identified from the mean and corrected standard deviation (main scatter plot). Probes with high mean are indicated in color, probes with low mean are in black. (Green) high mean probes belonging to the lowest SD component (“invariants”). (Blue and magenta) High mean probes belonging to higher SD components. (Open red circle) Positive control probes. (Open red triangle) Negative control probes. (Dashed line) Mean and SD cutoffs.
RESULTS
Technical variability
We first evaluated the ability of the different normalization procedures to reduce the variability between technical replicates. Standard deviations and means were measured for the 100% brain and 100% heart samples separately (Fig. 2A,B). Data were split per quartiles (Q1–Q4) based on nonnormalized, nonlogged data in order to distinguish effects on weakly and strongly expressed miRNAs. The Agilent platform called 51%–52% of the miRNAs in the brain and 39%–43% of the miRNAs in the heart as undetected (signal standard deviation larger than signal mean). Therefore, the first quartile contains only undetected miRNAs and, as a result, should not be considered. The second quartile, which contains mostly undetected miRNAs (detection calls of between 9% and 11% and 1% and 2% for brain and heart RNA, respectively), allows assessment of the effect of the different methods on very weak expression signals. Except for VSN, the quartile mean distributions for the different preprocessing methods have similar distributions (Fig. 2A). As VSN uses an arsinh transformation instead of a log transformation, the spread of the means of Q2–Q4 are increased compared to the log transformed means. As shown in Figure 2B, the technical variability increases with the absolute expression when no normalization is applied. All four normalization methods decrease the technical variability for expressed miRNAs (Q4) with scaling being the least effective and invariant-based regression the most effective. The effects on Q2 and Q3 depend on the normalization method: VSN shows a very large increase in variability, quantile performs well for the brain samples, but not for the heart samples, and invariant-based regression as well as scaling slightly decrease the technical variability.
FIGURE 2.

Effect of normalization on technical reproducibility. Data from brain and heart tissue samples were separated by quartile (Q1, Q2, Q3, Q4) based on the mean of unlogged unnormalized expression signal of the three technical replicates. Q1 corresponds to the bottom quartile and Q4 to the top quartile. Mean of log2 signal intensity (A) and standard deviation (B) of technical replicates were calculated for each normalization method, in each tissue and each quartile. VSN expression signals (in base e) were converted to base 2. (White) no normalization, (red) quantile, (blue) invariants, (cyan) scaling, (green) VSN.
Sensitivity and specificity
To evaluate gains in sensitivity and specificity after normalization, a set of 59 miRNAs differentially expressed between brain and heart (true positives) were monitored in mixed brain–heart samples. True positives were defined as miRNAs in Q3 and Q4 (considering heart and brain samples together) with a minimum threefold change and a P value < 0.01 using all four normalization methods. We compared a 50% brain–50% heart mixture (Mixture 1) with a 75% brain–25% heart (Mixture 2) or a 95% brain–5% heart (Mixture 3) using a t test. The number of true positive miRNAs identified in these mixtures was plotted against the theoretical false discovery rate (FDR) (Benjamini and Hochberg 1995) as performed previously by Naef and Huelsken (2005). We obtained plots similar to standard receiver operating characteristic (ROC) plots where the area under the curves can be used to compare the sensitivity and specificity of the different methods (Fig. 3A,B). All the normalization improved sensitivity and specificity compared to no normalization (Fig. 3A,B). Quantile and invariants-based regression are best for Mixture 1 versus Mixture 3 (Fig. 3A). VSN performs as well as quantile and invarianst-based regression when the FDR is below 5%; the performance of VSN deteriorates as the FDR rises above 5%. This phenomenon is also observed for Mixture 1 versus Mixture 2 (Fig. 3B). VSN assumes that only a minority of features are differentially expressed. Since a large fraction of miRNAs are differentially expressed between the heart–brain mixtures, true differentially expressed miRNAs will be considered as invariants by VSN and their expression difference minimized. VSN allows computation of the transformation parameters on a subset of features that are known to be nondifferentially expressed before applying the transformation to the entire data set. Therefore, we used the set of invariants selected with our method to calculate the VSN transformation (VSN-Inv). The performance of the VSN-Inv normalization is much improved over standard VSN (Fig. 3A,B, magenta dashed line).
FIGURE 3.

Sensitivity and specificity of the normalization methods. (A,B) Fraction of positives recovered plotted against the FDR for a 50% brain–50% heart RNA mixture compared to a 95% brain–5% heart RNA mixture (A) or a 50% brain–50% heart RNA mixture compared to a 75% brain–25% heart RNA mixture (B). Positives were defined as miRNAs among the 50% most strongly expressed in comparison to the pure heart and brain RNA samples with at least a threefold expression difference and a P < 0.01 as measured using any normalization methods. VSN expression signals (in base e) were converted to base 2. (Black) No normalization, (red) quantile, (blue) invariants, (cyan) scaling, (green) VSN, (magenta dashed line) VSN using invariants selected as in our invariants normalization method.
Correlation with QPCR
When data from mRNA microarray experiments are compared with data generated with TaqMan assays, the microarray results, typically, show a compression of fold-change measures (Shi et al. 2006). In order to assess if miRNA microarray data have the same bias, we selected 17 miRNAs (16 from Q4 and 1 from Q3) covering the entire fold-change range observed in the microarray experiments and performed QPCR experiments with the same brain and heart RNA samples (Supplemental Table 1). We then compared the fold changes determined by microarray using the different normalization methods with the fold changes determined by QPCR (Fig. 4). A fold-change compression is observed for all methods. VSN is the method with the least compression. This reflects a deviation from the slopes obtained with the other methods. Each method, including no normalization, shows a very high correlation with the TaqMan results, thereby validating the quality of microarray data.
FIGURE 4.

Fold-change concordance between QPCR assays and microarrays. Seventeen miRNAs spanning the entire fold-change range between heart and brain samples were selected for validation with TaqMan assays. All expression signals were converted into log2 and the differences in means (M values) measured with the different normalization methods (y-axis) were plotted against those determined by TaqMan assays (x-axis). Dashed lines represent the 45° lines of complete concordance. The solid lines represent the results of the regression analysis. Correlation coefficient (r), slope (a), and intercept (b) of regression lines are indicated. Ninety-five percent confidence intervals are indicated in square brackets. Confidence intervals for correlation coefficients were calculated using Fisher's transformation.
Squamous carcinoma cell line data set
Comparing miRNA gene expression in brain and heart may not reflect accurately the type of experiment in which microarrays normally will be used. To do this, we tested the different normalization methods on microarray results from a system where fewer miRNA expression differences are expected. We chose to focus on a system involving p53, as several studies have been published that implicate miRNAs targets like miR-34a in the regulation of pathways affected by this protein (Xi et al. 2006; Chang et al. 2007; He et al. 2007; Tarasov et al. 2007). MiR-34a expression is induced by p53 both in mice and humans, and its overexpression induces cell cycle arrest (Chang et al. 2007; He et al. 2007). In the present study, we compared the miRNA profiles of the human squamous carcinoma cell line SCC13 infected with recombinant adenoviruses expressing either p53 or GFP (Ad-p53, Ad-GFP). As observed for the brain–heart data set, all normalization methods reduced the variability between technical replicates for expressed probes (Q4) with scaling being the least effective (data not shown). To assess the gain in power that normalization provides, we performed t tests on all the 556 miRNAs. The results are displayed in Q–Q plots with the number of significant miRNAs using an FDR cutoff of 5% (Fig. 5A). VSN-Inv is the method that identified the largest number of significant miRNAs. The six miRNAs identified as differentially expressed without normalization are found with all normalization methods. The invariants, quantile, VSN, and VSN-Inv methods identify 13 miRNAs in common, including 11 miRNAs also identified with scaling normalization (Supplemental Table 2). All miRNAs significant with invariants are also significant with VSN-Inv, and 20/23 significant miRNAs with VSN are significant with VSN-Inv. When the difference in mean (M value) is plotted as a function of the average expression (A value), we observe that a majority of the miRNAs have low fold changes (<1.5-fold) and that the VSN methods tend to identify more miRNAs with low A values. Micro-RNAs with low M values may be false positives and would be difficult to confirm by QPCR. Therefore, before proceeding to QPCR validation, we filtered the list of miRNAs for those for which at least one normalization method shows a significant differential expression with an absolute fold change of at least 1.5. We also filtered out miRNAs exhibiting an A value without normalization of below 4.5 (cut off to separate high mean from low mean miRNAs probes). Six up-regulated and four down-regulated miRNAs pass the filter. Among those, six were available as TaqMan assays and gave a detectable QPCR signal. Hsa-miR-34a, hsa-miR-149 (identified by all methods) and hsa-miR-200b (identified by Invariants, VSN, and VSN-Inv) were confirmed (Fig. 5C).
FIGURE 5.

Biological assessment of normalization methods using p53-induced miRNAs in human squamous carcinoma cell line SCC13. (A) Q-Q plots comparing the t statistics of Ad-p53 versus Ad-GFP samples (Sample Quantiles) against a t 10 distribution (Theoretical Quantiles). T statistics were calculated for the six Ad-p53 versus the six Ad-GFP samples (three biological replicates with two technical replicates) using data produced by each of the different normalized methods. Number of miRNAs and P values for a FDR cutoff of 5% are indicated. (B) Mean difference (M value) versus average expression (A value) plot for the different normalization methods. Probes with a FDR < 5% are indicated in open circles. (C) TaqMan QPCR validation of miRNAs. SCC13 cells were infected in biological triplicate with either Ad-GFP (white bars) or Ad-p53 (gray bars). Expression was calculated relative to the Z30 reference assay. Mean and standard error of four technical replicates are indicated.
DISCUSSION
In the present study, we have developed a novel miRNA profiling data normalization approach based on the selection of unchanged or invariant probes. We have compared this invariant-based normalization method with other normalization methods using two miRNAs expression profiling data sets with different characteristics: a comparison of two tissues where a large fraction of the miRNAs are differentially expressed and a data set from a cell line transfected with two different constructs where a much smaller number of miRNAs are affected. Similar conclusions can be drawn from the two data sets: (1) all normalization methods improve the data compared to nonnormalized data; (2) scaling normalization does not perform as well as VSN, quantile, and invariant-based normalization; and (3) VSN with default parameters may not perform as well as quantile and invariant-based normalization when a majority of miRNAs are differentially expressed, but VSN transformation parameters can be computed from a set of preidentified invariants to improve its performance.
Variability between samples can be generated from three sources: the true biological difference, the systematic variation that can be corrected through normalization, and the stochastic variation (noise). The normalization methods compared in this study make different assumptions about the true biological difference and the random noise in order to be able to estimate the systematic variation. Scaling assumes that the overall signal intensity does not change. This implies that the down-regulated miRNAs should equal the up-regulated miRNAs in magnitude of signal intensity or that the majority of miRNAs are unchanged. It also implies that the noise and the stochastic variations of miRNAs are proportional to the signal intensity. Although scaling normalization is a significant improvement compared to nonnormalized data, it does not perform as well as the other methods, particularly invariant-based regression, which also uses a linear approach. Invariant-based regression, by only taking into account the less-variable probes, will be less affected by large stochastic variations and large biological effects. Quantile normalization assumes that the overall distribution of signal intensity does not change. Whereas this assumption likely holds true for the comparison between p53 overexpressing versus control cells where few probes are affected, it may not be true for the brain–heart comparison where the distributions of expression profiles are significantly different. Under these conditions, although quantile normalization reduces the technical variability of the brain samples (Q2–Q4), it increases the technical variability of heart samples in Q2 and Q3 (Fig. 2B). Nevertheless, dilution experiments show that quantile normalization still has very good sensitivity and specificity when an FDR cutoff below 20% is used (Fig. 3). VSN and invariant-based regression assume that there is a subset of unchanged features (invariants). VSN used with default parameter settings assumes that most genes do not change, whereas the invariant-based regression presented in this study only assumes that a subpopulation of expressed genes does not change. This approach for selecting invariant miRNAs is particularly appropriate when one expects a significant fraction to be differentially expressed. In order to exploit the benefits of VSN (variance stabilization, arsinh function permissive to negative values), we have presented a method where VSN parameters are calculated from the invariant probes selected in the invariant-based regression procedure. However, one should note that VSN strongly affects the distribution of the large fraction of miRNAs whose expression is near or at background, resulting in a large increase of variability for those miRNAs (Fig. 2A,B).
Invariant-based methods were among the first approaches used to normalize mRNA gene microarray data (Li and Wong 2001; Tseng et al. 2001). In those applications, nondifferentially expressed genes are selected such that they occur in the same rank order on each chip. The intuitive justification for this is that the measured expression signal of a truly differentially expressed probe is more likely to have different rank relative to the other probes. Micro-RNA profiling platforms have many less features than mRNA gene expression profiling platforms (∼500 versus 10,000–50,000). Therefore, the probe for a truly differentially expressed gene may have a large difference in intensity without appreciably altering its rank order, and, therefore, it could be classified as invariant. Normalization based on predefined housekeeping genes, popular in QPCR, has also been used for miRNA profiling, where noncoding genes such as tRNA, U2, U4, and U6 small noncoding RNA as well as GAPDH mRNA were selected as invariants (Garzon et al. 2008). However, many housekeeping genes have been reported to exhibit considerable variability under different experimental conditions (Lee et al. 2002), and their expression levels are often relatively high, making them unrepresentative of the entire expression intensity range.
Our normalization approach based on invariant genes is data driven and requires no a priori selection of probes. It also has the advantage of avoiding the large proportion of probes near or at the background signal level. The only assumption of our procedure is a distinguishable low-SD/high-mean population as determined by a mixture model. This assumption is satisfied in the examples presented here. In some cases, it might not be possible to fit the data, for instance, if all probes have low mean and low SD. However, this will be obvious from diagnostic plots, such as Figure 1, which are indicative of the quality of the data set. For example, the standard deviation of the positive control probes before and after removal of the SD versus mean trend should be low and these probes should be among or close to the population of invariant probes. The loess curve before removal of the SD versus mean trend is indicative of the between-array variability. After invariants selection, if the variability between arrays is too high, a majority of the probes and the positive controls may not be found in the SD component with the lowest SD (low-SD/high-mean group).
With an increasing number of studies addressing the role of miRNAs in various physiological processes, miRNA profiling is becoming a standard bioanalytical technique. However, to our knowledge, no study has yet addressed the impact of normalization on mature miRNA profiling data. Here, we show that normalization is an important step in miRNA microarray data preprocessing. Since assumptions that are valid for messenger RNA profiling normalization may not hold for miRNA profiling, we propose to calculate the normalization parameters from a set of invariant probes. This method of invariant probe selection is not limited to Agilent miRNA profiling data, but can be generalized to other types of one-color arrays and other data types such as QPCR as well as medium-scale mRNA profiling (e.g., focused gene content DNA microarrays), which interrogate a few hundred probes.
MATERIALS AND METHODS
RNA samples and experimental design
Human heart and brain total RNA were from Stratagene (MVP human normal adult tissue RNA; Stratagene). Micro-RNA profiling of cell cultures was performed on the human keratinocyte-derived squamous cell carcinoma SCC13 cell line infected with either p53 overexpressing adenovirus (Adp53) or the control (AdGFP) for 24 h as previously described (Lefort et al. 2007). Cells were collected in Tri-Reagent (Sigma), and total RNA was extracted following the manufacturer's instructions (with the exception that three rounds of chloroform extraction were performed instead of one). To assess technical reproducibility, three technical replicates from brain and heart RNA were hybridized on Agilent human miRNA microarrays (Wang et al. 2007). To determine sensitivity and specificity, heart and brain RNA were mixed in the following ratios: 50% heart 50% brain, 25% heart 75% brain, and 5% heart 95% brain. Each of the dilutions was hybridized in a technical duplicate on Agilent human miRNA arrays (Human miRNA Microarray Kit #G4470A; Agilent Technologies, Inc.). To assess the effect of p53 expression on miRNA levels in the human SCC cell line, RNA from three biological replicates of p53-expressing versus control cells was hybridized in technical duplicates on the microarrays, resulting in a total of 12 hybridizations.
Target preparation and hybridization
Each sample was prepared according to the Agilent's miRNA Microarray System protocol. Total RNA (100 ng) was dephosphorylated with calf intestine alkaline phosphatase (GE Healthcare Europe GmbH), denatured with dimethyl sulfoxide, and labeled with pCp-Cy3 using T4 RNA ligase (GE Healthcare Europe GmbH). The labeled RNAs were hybridized to Agilent human miRNA microarrays for 20 h at 55°C with rotation. After hybridization and washing, the arrays were scanned with an Agilent microarray scanner using high dynamic range settings as specified by the manufacturer. Agilent Feature Extraction Software was used to extract the data. Data are accessible through NCBI GEO (Series record GSE12085).
Normalization
All normalization methods were performed on the Total Gene Signal from Agilent “GeneView” data files in R, an open source statistical scripting language (http://www.r-project.org). Except for VSN, data were log2 transformed after adding a small constant (16 for the SCC13 cell line data set, 28 for the brain/heart data sets) such that the smallest value of the data set was 1 before taking the log. Scaling normalization was performed by dividing each array by its mean signal intensity and then by rescaling to the global mean intensity of all arrays. Quantile normalization was performed using the “normalize.quantiles” function from R package “affy” from the Bioconductor project (http://www.bioconductor.org) (Bolstad et al. 2003). VSN uses an arcsinh value transformation that is tolerant to negative numbers; therefore, it was applied directly to the raw signal data using the “vsn” function with default parameters from the Bioconductor package “vsn” (Huber et al. 2002). For invariant-based normalization, we proceeded as follows:
The log transformed signal data of each array was centered on the mode value of its data density distribution. The density estimation was performed with the function “density” in R with default parameters. Roughly half of the miRNAs are not expressed or have a very low expression level. The distribution of these unexpressed miRNAs is narrow compared to the entire distribution, and its modal value corresponds to the modal value of the distribution of all miRNAs on the array. Therefore, the modal value is a good estimate of the background signal, and centering on this value allows for the correction of a difference in background intensity level.
Invariants were selected. The procedure is described in the following section.
Normalization coefficients were computed by robust regression using an M estimator with Huber influence function with default tuning constant (function “rlm” in R MASS package):
 where j indexes arrays and i indexes probes,
  is the vector of the mean expression of the invariants probes, and (aj,bj) are the regression coefficients. For each array, intensity values were scaled according to the regression coefficients.
Invariant selection
Invariant miRNAs were selected in two steps: (1) removal of SD versus mean trend and (2) identification of invariant probes from the mean and corrected standard deviation (Fig. 1).
Removal of SD versus mean trend is done by fitting a loess curve to the scatter plot of SD-versus-mean (function “loess” in R with default parameters). The fitted curve corresponds to the trend of SD as the function of the mean. Ideally, it should be flat so that when a curvature is observed, the expression measures have to be rescaled so that there is no trend using the formula
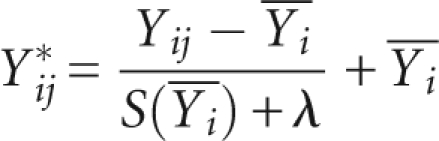 |
where i indexes all probes and  is the fitted loess curve and λ is a small constant of 0.1 to avoid division by a value that is close to 0. This transformation removes the trend in the SD versus mean scatter plot.
Invariant probes are those that have high mean expression across arrays and low SD (i.e., constitutive expression across arrays). Normal mixture models are fitted separately to the distribution of mean and corrected SD, using “mclust” package in R (Fraley and Raftery 2002). First, a mixture model with two components (i.e., expressed and nonexpressed miRNA) was fitted to the distribution of mean. The posterior probability of class membership is used to decide whether a probe is in a high expression or low expression group. Then, a mixture model was fitted to the standard deviations of the probes from the high expression group only. We ran the “Mclust” function of the “mclust” package with default parameters and let it find the model with the optimal number of components. The probes with more probability of being in the first component (smallest SD) were selected as invariants. Details of implementation of invariants normalization are described in the R script available at http://www.unil.ch/dafl/page58744.html.
miRNA expression profiling using TaqMan MicroRNA assays
Total RNA was reverse transcribed with looped microRNA-specific RT primers (Applied Biosystems) contained in the TaqMan MicroRNA Assays Human Panel Early Access Kit (Applied Biosystems, PN 4,365,381) and TaqMan microRNA Human Assays. Briefly, single-stranded cDNA was synthesized from 10 ngtotal RNA in 15-μL reaction volume with TaqMan MicroRNA Reverse Transcription Kit (Applied Biosystems), according to the manufacturer's protocol. The reaction was incubated at 16°C for 30 min followed by 30 min at 42°C and inactivation at 85°C for 5 min. Each cDNA was amplified with sequence-specific TaqMan microRNA Assays from Applied Biosystems. PCR reactions were performed on an Applied Biosystems 7900HT Sequence Detection system in 10 μL volumes in a 384-well plate at 95°C for 10 min, followed by 45 cycles of 95°C for 15 sec and 60°C for 1 min. All samples were tested in quadruplicate. The threshold cycle (Ct) values obtained with the SDS software (Applied Biosystems) were exported into qBase version 1.3.5, a Visual Basic Excel based script for the management and automated analysis of qPCR data (Hellemans et al. 2007). Ct values were transformed to relative quantities (RQ) and analyzed with geNorm 3.4 software (Vandesompele et al. 2002). This application for Microsoft Excel allows determination of the most stable reference gene from a set of candidate normalization genes (RNU24, RNU43, and Z30) in a given panel of cDNA samples. The small nucleolar RNA Z30 (AJ007733) was found to be the most stable and was subsequently used for normalization.
SUPPLEMENTAL MATERIAL
Supplemental material can be found at http://www.rnajournal.org.
ACKNOWLEDGMENTS
We thank Darlene Goldstein and Mauro Delorenzi for their critical comments of this paper.
Footnotes
Article published online ahead of print. Article and publication date are at http://www.rnajournal.org/cgi/doi/10.1261/rna.1295509.
REFERENCES
- Alvarez-Garcia I., Miska E.A. MicroRNA functions in animal development and human disease. Development. 2005;132:4653–4662. doi: 10.1242/dev.02073. [DOI] [PubMed] [Google Scholar]
- Bartel D.P. MicroRNAs: Genomics, biogenesis, mechanism, and function. Cell. 2004;116:281–297. doi: 10.1016/s0092-8674(04)00045-5. [DOI] [PubMed] [Google Scholar]
- Baskerville S., Bartel D.P. Microarray profiling of microRNAs reveals frequent coexpression with neighboring miRNAs and host genes. RNA. 2005;11:241–247. doi: 10.1261/rna.7240905. [DOI] [PMC free article] [PubMed] [Google Scholar]
- Benjamini Y., Hochberg Y. Controlling the false discovery rate: A practical and powerful approach to multiple testing. J. R. Stat. Soc. Ser. B Methodol. 1995;57:289–300. [Google Scholar]
- Bolstad B.M., Irizarry R.A., Astrand M., Speed T.P. A comparison of normalization methods for high density oligonucleotide array data based on variance and bias. Bioinformatics. 2003;19:185–193. doi: 10.1093/bioinformatics/19.2.185. [DOI] [PubMed] [Google Scholar]
- Castoldi M., Schmidt S., Benes V., Noerholm M., Kulozik A.E., Hentze M.W., Muckenthaler M.U. A sensitive array for microRNA expression profiling (miChip) based on locked nucleic acids (LNA) RNA. 2006;12:913–920. doi: 10.1261/rna.2332406. [DOI] [PMC free article] [PubMed] [Google Scholar]
- Chang T.C., Wentzel E.A., Kent O.A., Ramachandran K., Mullendore M., Lee K.H., Feldmann G., Yamakuchi M., Ferlito M., Lowenstein C.J., et al. Transactivation of miR-34a by p53 broadly influences gene expression and promotes apoptosis. Mol. Cell. 2007;26:745–752. doi: 10.1016/j.molcel.2007.05.010. [DOI] [PMC free article] [PubMed] [Google Scholar]
- Davison T.S., Johnson C.D., Andruss B.F. Analyzing micro-RNA expression using microarrays. Methods Enzymol. 2006;411:14–34. doi: 10.1016/S0076-6879(06)11002-2. [DOI] [PubMed] [Google Scholar]
- Fabbri M., Croce C.M., Calin G.A. MicroRNAs. Cancer J. 2008;14:1–6. doi: 10.1097/PPO.0b013e318164145e. [DOI] [PubMed] [Google Scholar]
- Fraley C., Raftery A.E. Model-based clustering, discriminant analysis, and density estimation. J. Am. Stat. Assoc. 2002;97:611–631. [Google Scholar]
- Garzon R., Pichiorri F., Palumbo T., Iuliano R., Cimmino A., Aqeilan R., Volinia S., Bhatt D., Alder H., Marcucci G., et al. MicroRNA fingerprints during human megakaryocytopoiesis. Proc. Natl. Acad. Sci. 2006;103:5078–5083. doi: 10.1073/pnas.0600587103. [DOI] [PMC free article] [PubMed] [Google Scholar]
- Garzon R., Garofalo M., Martelli M.P., Briesewitz R., Wang L., Fernandez-Cymering C., Volinia S., Liu C.G., Schnittger S., Haferlach T., et al. Distinctive microRNA signature of acute myeloid leukemia bearing cytoplasmic mutated nucleophosmin. Proc. Natl. Acad. Sci. 2008;105:3945–3950. doi: 10.1073/pnas.0800135105. [DOI] [PMC free article] [PubMed] [Google Scholar]
- Griffiths-Jones S. miRBase: The microRNA sequence database. Methods Mol. Biol. 2006;342:129–138. doi: 10.1385/1-59745-123-1:129. [DOI] [PubMed] [Google Scholar]
- He L., He X., Lim L.P., de Stanchina E., Xuan Z., Liang Y., Xue W., Zender L., Magnus J., Ridzon D., et al. A microRNA component of the p53 tumour suppressor network. Nature. 2007;447:1130–1134. doi: 10.1038/nature05939. [DOI] [PMC free article] [PubMed] [Google Scholar]
- Hellemans J., Mortier G., De Paepe A., Speleman F., Vandesompele J. qBase relative quantification framework and software for management and automated analysis of real-time quantitative PCR data. Genome Biol. 2007;8:R19. doi: 10.1186/gb-2007-8-2-r19. [DOI] [PMC free article] [PubMed] [Google Scholar]
- Hua Y.J., Tu K., Tang Z.Y., Li Y.X., Xiao H.S. Comparison of normalization methods with microRNA microarray. Genomics. 2008;92:122–128. doi: 10.1016/j.ygeno.2008.04.002. [DOI] [PubMed] [Google Scholar]
- Huber W., von Heydebreck A., Sultmann H., Poustka A., Vingron M. Variance stabilization applied to microarray data calibration and to the quantification of differential expression. Bioinformatics. 2002;18(Suppl. 1):S96–S104. doi: 10.1093/bioinformatics/18.suppl_1.s96. [DOI] [PubMed] [Google Scholar]
- Kim V.N., Nam J.W. Genomics of microRNA. Trends Genet. 2006;22:165–173. doi: 10.1016/j.tig.2006.01.003. [DOI] [PubMed] [Google Scholar]
- Krichevsky A.M., King K.S., Donahue C.P., Khrapko K., Kosik K.S. A microRNA array reveals extensive regulation of microRNAs during brain development. RNA. 2003;9:1274–1281. doi: 10.1261/rna.5980303. [DOI] [PMC free article] [PubMed] [Google Scholar]
- Laurent L.C., Chen J., Ulitsky I., Mueller F.J., Lu C., Shamir R., Fan J.B., Loring J.F. Comprehensive microRNA profiling reveals a unique human embryonic stem cell signature dominated by a single seed sequence. Stem cells (Dayton, Ohio) 2008;26:1506–1516. doi: 10.1634/stemcells.2007-1081. [DOI] [PubMed] [Google Scholar]
- Lee P.D., Sladek R., Greenwood C.M., Hudson T.J. Control genes and variability: Absence of ubiquitous reference transcripts in diverse mammalian expression studies. Genome Res. 2002;12:292–297. doi: 10.1101/gr.217802. [DOI] [PMC free article] [PubMed] [Google Scholar]
- Lefort K., Mandinova A., Ostano P., Kolev V., Calpini V., Kolfschoten I., Devgan V., Lieb J., Raffoul W., Hohl D., et al. Notch1 is a p53 target gene involved in human keratinocyte tumor suppression through negative regulation of ROCK1/2 and MRCKα kinases. Genes & Dev. 2007;21:562–577. doi: 10.1101/gad.1484707. [DOI] [PMC free article] [PubMed] [Google Scholar]
- Li C., Wong W.H. Model-based analysis of oligonucleotide arrays: Expression index computation and outlier detection. Proc. Natl. Acad. Sci. 2001;98:31–36. doi: 10.1073/pnas.011404098. [DOI] [PMC free article] [PubMed] [Google Scholar]
- Liang R.Q., Li W., Li Y., Tan C.Y., Li J.X., Jin Y.X., Ruan K.C. An oligonucleotide microarray for microRNA expression analysis based on labeling RNA with quantum dot and nanogold probe. Nucleic Acids Res. 2005;33:e17. doi: 10.1093/nar/gni019. [DOI] [PMC free article] [PubMed] [Google Scholar]
- Miska E.A., Alvarez-Saavedra E., Townsend M., Yoshii A., Sestan N., Rakic P., Constantine-Paton M., Horvitz H.R. Microarray analysis of microRNA expression in the developing mammalian brain. Genome Biol. 2004;5:R68. doi: 10.1186/gb-2004-5-9-r68. [DOI] [PMC free article] [PubMed] [Google Scholar]
- Naef F., Huelsken J. Cell-type-specific transcriptomics in chimeric models using transcriptome-based masks. Nucleic Acids Res. 2005;33:e111. doi: 10.1093/nar/gni104. [DOI] [PMC free article] [PubMed] [Google Scholar]
- Pan Q., Luo X., Chegini N. Differential expression of microRNAs in myometrium and leiomyomas and regulation by ovarian steroids. J. Cell. Mol. Med. 2008;12:227–240. doi: 10.1111/j.1582-4934.2007.00207.x. [DOI] [PMC free article] [PubMed] [Google Scholar] [Retracted]
- Pasquinelli A.E., Hunter S., Bracht J. MicroRNAs: A developing story. Curr. Opin. Genet. Dev. 2005;15:200–205. doi: 10.1016/j.gde.2005.01.002. [DOI] [PubMed] [Google Scholar]
- Perkins D.O., Jeffries C.D., Jarskog L.F., Thomson J.M., Woods K., Newman M.A., Parker J.S., Jin J., Hammond S.M. MicroRNA expression in the prefrontal cortex of individuals with schizophrenia and schizoaffective disorder. Genome Biol. 2007;8:R27. doi: 10.1186/gb-2007-8-2-r27. [DOI] [PMC free article] [PubMed] [Google Scholar]
- Sengupta S., den Boon J.A., Chen I.H., Newton M.A., Stanhope S.A., Cheng Y.J., Chen C.J., Hildesheim A., Sugden B., Ahlquist P. MicroRNA 29c is down-regulated in nasopharyngeal carcinomas, up-regulating mRNAs encoding extracellular matrix proteins. Proc. Natl. Acad. Sci. 2008;105:5874–5878. doi: 10.1073/pnas.0801130105. [DOI] [PMC free article] [PubMed] [Google Scholar]
- Shi L., Reid L.H., Jones W.D., Shippy R., Warrington J.A., Baker S.C., Collins P.J., de Longueville F., Kawasaki E.S., Lee K.Y., et al. The MicroArray Quality Control (MAQC) project shows inter- and intraplatform reproducibility of gene expression measurements. Nat. Biotechnol. 2006;24:1151–1161. doi: 10.1038/nbt1239. [DOI] [PMC free article] [PubMed] [Google Scholar]
- Shingara J., Keiger K., Shelton J., Laosinchai-Wolf W., Powers P., Conrad R., Brown D., Labourier E. An optimized isolation and labeling platform for accurate microRNA expression profiling. RNA. 2005;11:1461–1470. doi: 10.1261/rna.2610405. [DOI] [PMC free article] [PubMed] [Google Scholar]
- Sun Y., Koo S., White N., Peralta E., Esau C., Dean N.M., Perera R.J. Development of a microarray to detect human and mouse microRNAs and characterization of expression in human organs. Nucleic Acids Res. 2004;32:e188. doi: 10.1093/nar/gnh186. [DOI] [PMC free article] [PubMed] [Google Scholar]
- Tarasov V., Jung P., Verdoodt B., Lodygin D., Epanchintsev A., Menssen A., Meister G., Hermeking H. Differential regulation of microRNAs by p53 revealed by massively parallel sequencing: miR-34a is a p53 target that induces apoptosis and G1-arrest. Cell Cycle. 2007;6:1586–1593. doi: 10.4161/cc.6.13.4436. [DOI] [PubMed] [Google Scholar]
- Tian Z., Greene A.S., Pietrusz J.L., Matus I.R., Liang M. MicroRNA-target pairs in the rat kidney identified by microRNA microarray, proteomic, and bioinformatic analysis. Genome Res. 2008;18:404–411. doi: 10.1101/gr.6587008. [DOI] [PMC free article] [PubMed] [Google Scholar]
- Tseng G.C., Oh M.K., Rohlin L., Liao J.C., Wong W.H. Issues in cDNA microarray analysis: Quality filtering, channel normalization, models of variations, and assessment of gene effects. Nucleic Acids Res. 2001;29:2549–2557. doi: 10.1093/nar/29.12.2549. [DOI] [PMC free article] [PubMed] [Google Scholar]
- Vandesompele J., De Preter K., Pattyn F., Poppe B., Van Roy N., De Paepe A., Speleman F. Accurate normalization of real-time quantitative RT-PCR data by geometric averaging of multiple internal control genes. Genome Biol. 2002;3:research0034.1–research0034.11. doi: 10.1186/gb-2002-3-7-research0034. [DOI] [PMC free article] [PubMed] [Google Scholar]
- Wang H., Ach R.A., Curry B. Direct and sensitive miRNA profiling from low-input total RNA. RNA. 2007;13:151–159. doi: 10.1261/rna.234507. [DOI] [PMC free article] [PubMed] [Google Scholar]
- Xi Y., Shalgi R., Fodstad O., Pilpel Y., Ju J. Differentially regulated micro-RNAs and actively translated messenger RNA transcripts by tumor suppressor p53 in colon cancer. Clin. Cancer Res. 2006;12:2014–2024. doi: 10.1158/1078-0432.CCR-05-1853. [DOI] [PubMed] [Google Scholar]