

Abstract
Metastasis to bone is the leading cause of morbidity and mortality in advanced prostate cancer patients. Considering the complex reciprocal interactions between the tumor cells and the bone microenvironment, there is increasing interest in developing combination therapies targeting both the tumor growth and the bone microenvironment. In this study, we investigated the effect of simultaneous blockade of BMP pathway and RANK-RANKL axis in an osteolytic prostate cancer lesion in bone. We used a retroviral vector encoding noggin (Retronoggin) to antagonize the effect of BMPs and RANK: Fc, which is a recombinant RANKL antagonist was used to inhibit RANK-RANKL axis. The tumor growth and bone loss were evaluated using plain radiographs, hind limb tumor measurements, micro PET-CT (18F- fluorodeoxyglucose [FDG] and 18F-fluoride tracer), and histology. Tibias implanted with PC-3 cells developed pure osteolytic lesions at 2 weeks with progressive increase in cortical bone destruction at successive time points. Tibias implanted with PC-3 cells over expressing noggin (Retronoggin) resulted in reduced tumor size and decreased bone loss compared to the implanted tibias in untreated control animals. RANK: Fc administration inhibited the formation of osteoclasts, delayed the development of osteolytic lesions, decreased bone loss and reduced tumor size in tibias implanted with PC-3 cells. The combination therapy with RANK: Fc and noggin over expression effectively delayed the radiographic development of osteolytic lesions, and decreased the bone loss and tumor burden compared to implanted tibias treated with noggin over expression alone. Furthermore, the animals treated with the combination strategy exhibited decreased bone loss (micro CT) and lower tumor burden (FDG micro PET) compared to animals treated with RANK: Fc alone. Combined blockade of RANK-RANKL axis and BMP pathway resulted in reduced tumor burden and decreased bone loss compared to inhibition of either individual pathway alone in osteolytic prostate cancer lesion in bone. These results suggest that simultaneous targeting of tumor cells and osteoclasts may be the most effective method of inhibiting the progression of established osteolytic metastatic lesions in vivo.
Introduction
Prostate cancer is the most frequently diagnosed cancer and the second most common cause of cancer death among men in the United States [1]. Prostate cancer has a high propensity to metastasize to bone and a significant number of patients with advanced disease have bony lesions [2]. These bony lesions result in various complications including intractable bone pain, pathological fracture and neurological deficits, which are a considerable source of morbidity [3, 4]. In addition, metastatic bone disease is associated with poor prognosis and decreased survival in prostate cancer patients. Metastasis to bone is not curable with the currently available treatment regimens and palliation of symptoms is the primary goal of treatment.
Although the vast majority of prostate cancer lesions exhibit an osteoblastic phenotype, a small percentage of lesions exhibit a mixed lytic/blastic phenotype or a purely lytic phenotype. The development and progression of osteolytic bone metastasis involves a complex vicious cycle that includes reciprocal interactions between the tumor cells, bone cells (osteoclasts and osteoblasts) and the bone matrix [5-8]. The tumor cells secrete various soluble factors that promote osteoclast differentiation and activation, which leads to increased osteolysis [1, 6, 9, 10]. The growth factors mobilized from the bone following osteolysis support the growth and survival of the tumor cells. In addition, tumor cells themselves respond to the secreted cytokines in an autocrine manner which stimulates cell growth [1, 6]. Finally, the growing tumor secretes more pro-osteolytic factors, which results in further osteolysis and perpetuation of the vicious cycle [11]. Osteolysis in metastatic bone disease is mediated by osteoclasts. Osteoclastogenesis involves critical interaction of RANKL (receptor activator of nuclear factor kB ligand), RANK (receptor activator of nuclear factor kB) and its decoy receptor osteoprotegrin (OPG) [12-15]. RANKL interacts with RANK receptor present on the osteoclast surface, which activates multiple intracellular signaling cascades leading to increased formation, maturation and survival of the osteoclasts [12, 14, 15]. Human oncogenic cell lines producing osteolytic or mixed osteolytic/osteoblastic lesions have been reported to secrete soluble RANKL [16-18]. RANKL activity can be antagonized by RANK: Fc, a recombinant fusion protein which has shown to be successful in limiting osteolysis in animal models of bone metastasis [19-21].
Bone morphogenetic proteins (BMPs) are members of the transforming growth factor-β (TGF-β) superfamily and primarily function as osteogenic factors [22]. In addition, BMPs have pleiotropic roles in cell growth, differentiation, migration, and apoptosis [23]. BMP mRNA expression has been documented in a variety of human oncogenic cell lines including breast, lung and prostate cancer [24-28]. BMP receptors have also been reported to be present on the human prostate and lung cancer cell lines, which influence their growth in response to BMPs [19, 29-32]. Previous studies in our laboratory have shown that human prostate cancer cells forming osteolytic lesions demonstrate increased proliferation, migration and invasion in response to exogenous BMPs in vitro [32]. This proproliferative effect of BMPs on the human prostate cancer cells is blocked by addition of its natural antagonist, noggin in vitro. Furthermore, over expression of noggin in vivo blocks BMP mediated tumor growth following intratibial implantation of prostate cancer cells [32].
The purpose of this study was to determine the influence of dual targeting of RANK-RANKL axis (osteoclast activity) and BMP pathway (tumor growth) in the progression of osteolytic prostate cancer lesions in a murine intratibial injection model. We used a retroviral vector encoding noggin to antagonize the effect of BMPs and RANK: Fc was used to inhibit the RANK-RANKL axis.
Materials and methods
Cell line
The human prostate cancer cell line PC-3 was used in this study. PC-3 cells form pure osteolytic lesions when injected into the long bones of immune compromised mice [16]. PC-3 cells were cultured in RPMI medium (Sigma-Aldrich) supplemented with 10% fetal bovine serum (FBS, Omega Scientific Inc.) and maintained at 37°C in a humidified incubator with 5% CO2.
RANK: Fc
The RANK: Fc used in this study was generously provided by Amgen Inc. (Thousand Oaks, CA) RANK: Fc is a recombinant RANKL antagonist formed by fusing the extracellular domain of RANK with Fc portion of human immunoglobulin G (IgG1). RANK: Fc was used in dose of 15 mg/kg dissolved in a 100 micro liter (μl) of phosphate buffer saline (PBS).
Retroviral vector production and transduction of PC 3 cells
The retrovirus containing noggin cDNA was created according to a previously published protocol [32]. PC-3 cells were transduced with retrovirus containing noggin cDNA (RetroNog) as described previously [32]. Briefly, 1 × 10⁵ PC-3 cells were plated on a sterile culture dish in RPMI medium with 10% FBS. The cells were washed once with 1% PBS, and 2 ml fresh medium containing the retrovirus at an MOI of 100 was added to the cells. The virus was allowed to incubate with the cells for 2 hr at 37°C, after which the virus containing media was removed and the cells harvested for intra tibial injection 24 hrs after viral infection.
Tibial implantation of PC-3 cells
Eight week-old male severe-combined immunodeficient (SCID) mice were housed under pathogen-free conditions in accordance with the protocol approved by the Chancellor’s Animal Research Committee (ARC) at the author’s institution. A murine intratibial injection model of bone metastasis was used to create osteolytic lesions in this study [16, 32]. 1 × 10⁵ prostate cancer cells were prepared in 10 (μl) of 1% PBS with 10 μl of Matrigel (BD biosciences) for each tibial injection. 20 μl of the cell and matrigel mix was injected into the proximal tibia of 8 week-old SCID mice as described previously [32]. Briefly, the mice were anesthetized using 1.5-2 % isoflurane and oxygen. The overlying skin was prepped in sterile fashion with 70% ethanol and betadine. A 3 millimeter (mm) longitudinal incision was made over the patellar ligament with a number 12 scalpel blade, and then a 2-mm longitudinal incision was made along the medial border of the patellar ligament to the tibial plateau. A 26 ½ gauge needle was introduced through the proximal tibial plateau and 20 μl of the PC-3 cells and matrigel mixture was injected into the medullary cavity. The wound was closed with a single 5-0 Vicryl suture (Ethicon Inc.).
Study groups
In this study, there were five experimental groups and all the animals underwent tibial implantation of 1 × 10⁵ prostate cancer cells (Table 1). Five animals in each group underwent serial micro PET-CT at 2, 4, 6 weeks and comprised the imaging subgroup (Table 1). Group I (PC-3) animals received intratibial injection of PC-3 cells alone. Group II (PC-3 + EV) tibias received PC-3 cells that were transduced with a retrovirus containing empty vector (EV) to control for retroviral transduction. Group III (PC-3 + RetroNog) animals received PC-3 cells that were transduced with a retroviral vector over expressing noggin cDNA (RetroNog). Tibias in Group IV (PC-3 + RANK: Fc) were implanted with PC-3 cells and animals were subsequently treated with RANK: Fc, which was administered subcutaneously. Group V (PC-3 RetroNog + RANK: Fc) tibias were implanted with PC-3 cells that were transduced with RetroNog and animals were also treated with RANK: Fc. RANK: Fc was administered subcutaneously to Group IV and V animals two times a week starting on the day of tibial implantation of cancer cells and continued for a total of 6 weeks.
Table 1.
Study Groups
| Groups | No. studied radiographically | No. studied with micro PET and micro CT | No. studied histologically |
|---|---|---|---|
| I: PC-3 | 12 | 5 | 12 |
| II: PC-3+EV (Empty Vector) | 5 | 5 | 5 |
| III: PC-3+RetroNog (RN) | 12 | 5 | 12 |
| IV: PC-3+RANK: Fc | 12 | 5 | 12 |
| V: PC-3+RetroNog +RANK: Fc | 12 | 5 | 12 |
Hind limb measurements
Maximum hind limb measurements were recorded in two bisecting planes for both the hind limbs with an electronic caliper at 2, 4 and 6 weeks. The tumor volume was calculated according to the previously published protocol [19, 32].
Radiographic analysis
The animals were anesthetized and radiographs were obtained using a Faxitron (Field Emission Corp., McMinnville, OR) at 2, 4, and 6 weeks. Three independent reviewers blinded to the treatment groups analyzed the radiographs for the presence of osteolytic lesions according to a previously established protocol [32]. Radiographs were scored as follows: 0—normal; 1—lytic lesion present within the medullary canal only; 2—obliteration of one cortex; 3—obliteration of two cortices.
Radiotracer preparation
Fluoride ion was produced using O-18 water and proton bombardment using a RDS cyclotron (CTI). 18F-fluoride ion was produced at specific activities of approximately 1000 Ci/mmol and 18F- fluorodeoxyglucose (FDG) was synthesized at specific activities of approximately 5000 mCi/mmol as described previously [33].
Micro PET-CT imaging protocol
Animals in the imaging subgroups underwent positron emission tomography scans and micro CT at 2, 4 and 6 weeks according to a previously established protocol at the author’s institution [33]. Briefly, mice were anaesthetized with 1.5-2 % isoflurane and oxygen in induction chambers. The mice were then directly injected with approximately 250 μCi of 18F-FDG via tail vein using a 27 gauge needle threaded to a polyethylene catheter. The animals were administered maintenance anesthesia with 2% isoflurane in the isolation bed system during the period of radiotracer uptake. Bladders were manually expressed five minutes prior to imaging and animals were positioned in a portable multimodality bed system consisting of a lucite chamber with anesthesia ports and raised platform. Whole-body scans were performed with a 10-minute acquisition time using a MicroPET® FOCUS 220 system (CTI Concorde Microsystems LLC). Immediately afterwards, a non-contrast-enhanced microCT study using microCAT® II (ImTek Inc.) imaging system was used to scan animals with a 10-minute acquisition time. PET scan images were reconstructed using filter-back projection and an iterative three-dimensional reconstruction technique (MAP). MicroPET and microCAT® images were then merged for analysis for use with AMIDE® software. The animals were injected with 18F-fluoride ion the next day using the same acquisition protocol.
Quantitative analysis of micro PET-CT data
PET and CT scan data was analyzed and quantified by AMIDE® (Amide’s a Medical Image Data Examiner) version 0.7.154 as described previously [33]. Briefly, regions of interest (ROIs) were drawn using a ROI tool over bilateral tibial plateaus that were three-dimensionally reconstructed to confine all discernible signal uptakes. Using ROI boxes of the same size, data analysis tools were used to calculate maximum, median and mean signal intensity in both contralateral and tumor tibias. To quantify the lesion size, 3D isocontour ROI was drawn in the tumor tibia using the maximum FDG signal intensity in the contralateral tibia as the threshold. The lesion size on FDG micro PET scans was expressed as mm3. MicroCT images were used to identify and quantify osteolytic lesions. The microCT images were cropped to include both the tibias using AMIDE® software. A standardized isocontour value was used to threshold for the cortical bone. The amount of bone loss was measured by subtracting the tumor tibial ROIs from control tibial ROIs and expressed as a percentage [33].
Histologic analysis
Animals were euthanized at 2, 4 and 6 weeks for histologic and histomorphometric analysis. The hind limbs were amputated at the level of distal femur and ankle to harvest the specimen enblock. The harvested tibias were fixed in 10% buffered formalin followed by decalcification in 10% EDTA solution for 2 weeks at room temperature with gentle mechanical stirring. Following decalcification the samples were embedded in paraffin and saggital sections obtained. The sections were stained with hematoxylin and eosin (H&E), orange green (OG) and tartrate-resistant acid phosphate (TRAP) stains. Histomorphometric analysis was performed on an Olympus system (Olympus, Melville, NY) using the BIOQUANT software (BIOQUANT Image Analysis Corp.) as previously described [19, 31].
Statistical analysis
P values < 0.05 were considered to be statistically significant. The radiographic results were assessed qualitatively to score the amount of bone loss. The tumor sizes, micro PET, micro CT, and histomorphometric data in the study groups were compared using one way ANOVA followed by post hoc test (Newman Keuls).
Results
Plain radiographs
All the animals in Group I (PC-3) and Group II (PC-3 + EV) demonstrated an osteolytic lesion in the proximal tibia on a plain radiograph at 2 weeks following intratibial injection of prostate cancer cells. The radiographs at successive time points (4 and 6 weeks) in Group I and II animals demonstrated a progressive increase in osteolysis with most of the upper two-thirds of the tibia destroyed at the end of 6 weeks (Fig. 1). Plain radiographs of all the animals in treatment Group III (PC-3 + RetroNog) also demonstrated an osteolytic lesion in the proximal tibia at 2 weeks. However, the osteolytic lesions were smaller in Group III tibias at 2 and 4 weeks with bony destruction limited to the upper half of the tibia at the end of 6 weeks (Fig.1). In contrast to the control group animals (Group I and II), none of the radiographs demonstrated an osteolytic lesion in Group IV (PC-3 + RANK: Fc) and Group V (PC-3 + RetroNog + RANK: Fc) tibias at 2 weeks. The radiographs at 4 weeks demonstrated an osteolytic lesion in all the tibias of Group IV animals and 8/10 tibias in Group V animals. All the animals in Group V had osteolytic lesions at 6 weeks.
Fig. 1.
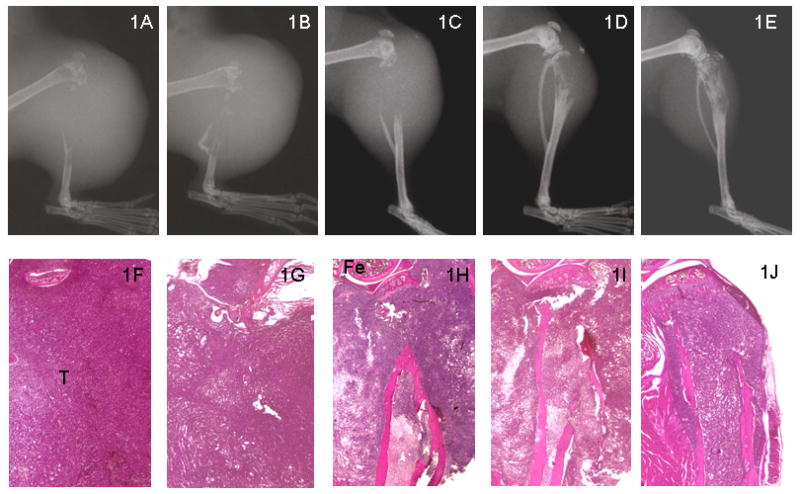
Representative radiographs (top panel; 1A-1E) and H&E histologic sections (bottom panel; 1F-1G) of SCID mice tibias at 6 weeks following intratibial injection of tumor cells. There is no cortical bone present in the proximal tibias of PC-3 (1A & 1F) and PC-3+EV (1B & 1G). However, there is limited destruction of proximal tibias in PC-3+RANK: Fc (1D & 1I) and PC-3 RetroNog + RANK: Fc (1E & 1J) compared to control animals and PC-3 retronog treated tibias (1C & 1H) at 6 weeks. Fe, femur; T, Tumor cells
Hind limb tumor size
The tumor sizes were calculated from the of the hind limb measurements in antero-posterior and medio-lateral plane. The hind limb tumor sizes at 4 and 6 weeks were significantly lower (p<0.05) in Group III (PC-3 + RetroNog), Group IV (PC-3 + RANK: Fc) and Group V (PC-3 + RetroNog + RANK: Fc) animals when compared to Group I (PC-3) and Group II (PC-3 + EV) animals (Fig. 2). Group V animals had significantly lower hind limb tumor sizes (p<0.001) compared to Group III animals at 4 and 6 weeks. The tumor sizes in Group V animals were lower but not statistically different from the Group IV animals (p>0.05) at 4 and 6 weeks.
Fig. 2.
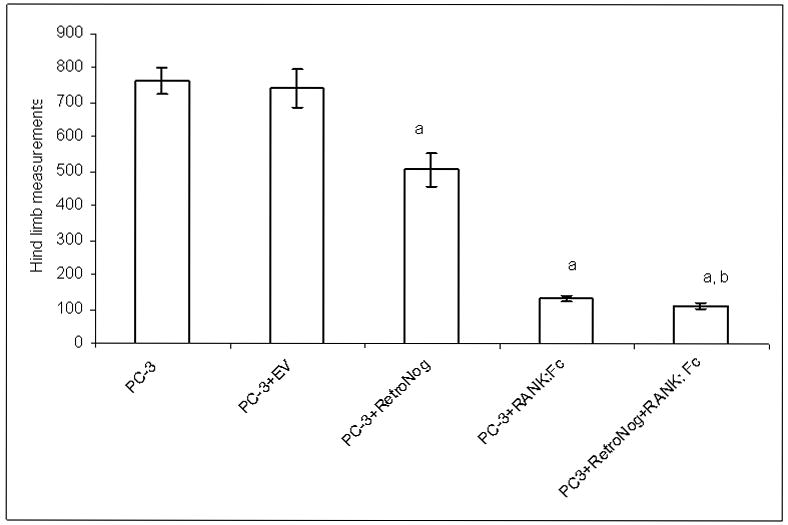
Mean hind limb tumor sizes at 6 weeks (aP< 0.05 versus PC-3 and PC-3+EV; bP<0.05 versus PC-3+RN)
Micro CT
Micro CT scans were performed at 2, 4, and 6 weeks for longitudinal assessment of bone loss following intratibial injection of prostate cancer cells (Fig. 3). MicroCT imaging revealed osteolytic lesions in form of cortical radiolucency and cortical destruction in the proximal tibia of all the animals in Group I (PC-3, n=5), Group II (PC-3 + EV, n=5) and Group III (PC-3 + RetroNog, n=5) at 2 weeks (Fig. 4). In contrast to the plain radiographs of Group IV (PC-3 + RANK: Fc) tibias at 2 weeks which did not reveal any bony lesion, micro CT imaging demonstrated cortical discontinuity in the posterior cortex of proximal tibia in 4/5 animals at 2 weeks. MicroCT imaging did not reveal any osteolytic lesions in tibias of Group V (PC-3 + RetroNog + RANK: Fc) animals until 4 weeks.
Fig. 3.
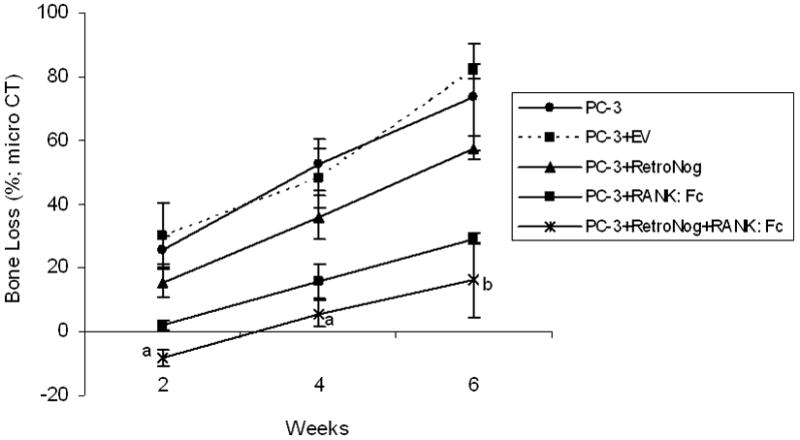
Serial estimation of bone loss in the implanted tibias in study groups as measured on micro CT at 2, 4 and 6 weeks (aP< 0.05 versus PC-3, PC-3+EV, PC-3+RN, and PC-3+RANK:Fc; bP<0.05 versus PC-3, PC-3+EV and PC-3+RN)
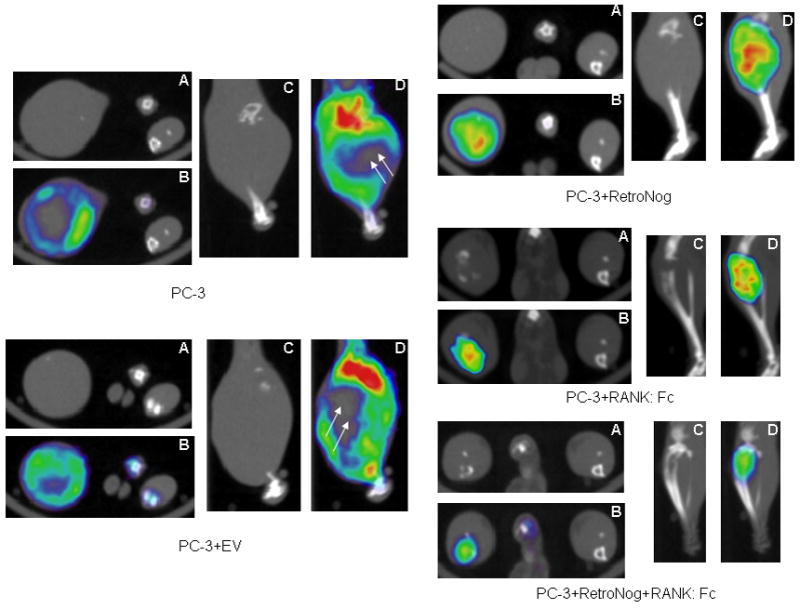
Fig. 4.
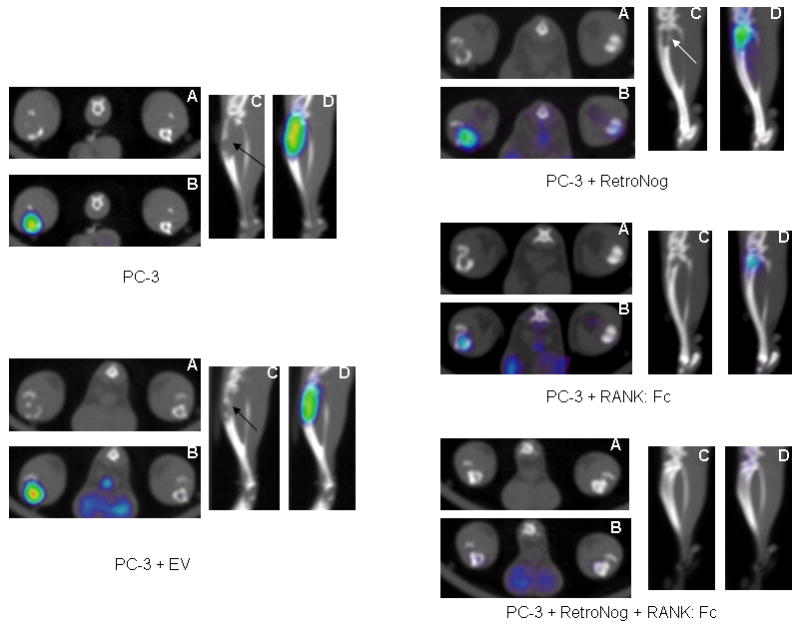
18F-Fluorodeoxyglucose (FDG) micro PET-CT at 2 weeks in the study groups (A- micro CT, transverse view; B-micro PET-CT overlay, transverse view; C- micro CT, saggital view; D- micro PET-CT overlay, saggital view). Micro PET-CT demonstrates increased FDG tracer uptake and cortical destruction (black/white arrow) in PC-3, PC-3+EV, PC-3+RetroNog and PC-3+RANK: Fc group tibias. However, minimal FDG tracer uptake was present in PC-3+RetroNog+RANK: Fc group tibia at 2 weeks.
The bone loss in injected tibias was calculated in the control animals (Group I and II) and treatment group animals (Group III, IV and V) at each time point (Fig.3). The mean percentage loss of bone in the tibias of Group I (25.5±4.3 % at 2 weeks, 52.4±8 % at 4 weeks, and 73.5±16.4% at 6 weeks) and Group II animals (30±10% at 2 weeks, 48.1±9.1% at 4 weeks, 81.73±2.2% at 6 weeks) were significantly higher (p<0.05) at all time points when compared to the tibias of the Group III (15.4±4.3% at 2 weeks, 35.8±7% at 4 weeks, and 57.5±3.7% at 6 weeks) Group IV(1.9±1.4 % at 2 weeks, 15.7±5.4% at 4 weeks and 29.1±1.7% at 6 weeks) and Group V animals (-8.3±2.45% at 2 weeks, 5.6±4% at 4 weeks and 16.2±11.8% at 6 weeks). Furthermore, Group V tibias had significantly lower mean percentage loss of bone compared to Group III tibias (p<0.001) at all time points and Group IV tibias (p<0.05) at 2 and 4 weeks.
18F- fluorodeoxyglucose micro PET
Micro PET with 18F- fluorodeoxyglucose (FDG) which correlates with cellular glucose metabolism was used for the detection and longitudinal monitoring of tumor cell activity. Increased 18F-FDG (mean and maximum values) signal uptake was detected in the proximal portion of implanted tibias of all the animals in Group I (PC-3, n=5) and Group II (PC-3 + EV, n=5) at 2 weeks suggesting preferential FDG tracer uptake by the active tumor cells (Table 2 and Fig. 4). Increased 18F-FDG (mean and maximum values) signal uptake was also demonstrated in the implanted tibias in all the Group III (PC-3 + RetroNog, n=5) and Group IV (PC-3 + RANK: Fc, n=5) animals at 2 weeks. However, there was no or minimal increase in mean and maximum signal intensity of FDG tracer in the injected tibias of Group V animals (PC-3 + RetroNog+ RANK: Fc; n=5) at 2 weeks.
Table 2.
18F-fluorodeoxyglucose (FDG) micro PET lesion sizes at 2, 4, and 6 weeks
| Groups | FDG lesion size at 2 weeks (mm3) | FDG lesion size at 4 weeks (mm3) | FDG lesion size at 6 weeks (mm3) |
|---|---|---|---|
| I: PC-3 | 44.9±11.4a | 263±57.3a | 555.9±206.6 |
| II: PC-3+EV | 50.2±20.5a | 334±99.2a | 592.5±215.8 |
| III: PC-3+RetroNog | 18.7±7 | 125.8±30.7 | 758.8±67.4 |
| IV: PC-3 + RANK: Fc | 14.3±3.4 | 65.8±41.6 | 364.7±96.6 |
| V: PC-3 + RetroNog + RANK: Fc | 1.5 ±0.71 | 12.2±6.6 | 110.4±45b |
P<0.05 versus Groups III, IV and V
P<0.05 versus Groups III and IV
18F-FDG tracer uptake values were used to quantify and compare the lesion size among experimental group animals. The lesion size on 18F-FDG micro PET scans in control group animals (PC-3 and PC-3 + EV) were significantly higher (p<0.05) than Group III, Group IV and Group V tibias (Fig. 4 and 5). However, the lesion sizes at 6 weeks in Group III tibias were not significantly different from that of tibias in control animals (Group I and II). This was due to reduced tracer uptake in the center of large tumors in the control group animals (Group I and Group II) which could possibly be due to necrosis (Fig. 5 and Table 2). The 18F-FDG lesion sizes in Group V tibias (PC-3 RN + RANK: Fc) at 6 weeks were significantly lower than Group III (p<0.001) and Group IV (p<0.01) tibias (Table 2).
Fig. 5.
18F-Fluorodeoxyglucose (FDG) micro PET-CT scans at 6 weeks following intratibial injection of tumor cells. (A- micro CT, transverse view; B-micro PET-CT overlay, transverse view; C- micro CT, saggital view; D- micro PET-CT overlay, saggital view). Bone loss was limited to proximal tibia in PC-3+RANK: Fc and PC-3 + RetroNog + RANK: Fc group animals at 6 weeks while no host bone was present proximally in PC-3 and PC-3 +EV implanted tibias. There is minimal or no FDG uptake (double white arrows) in the central part of the tumor in PC-3 and PC-3+EV group tibias at 6 weeks.
18F-fluoride micro PET
18F-fluoride ion is a positron-emitting isotope with high affinity to bone. It has been shown to be preferentially deposited on the surface of the bone proportionate to the blood flow and bone remodeling [34, 35]. Increased 18F-fluoride signal uptake (mean and median signal values) were present in the proximal tibias at 2 weeks when compared to the contralateral control tibias in Group I (PC-3) and Group II (PC-3 + EV) animals. However, there was no or minimal uptake of fluoride tracer in the proximal tibias of Group I and Group II animals at 4 and 6 weeks. This was because no host bone was available for the tracer uptake in the proximal tibia at 4 and 6 weeks. However, increased fluoride activity was present at the tumor bone interface distally. In the treatment group animals, there was increased mean and median signal intensity of fluoride tracer in the implanted tibias of Group III and Group IV animals at 2 weeks compared to the contralateral control tibias. However, there was minimal or no increase in mean and median signal intensity of fluoride tracer uptake in injected tibias of Group V animals at 2 weeks. However, tumor mediated bone destruction in proximal tibia and uptake of fluoride tracer by the growth plates prevented accurate interpretation and comparison of fluoride signal uptake values in the study group animals at all time points.
Histology and histomorphometry
Histologic sections were taken at each time point in the study groups. As early as 2 weeks, Group I (PC-3) and Group III (PC-3 + RetroNog) tibias demonstrated cortical destruction on hematoxylin and eosin stained sections. Host bone in the proximal tibia was completely destroyed on histologic sections at 6 weeks (Fig.1). However, cortical destruction was not noted in Group IV (PC-3 + RANK: Fc) and Group V (PC-3 + RetroNog + RANK: Fc) tibias until 4 weeks. The number of osteoclasts per millimeter at tumor bone interface were significantly lower (p<0.05) in TRAP stained sections from Group IV and Group V tibias when compared to Groups I , II and III tibias (Fig. 6). However, there were no significant differences with respect to the number of osteoclasts/ mm in Group IV and Group V specimens at any time point. Moreover, the osteoclasts in Group IV and Group V tibias were smaller and flattened compared to osteoclasts in Group I, II and III tibias (Fig 6).
Fig. 6.
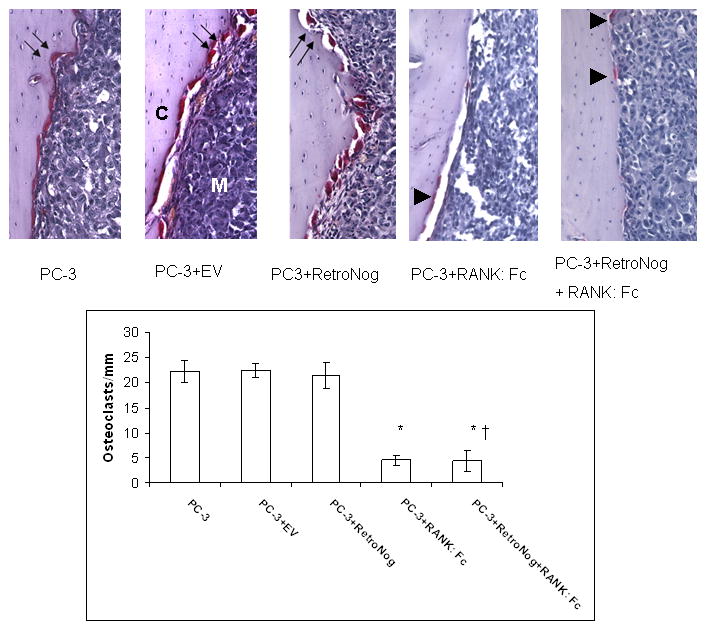
TRAP stained histology sections (10X, top panel) and histomorphometric analysis (bottom panel) in the study group tibias. Abundant TRAP positive osteoclasts occupying the resorption pits (double black arrows) were present at the tumor bone interface in PC-3, PC-3+EV and PC-3+RetroNog tibias at 2 weeks. Tibias treated with RANK: Fc (PC-3+RANK: Fc and PC-3+RetroNog+RANK: Fc group) demonstrated small and flattened osteoclasts (black arrow heads) with reduced numbers at the tumor bone interface. C, tibial cortex; M, medullary canal; (* P<0.05 vs. PC-3, PC-3+EV, PC-3+Retronog; †P>0.05 vs. PC-3+RANK: Fc)
Discussion
In this study we sought to determine the influence of combined inhibition of the BMP pathway and the RANK-RANKL axis on the progression of osteolytic prostate cancer lesions in a murine intratibial injection model. The results from this study demonstrate that combined targeting of both the osteoclasts and the BMP activity delayed bone loss and decreased tumor burden compared to the individual treatment alone.
Radiographs, micro CT scans and histology confirmed that PC-3 cells form a pure osteolytic lesion when injected into the SCID mouse tibia. Micro PET and CT imaging demonstrated progressive increase in lesion size and bone loss in PC-3 implanted tibias. The animals treated with combination of RANK: Fc and retronoggin demonstrated significantly smaller tumor sizes (hind limb measurement and FDG micro PET) compared to the untreated controls and tibias treated with retronoggin alone. Furthermore, the radiographs and the microCT imaging demonstrated delayed appearance of osteolytic lesions and decreased bone loss in the combined treatment group tibias when compared to the other study group animals. PC-3 cells were chosen for this study because they represent a very aggressive prostate cancer cell line that produces purely osteolytic lesions in immune compromised mice [16]. Although other prostate cancer cell lines such as LNCaP and C4 2b may represent a typical metastatic prostate cancer lesion, they form slow growing tumors.
RANK- RANKL axis is a key regulator of osteoclast differentiation and activity [36, 37]. RANK: Fc is a recombinant RANKL antagonist which inhibits osteoclast formation and has demonstrated success in inhibiting osteolysis in animal models of bone metastasis [19-21]. Zhang et al reported diminished tumor progression and lower osteoclast numbers with RANK: Fc treatment in SCID mice that were implanted with fetal human bones injected with prostate cancer cells [21]. Ignatoski et al and Feeley et al reported similar findings in mixed lytic/blastic prostate cancer and lung cancer lesions respectively treated with RANK: Fc [19, 38]. In the current study, animals treated with RANK: Fc demonstrated less bone destruction, lower osteoclast numbers and smaller tumor sizes compared to the untreated control animal which is consistent with the results of aforementioned studies. RANK: Fc inhibits intraosseous tumor growth indirectly by blocking the release of stored growth factors from the bone thereby reducing the proliferative signals that stimulate intraosseous tumor growth [19-21, 38].
BMPs are members of TGF-β superfamily and aberrant expression of BMPs has been reported in multiple oncogenic cell lines including human prostate cancer cell lines [24-27, 32]. Noggin is a cysteine knot protein that inhibits BMP signaling by blocking the binding epitope for both BMP-1 and BMP-2 receptors [39]. In this study, noggin over expression alone in PC-3 cells limited tumor growth compared to the untreated control animals. Our hypothesis is that noggin over expression inhibits BMP activity, which limited tumor cell proliferation. We have previously demonstrated that noggin effectively limits BMP-mediated cell proliferation, migration and invasion in PC-3 cells in vitro and the tumor growth in vivo [32]. In a human osteoblastic prostate cancer cell line, BMP inhibition with noggin inhibited the development of osteoblastic lesions [31]. Feeley et al reported that noggin over expression in a human lung cancer cell line inhibited BMP mediated tumor growth both in subcutaneous xenografts and intratibial tumors [19]. Furthermore, the combination therapy had a similar effect on this lung cancer cell line. These results suggest that therapies may need to be developed in response to specific cytokines released by a metastatic tumor rather than treating all tumors that metastasize to a particular organ in the same fashion.
We have previously demonstrated that 18F-FDG and 18F-fluoride micro PET-CT scans can be useful tools in characterizing pure osteolytic and osteoblastic lesions induced by human prostate cancer cell lines in murine intra tibial injection model [33, 40]. In the current study, early detection and serial estimation of tumor growth in the treatment groups was feasible with FDG micro PET scans. However, 18F-fluoride micro PET scans were not useful in comparing bone turnover among treatment groups in osteolytic lesions in this animal model. Micro CT scans quantified bone loss and detected osteolytic lesions earlier compared to the plain radiographs. Despite these potential advantages, lack of ready availability, cost issues and the time necessary to perform these studies are the major deterrents to the wide applicability of micro PET scans as an imaging tool in small animal research [41, 42]. At this time, these tools require improved standardization of tracer uptake to accurately and reproducibly identify subtle differences in response to various treatment regimens in animal models.
There has been growing interest in simultaneous targeting of both the tumor cells and the bone microenvironment in the management of bone metastasis [43-46]. Therapeutic strategies combining the tumor targeting and the bone targeting agents have shown encouraging results in the preclinical studies [38, 47, 48]. The management of osteolytic lesions may benefit from a combination of anti-osteoclastic agent and cytotoxic/static therapy in addition to other agents targeting the bone microenvironment. Although there is no cure for the metastatic bone disease, limitation of bone destruction and inhibition of tumor growth in an established metastasis will reduce pain, lower the incidence of skeletal complications and improve the quality of life. In conclusion, the results of this study suggest that simultaneous inhibition of the BMP pathway and RANK-RANKL axis would be more effective in delaying the progression of osteolytic prostate cancer lesion in bone compared to either treatment alone.
Acknowledgments
This work was supported by a research grant from the National Institute of Health (RO1 CA103039 to JRL). RANK: Fc was generously provided by Amgen Inc.
Footnotes
Publisher's Disclaimer: This is a PDF file of an unedited manuscript that has been accepted for publication. As a service to our customers we are providing this early version of the manuscript. The manuscript will undergo copyediting, typesetting, and review of the resulting proof before it is published in its final citable form. Please note that during the production process errors may be discovered which could affect the content, and all legal disclaimers that apply to the journal pertain.
References
- 1.Virk MS, Lieberman JR. Tumor metastasis to bone. Arthritis Res Ther. 2007;9(Suppl 1):S5. doi: 10.1186/ar2169. [DOI] [PMC free article] [PubMed] [Google Scholar]
- 2.Coleman RE. Management of bone metastases. Oncologist. 2000;5:463–70. doi: 10.1634/theoncologist.5-6-463. [DOI] [PubMed] [Google Scholar]
- 3.Saad F, Clarke N, Colombel M. Natural history and treatment of bone complications in prostate cancer. Eur Urol. 2006;49:429–40. doi: 10.1016/j.eururo.2005.12.045. [DOI] [PubMed] [Google Scholar]
- 4.Carlin BI, Andriole GL. The natural history, skeletal complications, and management of bone metastases in patients with prostate carcinoma. Cancer. 2000;88:2989–94. doi: 10.1002/1097-0142(20000615)88:12+<2989::aid-cncr14>3.3.co;2-h. [DOI] [PubMed] [Google Scholar]
- 5.Yin JJ, Pollock CB, Kelly K. Mechanisms of cancer metastasis to the bone. Cell Res. 2005;15:57–62. doi: 10.1038/sj.cr.7290266. [DOI] [PubMed] [Google Scholar]
- 6.Roodman GD. Mechanisms of bone metastasis. N Engl J Med. 2004;350:1655–64. doi: 10.1056/NEJMra030831. [DOI] [PubMed] [Google Scholar]
- 7.Yoneda T, Hiraga T. Crosstalk between cancer cells and bone microenvironment in bone metastasis. Biochem Biophys Res Commun. 2005;328:679–87. doi: 10.1016/j.bbrc.2004.11.070. [DOI] [PubMed] [Google Scholar]
- 8.Keller ET, Zhang J, Cooper CR, Smith PC, McCauley LK, Pienta KJ, Taichman RS. Prostate carcinoma skeletal metastases: cross-talk between tumor and bone. Cancer Metastasis Rev. 2001;20:333–49. doi: 10.1023/a:1015599831232. [DOI] [PubMed] [Google Scholar]
- 9.Boyce BF, Yoneda T, Guise TA. Factors regulating the growth of metastatic cancer in bone. Endocr Relat Cancer. 1999;6:333–47. doi: 10.1677/erc.0.0060333. [DOI] [PubMed] [Google Scholar]
- 10.Cooper CR, Chay CH, Gendernalik JD, Lee HL, Bhatia J, Taichman RS, McCauley LK, Keller ET, Pienta KJ. Stromal factors involved in prostate carcinoma metastasis to bone. Cancer. 2003;97:739–47. doi: 10.1002/cncr.11181. [DOI] [PubMed] [Google Scholar]
- 11.Guise TA, Mohammad KS, Clines G, Stebbins EG, Wong DH, Higgins LS, Vessella R, Corey E, Padalecki S, Suva L, Chirgwin JM. Basic mechanisms responsible for osteolytic and osteoblastic bone metastases. Clin Cancer Res. 2006;12:6213s–6216s. doi: 10.1158/1078-0432.CCR-06-1007. [DOI] [PubMed] [Google Scholar]
- 12.Boyle WJ, Simonet WS, Lacey DL. Osteoclast differentiation and activation. Nature. 2003;423:337–42. doi: 10.1038/nature01658. [DOI] [PubMed] [Google Scholar]
- 13.Lacey DL, Timms E, Tan HL, Kelley MJ, Dunstan CR, Burgess T, Elliott R, Colombero A, Elliott G, Scully S, Hsu H, Sullivan J, Hawkins N, Davy E, Capparelli C, Eli A, Qian YX, Kaufman S, Sarosi I, Shalhoub V, Senaldi G, Guo J, Delaney J, Boyle WJ. Osteoprotegerin ligand is a cytokine that regulates osteoclast differentiation and activation. Cell. 1998;93:165–76. doi: 10.1016/s0092-8674(00)81569-x. [DOI] [PubMed] [Google Scholar]
- 14.Roodman GD. Regulation of osteoclast differentiation. Ann N Y Acad Sci. 2006;1068:100–9. doi: 10.1196/annals.1346.013. [DOI] [PubMed] [Google Scholar]
- 15.Boyce BF, Yamashita T, Yao Z, Zhang Q, Li F, Xing L. Roles for NF-kappaB and c-Fos in osteoclasts. J Bone Miner Metab. 2005;23(Suppl):11–5. doi: 10.1007/BF03026317. [DOI] [PubMed] [Google Scholar]
- 16.Lee Y, Schwarz E, Davies M, Jo M, Gates J, Wu J, Zhang X, Lieberman JR. Differences in the cytokine profiles associated with prostate cancer cell induced osteoblastic and osteolytic lesions in bone. J Orthop Res. 2003;21:62–72. doi: 10.1016/S0736-0266(02)00095-5. [DOI] [PubMed] [Google Scholar]
- 17.Michigami T, Ihara-Watanabe M, Yamazaki M, Ozono K. Receptor activator of nuclear factor kappaB ligand (RANKL) is a key molecule of osteoclast formation for bone metastasis in a newly developed model of human neuroblastoma. Cancer Res. 2001;61:1637–44. [PubMed] [Google Scholar]
- 18.Ohshiba T, Miyaura C, Inada M, Ito A. Role of RANKL-induced osteoclast formation and MMP-dependent matrix degradation in bone destruction by breast cancer metastasis. Br J Cancer. 2003;88:1318–26. doi: 10.1038/sj.bjc.6600858. [DOI] [PMC free article] [PubMed] [Google Scholar]
- 19.Feeley BT, Liu NQ, Conduah AH, Krenek L, Roth K, Dougall WC, Huard J, Dubinett S, Lieberman JR. Mixed metastatic lung cancer lesions in bone are inhibited by noggin overexpression and Rank:Fc administration. J Bone Miner Res. 2006;21:1571–80. doi: 10.1359/jbmr.060706. [DOI] [PubMed] [Google Scholar]
- 20.Whang PG, Schwarz EM, Gamradt SC, Dougall WC, Lieberman JR. The effects of RANK blockade and osteoclast depletion in a model of pure osteoblastic prostate cancer metastasis in bone. J Orthop Res. 2005;23:1475–83. doi: 10.1016/j.orthres.2005.05.004.1100230634. [DOI] [PubMed] [Google Scholar]
- 21.Zhang J, Dai J, Yao Z, Lu Y, Dougall W, Keller ET. Soluble receptor activator of nuclear factor kappaB Fc diminishes prostate cancer progression in bone. Cancer Res. 2003;63:7883–90. [PubMed] [Google Scholar]
- 22.Lieberman JR, Daluiski A, Einhorn TA. The role of growth factors in the repair of bone Biology and clinical applications. J Bone Joint Surg Am. 2002;84-A:1032–44. doi: 10.2106/00004623-200206000-00022. [DOI] [PubMed] [Google Scholar]
- 23.Chen D, Zhao M, Mundy GR. Bone morphogenetic proteins. Growth Factors. 2004;22:233–41. doi: 10.1080/08977190412331279890. [DOI] [PubMed] [Google Scholar]
- 24.Bobinac D, Maric I, Zoricic S, Spanjol J, Dordevic G, Mustac E, Fuckar Z. Expression of bone morphogenetic proteins in human metastatic prostate and breast cancer. Croat Med J. 2005;46:389–96. [PubMed] [Google Scholar]
- 25.Deng H, Makizumi R, Ravikumar TS, Dong H, Yang W, Yang WL. Bone morphogenetic protein-4 is overexpressed in colonic adenocarcinomas and promotes migration and invasion of HCT116 cells. Exp Cell Res. 2007;313:1033–44. doi: 10.1016/j.yexcr.2006.12.020. [DOI] [PubMed] [Google Scholar]
- 26.Brubaker KD, Corey E, Brown LG, Vessella RL. Bone morphogenetic protein signaling in prostate cancer cell lines. J Cell Biochem. 2004;91:151–60. doi: 10.1002/jcb.10679. [DOI] [PubMed] [Google Scholar]
- 27.Langenfeld EM, Calvano SE, Abou-Nukta F, Lowry SF, Amenta P, Langenfeld J. The mature bone morphogenetic protein-2 is aberrantly expressed in non-small cell lung carcinomas and stimulates tumor growth of A549 cells. Carcinogenesis. 2003;24:1445–54. doi: 10.1093/carcin/bgg100. [DOI] [PubMed] [Google Scholar]
- 28.Schwalbe M, Sanger J, Eggers R, Naumann A, Schmidt A, Hoffken K, Clement JH. Differential expression and regulation of bone morphogenetic protein 7 in breast cancer. Int J Oncol. 2003;23:89–95. [PubMed] [Google Scholar]
- 29.Yang S, Zhong C, Frenkel B, Reddi AH, Roy-Burman P. Diverse biological effect and Smad signaling of bone morphogenetic protein 7 in prostate tumor cells. Cancer Res. 2005;65:5769–77. doi: 10.1158/0008-5472.CAN-05-0289. [DOI] [PubMed] [Google Scholar]
- 30.Ye L, Lewis-Russell JM, Kyanaston HG, Jiang WG. Bone morphogenetic proteins and their receptor signaling in prostate cancer. Histol Histopathol. 2007;22:1129–47. doi: 10.14670/HH-22.1129. [DOI] [PubMed] [Google Scholar]
- 31.Feeley BT, Gamradt SC, Hsu WK, Liu N, Krenek L, Robbins P, Huard J, Lieberman JR. Influence of BMPs on the formation of osteoblastic lesions in metastatic prostate cancer. J Bone Miner Res. 2005;20:2189–99. doi: 10.1359/JBMR.050802. [DOI] [PubMed] [Google Scholar]
- 32.Feeley BT, Krenek L, Liu N, Hsu WK, Gamradt SC, Schwarz EM, Huard J, Lieberman JR. Overexpression of noggin inhibits BMP-mediated growth of osteolytic prostate cancer lesions. Bone. 2006;38:154–66. doi: 10.1016/j.bone.2005.07.015. [DOI] [PubMed] [Google Scholar]
- 33.Hsu WK, Virk MS, Feeley BT, Stout DB, Chatziioannou AF, Lieberman JR. Characterization of Osteolytic, Osteoblastic, and Mixed Lesions in a Prostate Cancer Mouse Model with Using 18F-FDG and 18F-Fluoride PET/CT. J Nucl Med. 2008 doi: 10.2967/jnumed.107.045666. [DOI] [PMC free article] [PubMed] [Google Scholar]
- 34.Narita N, Kato K, Nakagaki H, Ohno N, Kameyama Y, Weatherell JA. Distribution of fluoride concentration in the rat’s bone. Calcif Tissue Int. 1990;46:200–4. doi: 10.1007/BF02555045. [DOI] [PubMed] [Google Scholar]
- 35.Hawkins RA, Choi Y, Huang SC, Hoh CK, Dahlbom M, Schiepers C, Satyamurthy N, Barrio JR, Phelps ME. Evaluation of the skeletal kinetics of fluorine-18-fluoride ion with PET. J Nucl Med. 1992;33:633–42. [PubMed] [Google Scholar]
- 36.Brown JM, Zhang J, Keller ET. Opg, RANKl, and RANK in cancer metastasis: expression and regulation. Cancer Treat Res. 2004;118:149–72. doi: 10.1007/978-1-4419-9129-4_7. [DOI] [PubMed] [Google Scholar]
- 37.Wittrant Y, Theoleyre S, Chipoy C, Padrines M, Blanchard F, Heymann D, Redini F. RANKL/RANK/OPG: new therapeutic targets in bone tumours and associated osteolysis. Biochim Biophys Acta. 2004;1704:49–57. doi: 10.1016/j.bbcan.2004.05.002. [DOI] [PubMed] [Google Scholar]
- 38.Ignatoski KM, Escara-Wilke JF, Dai JL, Lui A, Dougall W, Daignault S, Yao Z, Zhang J, Day ML, Sargent EE, Keller ET. RANKL inhibition is an effective adjuvant for docetaxel in a prostate cancer bone metastases model. Prostate. 2008;68:820–829. doi: 10.1002/pros.20744. [DOI] [PMC free article] [PubMed] [Google Scholar]
- 39.Groppe J, Greenwald J, Wiater E, Rodriguez-Leon J, Economides AN, Kwiatkowski W, Affolter M, Vale WW, Belmonte JC, Choe S. Structural basis of BMP signalling inhibition by the cystine knot protein Noggin. Nature. 2002;420:636–42. doi: 10.1038/nature01245. [DOI] [PubMed] [Google Scholar]
- 40.Berger F, Lee YP, Loening AM, Chatziioannou A, Freedland SJ, Leahy R, Lieberman JR, Belldegrun AS, Sawyers CL, Gambhir SS. Whole-body skeletal imaging in mice utilizing microPET: optimization of reproducibility and applications in animal models of bone disease. Eur J Nucl Med Mol Imaging. 2002;29:1225–36. doi: 10.1007/s00259-002-0850-1. [DOI] [PubMed] [Google Scholar]
- 41.Myers R, Hume S. Small animal PET. Eur Neuropsychopharmacol. 2002;12:545–55. doi: 10.1016/s0924-977x(02)00103-7. [DOI] [PubMed] [Google Scholar]
- 42.Herschman HR. Micro-PET imaging and small animal models of disease. Curr Opin Immunol. 2003;15:378–84. doi: 10.1016/s0952-7915(03)00066-9. [DOI] [PubMed] [Google Scholar]
- 43.Vessella RL, Corey E. Targeting factors involved in bone remodeling as treatment strategies in prostate cancer bone metastasis. Clin Cancer Res. 2006;12:6285s–6290s. doi: 10.1158/1078-0432.CCR-06-0813. [DOI] [PubMed] [Google Scholar]
- 44.Lipton A. Future treatment of bone metastases. Clin Cancer Res. 2006;12:6305s–6308s. doi: 10.1158/1078-0432.CCR-06-1157. [DOI] [PubMed] [Google Scholar]
- 45.Storey JA, Torti FM. Bone metastases in prostate cancer: a targeted approach. Curr Opin Oncol. 2007;19:254–8. doi: 10.1097/CCO.0b013e32805e8787. [DOI] [PubMed] [Google Scholar]
- 46.Bagi CM. Targeting of therapeutic agents to bone to treat metastatic cancer. Adv Drug Deliv Rev. 2005;57:995–1010. doi: 10.1016/j.addr.2004.12.014. [DOI] [PubMed] [Google Scholar]
- 47.Duivenvoorden WC, Vukmirovic-Popovic S, Kalina M, Seidlitz E, Singh G. Effect of zoledronic acid on the doxycycline-induced decrease in tumour burden in a bone metastasis model of human breast cancer. Br J Cancer. 2007;96:1526–31. doi: 10.1038/sj.bjc.6603740. [DOI] [PMC free article] [PubMed] [Google Scholar]
- 48.Banerjee S, Hussain M, Wang Z, Saliganan A, Che M, Bonfil D, Cher M, Sarkar FH. In vitro and in vivo molecular evidence for better therapeutic efficacy of ABT-627 and taxotere combination in prostate cancer. Cancer Res. 2007;67:3818–26. doi: 10.1158/0008-5472.CAN-06-3879. [DOI] [PubMed] [Google Scholar]