

Abstract
In most neurons, Na+ channels in the axon are complemented by others localized in the soma and dendrites to ensure spike back-propagation. However, cerebellar granule cells are neurons with simplified architecture in which the dendrites are short and unbranched and a single thin ascending axon travels toward the molecular layer before bifurcating into parallel fibers. Here we show that in cerebellar granule cells, Na+ channels are enriched in the axon, especially in the hillock, but almost absent from soma and dendrites. The impact of this channel distribution on neuronal electroresponsiveness was investigated by multi-compartmental modeling. Numerical simulations indicated that granule cells have a compact electrotonic structure allowing excitatory postsynaptic potentials to diffuse with little attenuation from dendrites to axon. The spike arose almost simultaneously along the whole axonal ascending branch and invaded the hillock the activation of which promoted spike back-propagation with marginal delay (<200 μs) and attenuation (<20 mV) into the somato-dendritic compartment. These properties allow granule cells to perform sub-millisecond coincidence detection of pre- and postsynaptic activity and to rapidly activate Purkinje cells contacted by the axonal ascending branch.
INTRODUCTION
The Na+ channels are usually enriched in the axon, generating spikes that propagate at finite speed both in the forward direction and backward into the soma and dendrites (Antic 2003; Stuart and Sakmann 1994; Stuart et al. 1997a,b; Zhou et al. 2007; but see Shen et al. 1999). In large neurons, like pyramidal cells and substantia nigra cells, efficient spike back-propagation requires that Na+ channels are also expressed in the dendrites (Häusser et al. 1995; Spruston et al. 1995). Indeed the absence of dendritic Na+ channels makes back-propagation inefficient, e.g., in Purkinje cells (Clark et al. 2005; Stuart and Häusser 1994). The efficiency and speed at which spikes propagate either in the forward and backward direction is thought to have profound impact on circuit computations, regulating transmission delays, and coincidence detection of pre- and postsynaptic activity (Golding et al. 2002; Lüscher and Larkum 1998; Mainen et al. 1995; Shepherd and Brayton 1987; Wathey et al. 1992).
A specific case is presented by cerebellar granule cells. These neurons, which are small and electrotonically compact (D'Angelo et al. 1993; Silver et al. 1992), emit a thin axon that ascends toward the molecular layer before bifurcating into the parallel fibers. Eccles et al. (1967) provided a detailed description of the local field potentials evoked by mossy fiber activation, demonstrating that granule cells act as sources of the net positive charge carried by Na+ currents flowing into the axon during action potential generation. A similar result was also recently reported in vitro (Mapelli and D'Angelo 2007). Voltage-clamp recordings (Magistretti et al. 2006) and immuno-labeling (Goldfarb et al. 2007) indicate indeed that Na+ channels are enriched in the axon hillock but almost absent from the somato-dendritic compartment. This asymmetry might impact on coincidence detection in the dendrites where voltage-dependent N-methyl-d-aspartate (NMDA) channel gating controls the induction of long-term synaptic plasticity (D'Angelo et al. 1999; Hansel et al. 2001). Moreover, the balance of hillock and axon channels is expected to determine the efficiency of synaptic communication with the Purkinje cells along the ascending axon, an issue that deserves attention as it is at the core of theories on cerebellar computation (Bower and Woolston 1983; Breitenberg 1967; Cohen and Yarom 1998).
In this paper, we have further investigated axonal Na+ channel localization and analyzed its consequence on spike propagation and synaptic integration with a detailed multi-compartmental model of the granule cell (see D'Angelo et al. 2001; Nieus et al. 2006). In the model, excitatory postsynaptic potentials (EPSPs) were efficiently transmitted into the axon activating spikes that almost instantaneously extended over the whole ascending branch. The spikes rapidly back-propagated into the somato-dendritic compartment exploiting the large hillock current without requiring any somato-dendritic Na+ channels. This mechanism provides the substrate for efficient coincidence detection and fast signal retransmission at the input stage of the cerebellar network.
METHODS
Modeling
To investigate the impact of ion channel localization on excitability, single-compartment models are insufficient. The Rall's method (Rall 1977) of splitting the neuron into separate regions or compartments and approximating the continuous membrane potential by a discrete sets of values representing the potential within the different compartments was used to develop a multicompartmental model of the cerebellar granule cell. The multicompartmental granule cell model was developed in the NEURON simulation environment (Hines and Carnevale 1997; Yamada et al. 1998) and the code will be made available at ModelDB (http://www.senselab.med.yale.edu/ModelDb/).
Multicompartmental granule cell model
We constructed a detailed multicompartmental model of a typical (or “canonical”) rodent cerebellar granule cell by implementing the morphological structure, channel localization and dynamics indicated by experimental results (Fig. 1 A, Table 1). The model structure derived from Golgi staining and EM reconstructions (Eccles et al. 1967; Hàmori and Somogyi 1983; Jakab and Hàmori 1988; Palay and Chan-Palay 1974) (see Fig. 1). The soma had a 5.8-μm diameter and was attached to four identical unbranched dendrites and to the axon. The dendrites had a length of 15 μm and diameter of 0.75 μm and were subdivided into four compartments, the two proximal ones of 5 μm length and the two distal ones of 2.5 μm length. The axon initial segment, or hillock, tapered from 2.3 to 0.3 μm in diameter and consisted of five compartments of 0.4 μm length and continued with 30 identical axonal compartments of 20 μm length and 0.3 μm diameter. In most simulations, the axonal bifurcation in the molecular layer was not included and the axon terminated with a semi-infinite end to prevent action potential reflection (Koch 1997). However, simulations were also performed including parallel fibers extending from 500 μm on both sides of the branching point.
FIG. 1.
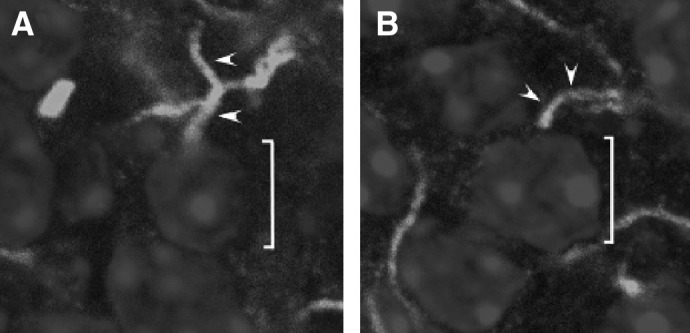
Concentration of sodium channels and fibroblast growth factor homologous factor (FHF) at the axon initial segment of P20 granule cells. Saggital cryosections of P20 cerebellum were incubated with mouse monoclonal antibody to voltage-gated sodium channel alpha subunits (A) or to FHF-4 monoclonal antibody (B), followed by treatment with goat anti-mouse IgG-ALEXA488 and with TO-PRO3 as a nuclear stain. Confocal images were captured at ×4,000 magnification. An individual granule cell nucleus (]) and its axon initial segment (▴) are indicated for each image.
TABLE 1.
Voltage dependent conductance parameters
| Ionic Channel | Conductance, nS | Localization | Reference |
|---|---|---|---|
| Na | 8.589 | Axon | Magistretti et al. (2006) and Goldfarb et al. (2007) |
| 2.338 | Hillock | ||
| K-DR | 2.336 | Axon, Hillock | D'Angelo et al. (2001) with upgrades in Nieus et al. (2006) (indicated by *). |
| K-A* | 3.382 | Soma | |
| K-IR* | 0.951 | Soma | |
| K-Ca | 0.707 | Dend (4) | |
| Ca | 0.108 | Dend (4) | |
| K-slow | 0.264 | Soma | |
| Lkg1 | 0.170 | All compartments | |
| Lkg2 (GABA)* | 0.042 | Dend (1,2,3,4) |
Channel conductance (nS) and localization in the multicompartment model. The compartment number is indicated in parentheses (cf. Fig, 1A). It should be noted that, except for Na+, all other conductance values remain identical to those of the mono-compartment models. Channel-gating properties are reported in the corresponding references.
The mathematical problem in neuronal simulation is to solve a set of differential equations representing membrane voltage, V, and channel gating dynamics (see for example Yamada et al. 1998). When multiple compartments are present, V has to be calculated independently for all the compartments. For each compartment, V was obtained as the time integral of the equation
 |
(1) |
where: τm = RmCm is the membrane time constant (Rm = 1/gtot is the membrane resistance and Cm is the membrane capacitance of the compartment); gi, gsyn, and gbr are the conductances through voltage-dependent channels, synaptic channels, and neighboring branches; Vi and Vsyn are the reversal potentials for voltage-dependent and synaptic channels, while Vbr is the membrane potential of neighboring branches. Analogous considerations apply to calculation of intracellular calcium concentration [Ca] dynamics
 |
(2) |
where d is the depth of a shell adjacent to the cell surface of area A, βCa determines the loss of calcium ions from the shell approximating the effect of fluxes, ionic pumps, diffusion, and buffers, [Ca]0 is resting [Ca] and F is the Faraday's constant. [Ca] was calculated only in the compartment endowed with calcium channels as explained in the following text. The mathematical representations of gi and gsyn (Eq. 1), which can be voltage- and calcium-dependent, are fully reported in previous papers (D'Angelo et al. 2001; Nieus et al. 2006).
Implementation of model mechanisms
The cerebellar granule cell represents one of the rare cases in which most of current densities and kinetics needed for realistic modeling can be determined accurately from whole cell current recordings obtained from acute slice preparations. Ionic current implementation, which was carefully done in previous papers (D'Angelo et al. 2001; Nieus et al. 2006), is also valid for the multicompartmental model and is not repeated here. Even though not unexpected, by keeping somato-dendritic current densities unchanged, the multicompartmental model reproduced the typical granule cell electrical responses provided that a careful calibration of the axonal channels (Nat-Nap-Nar and KDR, see following text) was performed. Channel localization was based on information deriving from immunohistochemical, patch-clamp and imaging techniques (Figs. 1–4 and Table 1).
FIG. 4.

Cell-attached single-channel recordings in granule cell somata in situ. The figure shows consecutive current tracings recorded in 2 cell-attached patches in response to the voltage protocol illustrated at the top of each panel. Left traces: representative of 9 patches; right traces: representative of 3 patches. Note the absence of detectable Na+-channel activity in the patch at the left and the presence of transient Na+-channel activity in the patch at the right. The lowermost tracing in each panel is the ensemble-average current obtained from 40 sweeps.
NAT-NAP-NAR CURRENTS, KDR CURRENT AND SPIKE MECHANISMS.
The sodium currents were taken from the reconstruction reported in Magistretti et al. (2006) and accounted for the three components reported in granule cells, namely Nat, Nap, and Nar (transient, persistent, and resurgent). Na+ channels were localized in the hillock and axon as indicated by immuno-histochemical labeling (Goldfarb et al. 2007) and electrophysiological data (Figs. 2–4). The amount of Na+ channels shared between hillock and axon was varied systematically. Accordingly, the H/ANa ratio indicates the percentage of Na+ channels shared between hillock (H) and axon (A) and was typically set at 50% (see results). The KDR channels were placed together with Na+ channels due to their role in action potential repolarization. Similar to H/ANa, the H/AK ratio was also systematically investigated.
FIG. 2.
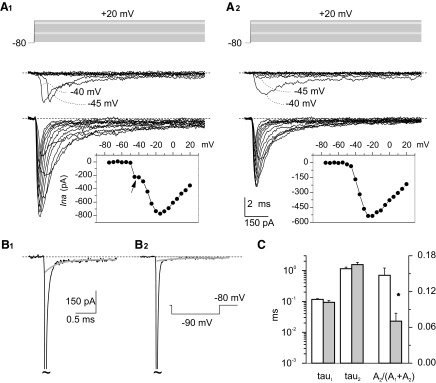
Transient Na+ currents in granule cells in situ. A: properties of I-Nat recorded in 2 typical granule cells (the voltage-clamp protocol is shown at the top). The experimental tracings recorded at –75 to –40 mV and at –35 to +20 mV have been split in 2 different subpanels. A1 provides an example of the currents recorded in group-1 neurons, in which an unclamped and a well-clamped I-Nat component coexist. A2 provides an example of the currents recorded in group-2 neurons, in which the well-clamped I-Nat component was observed in isolation. Insets: the current-voltage (I-V) relationships for I-Nat peak amplitude in the same 2 cells. Note the notch in the I-V relationship of the group-1 cell (arrow). B: capacitive currents (the transient has been truncated: tildes) recorded in the cells illustrated in A1 and A2 (B1 and B2, respectively) in response to a –10-mV voltage pulse from −80 to −90 mV. The decay phase of capacitive transients was fitted with a double-exponential function. Fitting parameters for B1: A1 = −188.6 pA, τ1 = 97.3 μs, A2 = −13.7 pA, τ2 = 0.708 ms, C = −3.2 pA. Fitting parameters for B2: A1 = −195.59 pA, τ1 = 65.8 μs, A2 = −3.4 pA, τ2 = 1.17 ms, C = −1.2 pA. The gray lines correspond to the sum of the slow exponential component plus offset of each fitting. C: average values of fast time constant (τ1), slow time constant (τ2), and relative amplitude coefficient [A2/(A1 + A2)] obtained from exponential fittings of capacitive transients in group-1 cells (white columns; n = 58) and group-2 cells (gray columns; n = 15). Double asterisk: P < 0.003, unpaired t-test).
CA CURRENT, KCA CURRENT, AND CALCIUM DYNAMICS.
Imaging experiments showed that intracellular Ca2+ transients depending on voltage-dependent calcium channel activation occur in granule cell dendrites, more intensely in their endings (Gall et al. 2005). Ca and KCa currents were therefore placed in the dendritic endings together with intracellular Ca2+ dynamics. Parameters used in Eq. 2 were d = 200 nm, βCa = 0.6, and [Ca]0 = 100 nM.
KA, KIR, AND KSLOW CURRENTS.
KA channels were placed in the soma because the most abundant α-subunit supposed to generate the A-current (Kv 4.2) was found to be expressed in the soma (Shibata et al. 2000). Because no specific information about the localization of Kslow and KIR channels is available, they have been placed in the soma too. It should be noted that KA, KIR, and Kslow localization in the different compartments of the somato-dendritic compartment did not prove critical either for synaptic integration or for intrinsic excitability (data not shown).
LEAKAGE CURRENTS.
The model included a leakage current (Lkg1) and a tonic inhibition component (Lkg2) based on persistent activation of GABAA receptors.
SYNAPTIC CURRENTS.
The synapses were connected to the last compartments of the dendrites (Hàmori and Somogyi 1983; Jakab and Hàmori 1988). Excitatory synaptic mechanisms were taken from Nieus et al. (2006) and the inhibitory synaptic mechanisms were adapted from Mapelli and D'Angelo (2007).
Multicompartment versus monocompartment model: electrotonic properties
While the multicompartment did not significantly differ from monocompartment granule cell models in terms of firing input-output functions (Fig. 4, B and C), the electrotonic properties were different because membrane capacitance and resistance were distributed among the compartments. To assess whether charge equalization was compatible with that observed in real cells, a short (200 μs) depolarizing current pulse was injected in the soma from −70 mV, and the consequent membrane potential relaxation was analyzed (Fig. 2A). In this experiment, electric charges are instantaneously dislocated at the injection point, then the charge is redistributed over the model surface. The double-exponential decay had time constants corresponding to somatic membrane charging (τm)and equalization (τ1) over the dendrites and axon (cf. D'Angelo et al. 1993; Koch 1999). Functions embedded in the NEURON simulator were used to estimate impedance, attenuation and the electrotonic length, L (for documentation, see Carnevale et al. 1997 and http://www.neuron.yale.edu/neuron/).
Experimental methods
The localization of Na+ channels was assessed using immunocytochemistry and through patch-clamp recordings carried out both in cerebellar slices and acutely dissociated granule cells.
Immunocytochemistry
Immunofluorescence: vibratome sections (400 μm) of mouse P20 cerebellum were prepared in modified Kreb's extracellular solution (120 mM NaCl replaced by 240 mM sucrose), fixed on ice for 1 h in phosphate-buffered saline containing 240 mM sucrose and 4% paraformaldehyde, soaked at 4°C overnight in phosphate buffered saline +25% (wt/vol) sucrose, and cryosectioned (20-μm thickness) onto gelatinized slides. For immunofluorescence, slides were postfixed in 4% paraformaldehyde for 5 min at room temperature, permeabilized in 0.1 M sodium phosphate pH 7.2–0.5% Triton X-100 for 10 min, and blocked in 0.1 M sodium phospate pH 7.2–0.2% Triton X-100-20% horse serum for 1 h. Antibody incubations were in blocking solution (except with 5% horse serum). Slides were incubated overnight at 4°C with 2 μg/ml monoclonal antibody against either sodium channels or fibroblast growth factor homologous factor 4 (FHF4), then 1 h at room temperature with 5 μg/ml anti-mouse IgG-ALEXA488 + 1 microM TO-PRO3 before mounting with VectaShield and coverslip. Confocal images were acquired on a Leica NST instrument. Reagents for immunoflourescence included mouse monoclonal anti-pan-sodium channel alpha (Sigma Aldrich) and anti-FHF4(FGF14) (NeuroMAb), polyclonal anti-mouse IgG-ALEXA488 (Invitrogen), and nuclear stain TO-PRO3 iodide (Invitrogen).
Slice and cell preparation for electrophysiology
For recordings from intact granule cells in slices, 250-μm-thick sagittal sections of the cerebellar vermis were obtained from young Wistar rats (16–23 days old). The procedures followed for slice preparation were exactly as described previously (Magistretti et al. 2006).
For the preparation of acutely dissociated cells, the cerebellum was also extracted following the same procedure, except that in this case the dissection buffer was composed of (in mM) 115 NaCl, 3 KCl, 3 MgCl2, 0.2 CaCl2, 20 piperazine-N,N′-bis(2-ethanesulphonic acid)·1.5 Na (PIPES-Na), and 25 d-glucose (pH 7.4 with NaOH, bubbled with pure O2). The entire cerebellum was sectioned into 300-μm-thick saggital slices using a McIlwaine tissue chopper (Mickle Laboratory Engineering, Gomshall, UK). The slices owing to the cerebellar vermis were then selected, and the deep white matter was removed from each slice under microscopic control. During the latter procedure, the slices were submerged in ice-cold dissection buffer. The slices were then transferred into an incubation chamber filled with the same buffer (continuously bubbled with pure O2), and kept there at room temperature for ≥1 h before further dissociation. When needed, one slice at a time was removed from the chamber, re-suspended in 2 ml of a calcium-free buffer containing (in mM) 113.5 NaCl, 3 KCl, 3 MgCl2, 20 PIPES-Na, 3 ethylene glycol-bis (β-aminoethyl ether) N,N,N′,N′-tetraacetic acid (EGTA), 25 d-glucose, and 2 mg/ml bovine serum albumine (Sigma fraction V; pH 7.4 with NaOH), and triturated with a few passages through Pasteur pipettes of progressively decreasing tip diameter. After sedimentation of the undissociated tissue, the supernatant was transferred into the recording chamber, on a concanavaline A (Sigma, type V)-coated, 16-mm-diam round coverslip. The dissociated cells were allowed to settle down for 15 min before starting the recordings.
Whole cell patch-clamp experiments
Whole cell patch-clamp recordings in voltage-clamp conditions were carried out in the same way as described previously (Magistretti et al. 2006). Tight seals and the whole cell configuration were obtained according to the standard technique (Hamill et al. 1981). The extracellular solution used to perfuse slices and isolate Na+ currents in granule cells in situ contained (in mM) 100 NaCl, 26 NaHCO3, 19.5 tetraethylammonium chloride (TEA-Cl), 3 KCl, 2 MgCl2, 2 CaCl2, 2 BaCl2, 0.5 CdCl2, 4 4-aminopyridine (4-AP), 11 d-glucose (pH 7.4 by saturation with 95% O2-5% CO2). The solution used to fill patch pipettes contained (in mM) 104 CsF, 50 TEA-Cl, 2 MgCl2, 10 N-2-hydroxyethyl piperazine-N-2-ethanesulphonic acid (HEPES), 10 EGTA, 2 adenosine 5′-triphosphate (ATP)-Na2, and 0.2 guanosine 5′-triphosphate (GTP)-Na (pH adjusted to 7.2 with CsOH). The patch pipettes had a resistance of 5–8 MΩ when filled with the above solution. In experiments on dissociated granule cells, visual inspection at ×400 magnification revealed a large majority of small round cells identifiable as granule cells and clearly distinguishable from the much bigger Purkinje and/or Golgi cells. The extracellular perfusing solution was composed of (in mM) 100 NaCl, 34 TEA-Cl, 3 KCl, 3 CsCl, 5 BaCl2, 2 MgCl2, 0.2 CdCl2, 5 4-AP, 10 HEPES, 19 d-glucose (pH 7.4 with NaOH, continuously bubbled with pure O2). The intrapipette solution had the same composition as described for recordings on slices, and patch pipettes had the same average resistance.
Single-channel recordings
Single-channel experiments in the cell-attached configuration were carried out in granule cells in situ. Slices were laid onto the bottom of a recording chamber mounted on the stage of an upright microscope (see following text) and initially perfused with a Krebs solution containing (in mM) 127 NaCl, 1.32 KCl, 26 NaHCO3, 1.18 KH2PO4, 1.19 MgSO4, 2 CaCl2, 11 d-glucose (pH 7.4 by saturation with 95% O2-5% CO2). The pipette solution contained (in mM) 130 NaCl, 35 TEA-Cl, 2 CaCl2, 2 MgCl2, 5 4-AP, 10 HEPES (pH 7.4 with HCl). Single-channel patch pipettes had resistances ranging from 6 to 9 MΩ when filled with the preceding solution and were always coated with silicone elastomer (Sylgard; Dow Corning, Midland, MI) from the shoulder to a point as close as possible to the tip so as to minimize stray pipette capacitance. Slices were observed with an Axioskop FS Plus microscope (Zeiss) equipped with a ×60 water-immersion objective lens and differential-contrast optics. A near-infrared charge-coupled device (CCD) camera was also connected to the microscope and used to improve cell visualization during the approaching and patching procedures. Superficial granule cells were selected for recording. The patch pipette was brought in close proximity to the selected neuron while manually applying positive pressure inside the pipette. After obtaining the cell-attached configuration, the extracellular perfusion was switched to a high-potassium solution containing (in mM) 130 K-gluconate, 1.32 KCl, 25 NaHCO3, 1.18 KH2PO4, 0.2 CdCl2, 11 d-glucose, 1 kynurenic acid (KA), 0.1 picrotoxin (PcTx; pH 7.4 by saturation with 95% O2-5% CO2) so as to hold the neuron resting membrane potential at near 0 mV. Recordings were performed at room temperature using an Axopatch 200B amplifier (Axon Instruments). Capacitive transients and linear current leakage were minimized on-line by acting on the respective built-in compensation sections of the amplifier. Voltage protocols were commanded and current signals were acquired using program Clampex of the software package pClamp 8.2 and a Digidata 1322A digitizer (Axon Instruments). To elicit voltage-gated Na+-channel currents, 50-ms depolarizing voltage steps (negative potential inside the pipette) were delivered one every 5 s. Transmembrane holding potential was –80 to –120 mV.
To estimate the surface area of cell-attached patches, pipettes were observed using the ×60 objective and the CCD camera. The pipette inner diameter at the tip (dtip) was carefully measured on a monitor screen with the help of a calibrated scale; this allowed us to measure the surface area of pipette tip opening (Atip). Because of the Ω-shaped deformation generated on the membrane by the suction and sealing maneuver, the surface area of the membrane patch is normally considerably larger than Atip. It has been estimated that the “free” area of the membrane patch can be 8–12 times Atip (Sakmann and Neher 1983). We adopted a conservative criterion and calculated a lower limit for the membrane patch free area as 2·Atip (the area of the hemisphere of radius dtip/2).
Input resistance, membrane capacitance, and series resistance: off-line estimation
Cell input resistance was evaluated off-line by measuring the steady-state current deflection produced by –10-mV depolarizing pulses from the holding potential of –80 mV. Membrane capacitance and series resistance were also estimated off-line by analyzing the properties of the capacitive current transients evoked by the same step protocol (see Figs. 1B and 2C, insets). The low-pass filter was set at 10 kHz to better preserve the high-frequency components of capacitive transients. In both intact and acutely dissociated granule cells, the decay of the transients was best fit by a double-exponential function
 |
(3) |
where t = 0 corresponds to the start of the step voltage command and t0fit to the fitting starting point. The first exponential component was consistently characterized by a much higher amplitude coefficient than the second one. It has been shown (Jackson 1992) that in intact neurons the fastest exponential component of capacitive-current decay reflects soma charging, with a time constant τ1 = Rs·Csm, where Rs is series resistance and Csm is soma capacitance. Slower exponential components represent cable currents flowing in cell processes. To estimate Csm, the capacitive current, IC, was isolated by subtracting the resistive current component, and the area under the IC curve [AUC(IC)] was measured to derive the total charge transferred during membrane-capacitance charging (Qtot). The charge specifically accumulated on the soma membrane (Qsm) was calculated as
 |
(4) |
where W̄1 is the theoretical relative weight of the first exponential component which equals A1·exp(t0fit/τ1)·τ1 / [A1·exp(t0fit/τ1)·τ1 + A2·exp(t0fit/τ2)·τ2]. The reason why we adopted this procedure to derive Qsm, instead of simply considering the integral of the first exponential component, which equals τ1 multiplied by its amplitude factor, is that the value of this amplitude factor cannot be exactly determined. If the value corresponding to the fitting starting point is used (A1), the charge transferred before this starting point will be ignored, and Qsm will be underestimated. If, instead, the A1 value extrapolated to time 0 [A1·exp(t0fit/τ1)] is used, Qsm will be overestimated because, due to the speed limitations of the voltage-command apparatus, the capacitive current is not instantaneous but grows with a finite speed. Eq. 2 provides a reasonable approximation to Qsm.Csm was then calculated as Csm = Qsm/ΔVcomm, where ΔVcomm was –10 mV. Rs was finally calculated as Rs = τ1/Csm. Rs averaged 27.9 ± 1.2 MΩ in intact neurons (n = 84) and 23.3 ± 1.6 MΩ in acutely-dissociated cells (n = 44). Given the approximation fVC = (2πτ1)-1, the cutoff frequency fVC in voltage-clamp was 1.6 kHz. This filtering was also applied to the simulated traces in Fig. 6A.
FIG. 6.
Na+ currents in the model. A: Na+ current generated in the model by stepping from −80 to 20 mV in 10-mV steps. Note the marked clamp escape around activation threshold (the −45-mV trace is indicated). Inset: the current transient elicited by a short voltage pulse injected into the soma either in the presence (black trace) or in the absence (gray trace) of the axon. The axon adds a slow component to the transient. B: I-V plots with different sodium channel distributions. The I-V plots are obtained either with control channel distribution (H/ANa = 0.5, H/AKV = 0.5, see Fig. 7), or with channels only in the hillock, or with channels only in the axon. In these panels, the simulated currents have been filtered to suit the typical response frequency of voltage-clamp recordings (−3 dB low-pass filtering at 1.6 kHz, see methods).
Data analysis
Whole cell current signals were analyzed using Clampfit (pClamp 6.0.5, Molecular Devices). Na+ currents were re-filtered off-line at 3 kHz. Current amplitude was measured at the peak of each tracing. Data fittings with exponential functions, I = Σ Ai·exp(–t/τi) + C, were carried out using Clampfit. Single-channel recordings were analyzed using Clampfit 8.2. Residual capacitive transients were nullified by off-line subtracting fits of average blank traces. Residual leakage currents were carefully measured in trace regions devoid of any channel openings, and digitally subtracted. Average values were expressed as means ± SE. Statistical significance was evaluated by means of the two-tail Student's t-test for unpaired data.
RESULTS
Recent electrophysiological and immunohistochemical studies suggested that in cerebellar granule cells, most of the Na+ current was generated in the axon (Goldfarb et al. 2007; Magistretti et al. 2006). Figure 1A shows immunolocalization of Na+ channels (pan-sodium alpha antibody) in the axon of P20 rodents. Staining was especially intense for ∼5 μm in the axon initial segment. Moreover, FHF4 staining (FGF14 antibody) also occurred in the initial segment. FHF4 specifically binds Na+ channels and is essential to determine appropriate channel gating (Goldfarb et al. 2007). Therefore immunohistochemistry indicates that the highest density of functional Na+ channels is in the axonal initial segment of granule cells in juvenile adult rats, similar to what was previously demonstrated in adult mice (Goldfarb et al. 2007). This channel localization was further investigated and confirmed by using patch-clamp recordings (Figs. 2–4).
Transient Na+ currents are largely unclamped in granule cells in situ
A first indication on the functional localization of Na+ channels was obtained by analyzing the whole cell Na+ current recorded from granule cells in acute cerebellar slices.
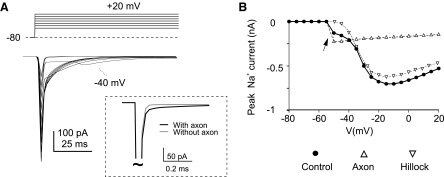
The transient Na+ current (I-Nat) was elicited by delivering 20-ms voltage square pulses at –75 to +20 mV in 5-mV increments. As already reported (Magistretti et al. 2006), a large majority of granule cells in situ (that we named, for brevity, group-1 cells: n = 60 of 84) showed I-Nat consisting of two distinct components (Fig. 2A1) . A first component was a low-threshold all-or-nothing spike that activated with a lag that decreased in duration with increasing depolarization. These properties are suggestive of an event generated at a site electrotonically distant from the soma and prone to escape from clamp control, presumably the axon. A second component consisted in a well-clamped current that activated gradually in a more positive voltage range, thus superimposing to the unclamped spike. An example of the current-voltage relationship, I-V, of this double Na+-current complex is shown in Fig. 2A1, inset: the unclamped spike was manifested as an abrupt current deflection which, over a 5-mV range, arose from zero to ∼25% of the amplitude of the I-V peak and was followed by a notch. In a few other cells (group 2: n = 15), the second, well-clamped Na+-current component was observed in isolation: an example of the currents recorded in these neurons is illustrated in Fig. 2A2. In group-2 cells, a measurable current was activated starting around –50 mV and smoothly increased in peak amplitude with increasing depolarization with a maximum in the I-V relationship at –20/–15 mV (Fig. 2A2, inset).
These results indicate that there are Na+ channels located in the proximity of the soma, whereas others are located far way, most probably in the axon. Under the hypothesis that the unclamped spike observed in group-1 cells is generated at some axonal location, its absence in group-2 neurons could be due the fact that in these cells the axon had been severed during the slicing procedure or the patch-pipette approaching maneuver. Consistent with this view, the slow time constant of capacitive-current decay (τ2; see methods), which is related to granule cell axon charging (see methods and following text), was significantly less represented in group-2 than in group-1 cells (Fig. 2, B and C).
Transient Na+ currents are almost absent in acutely dissociated granule cells
To determine the location of Na+ channels responsible for the well-clamped component of I-Nat, we performed experiments in acutely isolated granule cells, in which cell processes are severed. If Na+ channels responsible for the well-clamp component were located in the soma, their current should be recorded from all the isolated granule cells. But if Na+ channels were only located in the axon, as suggested by immunocitochemistry, then their current should be hardly detectable in most cases.
Following mechanical dissociation (no proteolytic enzymes were used to prevent possible Na+ channel alterations; see methods), granule cells showed a nearly-spherical neuronal soma devoid of any processes. Interestingly, in >90% of cells (n = 29 of 32 at P18-P21, plus 11 other cells of 12 at P13), no voltage-dependent Na+ currents could be evoked. In the few cells in which Na+ currents were recorded, their amplitude was significantly lower than in granule cells in situ (Fig. 3A, right). The I-Nat that could be recorded in the minority of dissociated granule cells (n = 3 of 32) only consisted of a well-clamped component with properties almost identical to those found in group-2 granule cells in situ (described in Magistretti et al. 2006) and a regular I-V relationship without notch peaking at –20 mV (Fig. 3A).
FIG. 3.
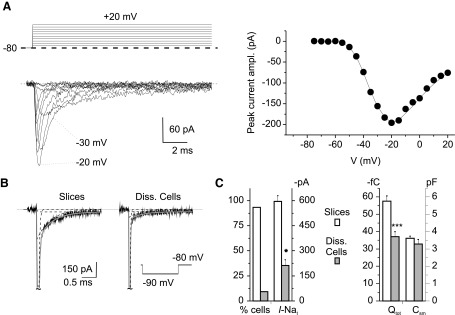
Na+ currents in isolated granule cells. The figure documents how the absence of I-Nat in the majority of acutely dissociated granule cells correlates with a reduction of total membrane but not somatic membrane surface. A: an example of the I-Nat that could be recorded in a minority of acutely dissociated granule cells (n = 3 of 32). The voltage protocol is shown at the top (only sweeps in 10-mV increments are shown). The corresponding I-V relationship is shown on the right. B: examples of the capacitive currents recorded in a representative granule cell in situ and in a representative dissociated granule cell in response to a –10-mV voltage pulse (the transient has been truncated: tildes). The gray line is the double-exponential fitting of the transient's decay phase. The single-exponential functions are shown as dotted lines. Fitting parameters for the group-1 cell recorded in slice: A1 = −260.8 pA, τ1 = 77.5 μs, A2 = −18.5 pA, τ2 = 1.26 ms, C = −1.7 pA. Fitting parameters for the acutely isolated cell: A1 = −420.4 pA, τ1 = 38.6 μs, A2 = −5.0 pA, τ2 = 1.11 ms, C = −1.6 pA. C, left: percentage of cells showing a measurable I-Nat (n = 91 in situ and n = 32 in dissociated granule cells) and maximal peak amplitude of I-Nat, when present, in granule cells in situ (n = 84) and acutely dissociated granule cells (n = 3; *, P < 0.05, unpaired t-test). Right: average total charge transferred with capacitive current transients evoked by –10-mV voltage pulses and somatic capacitance (Csm) in granule cells in situ (n = 83) and acutely dissociated granule cells (n = 32; triple asterisk, P < 0.001, unpaired t-test).
The absence of Na+ channels in the majority of acutely isolated granule cells was not due to damage of neuronal membrane secondarily to the dissociation procedure because granule cell input resistance was even higher in dissociated cells (3.33 ± 0.40 GΩ, n = 33) than in neurons in situ (1.45 ± 0.17 GΩ, n = 83; P < 1·10–4). To conclude that the preceding findings reflect lack or very low expression of voltage-gated Na+ channels in the granule cell soma, a reduction of the somatic membrane surface secondary to the dissociation procedure should be excluded. Thus we examined capacitive current transients to evaluate granule cell membrane capacitance and compare it between intact and dissociated neurons (Fig. 3B). As in granule cells in situ, also in dissociated granule cells capacitive-current decay could be fitted by a double-exponential function, but the slower exponential component was less pronounced (Fig. 3C, main panels). The fastest exponential component has been shown to reflect charging of the somatic compartment, slower components representing instead cable currents related to charging of neuronal processes (Jackson 1992). The total charge transferred by capacitive currents (see methods for details) was markedly and significantly lower in dissociated granule cells than in granule cells in situ (Fig. 3C), indicating that a substantial portion of membrane was missing in dissociated granule cells. By contrast, the soma membrane capacitance (Csm) was not significantly different in granule cells in situ and dissociated granule cells (Fig. 3C). Hence the somatic membrane was almost completely preserved in dissociated granule cells, whereas an additional portion of membrane surface, present in intact cells and necessarily belonging to neuronal processes, was missing in isolated neurons. These findings demonstrate that the strong reduction or even lack of voltage-dependent Na+ currents in dissociated granule cells is paralleled by the loss of granule cell processes (both axon and dendrites) and is not related to a reduction of the somatic membrane surface.
Single Na+ channel currents are almost absent in somatic cell patches
Further information on Na+-channel localization was obtained by performing single-channel recordings in granule cells in situ. Because recordings from hillock or axon are unpractical given the extremely small size of these structures (∼0.1 μm), somatic cell-attached recordings were performed to reveal the potential presence of single Na+ channels.
Seal formation (>10 GΩ) was considered to reflect the establishment of a correct cell-attached configuration, rather than a specific pipette tip obstruction by extracellular material, only when both of the following conditions were met: 1) during the early phases of superfusion with high-K+ solution, trains of capacitive action currents were observed, indicating depolarization-induced AP firing; 2) after the end of the recording, microscopic inspection revealed that when the patch pipette was withdrawn, the membrane was stretched and tended to follow the pipette. All other recordings were discarded. After seal formation, the slice was perfused with a high-K+ solution (see methods) to fully depolarize cells, under which condition the voltage commanded inside the pipette corresponds to the transmembrane potential across the cell-attached patch. Holding potential was set at –80 to –120 mV, and 50-ms voltage square pulses at –40 to 0 mV were delivered to activate voltage-gated Na+ channels. Twelve patches were successfully studied, and a total of ∼1,200 sweeps were recorded (∼100 sweeps per patch). In 9 of 12 patches, no channel activity was evoked by step depolarization. In three patches, a transient Na+-channel activity similar to that described in other central neurons (Aldrich et al. 1983; Alzheimer et al. 1993; Kirsch and Brown 1989; Magee and Johnston 1995; Magistretti et al. 1999), was observed (see Fig. 4) . Ensemble-average currents (EACs) were constructed for these patches. At –20 mV, the peak amplitude of EACs averaged –1.23 ± 0.73 pA (n = 3). The surface area of membrane patches was estimated to be ≥0.88 μm2, corresponding to an average Na+-current density ≤0.35 pA/μm2 in the 12 patches. Such current density would produce a total somatic current ≤61.7 pA in a granule cell of 7.5 μm of somatic diameter, i.e., <14% of the peak Na+ current observed in group-2 granule cells. These results indicate that Na+ channels are expressed at very low density in the granule cell soma. The consistency of this observation with results obtained from isolated cell recordings and immunohistochemistry tends to exclude a potential Na+ channel stretch-inactivation.
Multicompartmental modeling of granule cells: electrotonic and active properties
The data reported in Figs. 1–4 strongly support a topographic distribution of Na+ channels, which are remarkably absent from the somato-dendritic compartment but enriched in the axon initial segment. The impact of axonal Na+ channel localization on intrinsic electroresponsive properties was investigated by developing a multicompartmental model of the granule cell including the soma, four dendrites, an axon hillock, and a thin elongated axon (Fig. 5A). In the model, spike-generating mechanisms (including Na+ channels and delayed rectifier K+ channels) were placed in the axon and enriched in the hillock, while the other ionic mechanisms were placed in the somato-dendritic compartment (see methods, Table 1 and Fig. 5A).
FIG. 5.

Granule cell multi-compartmental model. A: Schematics of the compartmental structure and ion channel distribution in the model (the axon is only partly represented). All compartments are modeled as cylinders (Rall 1968) and their length and diameter (in μm) are indicated. Inset: the voltage transient elicited by a short current pulse (arrow) injected into the soma. Note the biphasic voltage decay (gray trace), from which the time constants τm and τ1 were estimated through bi-exponential fitting (dashed black trace). B: the plots show average firing frequency (left) and 1st-spike latency (right) during injection of depolarizing current steps in the soma. Inset traces: the response of the model to 10-, 15-, and 20-pA current injection.
When injected with subthreshold current pulses in the soma, the granule cell model generated a bi-exponential voltage transient (see Fig. 5A, inset). The two decay time constants, τm = 6.9 ms and τ1 = 0.7 ms, corresponded to the membrane time constant and to charge equalization constant measured experimentally (D'Angelo et al. 1993, 1995). The dendritic electrotonic length, which was estimated by applying the two-port theory on the dendrites (Carnevale et al. 1997) was L = 0.031, in closed matching with experimental determinations (L = 0.04) (D'Angelo et al. 1993; Silver et al. 1992), demonstrating a high electrotonic compactness. The steady-state input impedance, Zin, between the main sections of the model (Koch 1999) was Zin(soma→dendrite) = 1.15 GΩ, Zin(dendrite→soma) = 1.12 GΩ, Zin(soma→axon) = 2.01 GΩ, Zin(axon→soma) = 1.12 GΩ. Zin showed a marked frequency dependence, causing much stronger attenuation of fast signals (like spikes) than slow signals (like EPSPs) along the axon (data not shown), bearing consequences that are illustrated in the following text.
When injected with suprathreshold current impulses into the soma, the granule cell model generated spikes with the amplitude and shape typical of granule cells. When injected with variable current intensities, the model was able to reproduce the input-output properties of granule cells, in particular the relationships of spike frequency and delay versus injected current (Fig. 5B) (cf. D'Angelo et al. 1995, 1998, 2001; Goldfarb et al. 2007; Magistretti et al. 2006). Therefore dislocation of the spike generating mechanisms into the axon did not remarkably alter the input-output properties of the neuron.
A further evaluation of model responses was obtained simulating the Na+ current. Given appropriate H/ANa ratio (see following text), the total I-Nat measured from the soma had amplitude and kinetics in matching with experimental results in group-1 cells (Fig. 6A). The current escaped from clamp around threshold generating a delayed all-or-nothing spike. The I-V relationship, by showing a notch around −40/-50 mV, was also similar to that of real cells. Removing the axon left a well-clamped component as in group-2 cells. Removing Na channels from hillock left only the “notched” unclamped current. Therefore the topography of Na+ channel distribution adopted in the model explained the immunohistochemical and electrophysiological properties observed experimentally. It should also be noted that in response to brief hyperpolarizing voltage-pulses, the model generated a current transient consisting of a large fast component associated with a small slow tail. The slow tail disappeared by removing the axon, therefore mimicking the difference observed between group-1 and group-2 (or acutely dissociated) granule cells (Fig. 6A, inset, cf. Figs. 2 and 3).
Fine balancing of Na+ and K+ channels in the axon
Although immunohistochemisty indicates that Na+ channels are enriched in the axon hillock, the proper balance of currents between hillock and axon ascending branch (that we called H/A ratio) was unknown and had to be determined through simulations. We have distinguished H/ANa for Na+ channels and(H/A)KV for K+ delayed rectifier channels.
The analysis of simulated Na+ currents reported above showed that H/ANa = 1 (all channels in the hillock) and H/ANa = 0 (all channels in the ascending branch) reflected unphysiological cases while the complexity of group-1 response was matched with H/ANa = 0.5 (channels both in the hillock and ascending branch). Clearly given the much higher surface of axon than hillock, H/ANa = 0.5 implies that Na+ channel density is particularly high in the hillock as observed with immunohistochemistry. Then we systematically explored the impact of the H/ANa ratio on neuronal excitability. H/ANa proved critical to determine appropriate spike firing at the soma (Fig. 7B). Too few hillock Na+ channels depressed somatic spike amplitude and regularity, whereas too many hillock Na+ channels raised the spike upstroke above its natural amplitude (the upstroke is around 10 mV in real cells). Moreover in the latter case, subthreshold activation of the A current was anticipated and the first spike was abnormally delayed. It should be noted that the soma-axon conduction velocity was in the range measured experimentally (∼200 μm/ms) (D'Angelo et al. 1995; Isope et al. 2004) and was rather insensitive to H/ANa. However, for H/ANa<50% spikes initiated in the axon and then actively back-propagated both forward and backward, while for H/ANa>60% spikes initiated in the hillock and then passively invaded the axon. Because this latter condition was unphysiological (spikes are known to actively travel through the parallel fibers and ascending axon), we chose H/ANa = 0.5 as the most effective balance (see Fig. 4A).
FIG. 7.

Effects of Na+ and K+ channel localization. A: spike firing with different axonal sodium channel distributions. Leftmost plot: irregular spikelets when all channels are in the axon (H/ANa = 0). Central plot: the case when H/ANa = 0.5: this model generates regular repetitive firing with almost no adaptation. Rightmost plot: the model response when all channels are in hillock (H/ANa = 1). All the traces were obtained by injecting a 10-pA current pulse in the soma. B, left: variation of spike amplitude vs. H/ANa ratio. The dotted line corresponds to the control case where H/ANa = 0.5. Right: variation of spike propagation velocity vs. H/ANa ratio. The data correspond to spikes elicited by a 10-pA current pulse in the soma. The drawings illustrate the direction of axonal spike transmission, which is active for H/ANa< 0.5 and passive for H/ANa> 0.6. C, left: variation of spike amplitude vs. H/AKV ratio. The dotted line corresponds to the control case where H/AKV = 0.5. Right: variation of spike propagation velocity vs. H/AKV ratio. The data correspond to spikes elicited by a 10-pA current pulse in the soma. The drawings illustrate the direction of axonal spike transmission, which is active for all H/AKV values.
After having established a reliable H/ANa with a constant Na/K channel density, we investigated the impact of KV distribution. The H/AKV ratio is shown in Fig. 7C. Changing H/AKV from 0 (all KV channels in the axon) to 1 (all KV channels in the hillock) did not substantially modify either spike amplitude or conduction velocity. Thus in the rest of the simulations we maintained H/ANa = 0.5 and H/AKV = 0.5.
Spike initiation and propagation
Spike propagation dynamics were assessed by activating the synapses and following the temporal sequence of events (Fig. 8A and Supplemental material;1 similar results were obtained using current injection into the soma, data not shown). Interestingly, the spike arose almost simultaneously over the whole ascending branch because this was the site with the highest input resistance. Back-propagation from axon to dendritic endings occurred in <200 μs and was accompanied by a decrease of the upstroke from 30 to 10 mV. Spike attenuation and delay at the junction between axon and hillock reflected current dispersion through the large somato-dendritic compartment.
FIG. 8.

Action potential generation and propagation. A spike was elicited by synchronously activating 3 excitatory synapses (initial potential = −70 mV) and membrane potential was recorded at different locations. A: the whole somato-dendritic compartment charged almost simultaneously before a spike was elicited in the axon. Then the spike back-propagated into the somato-dendritic compartment. The axonal spike was larger than in the rest of the neuron. Inset: the spike upstroke on an enlarged scale. A very similar picture could be drawn for spikes elicited by step current injection (not shown). B: the model was implemented with parallel fibers demonstrating that the initiation site remains in the ascending axon. Then the spike actively propagates along the parallel fibers and toward the soma and dendrites. The distance from spike initiation site and the conduction time are indicated.
This simulation satisfactorily reproduced the granule cell behavior in sagittal cerebellar slices in which the axon is interrupted before or soon after branching into parallel fibers. However, an obvious question was whether the same behavior was manifest in the presence of parallel fibers. The model was therefore extended to include 500-μm-long parallel fibers on both sides of the bifurcation (Fig. 8B) and equipped with the same channels as the ascending axon. Spikes could be elicited both orthodromically and antidromically and traveled between parallel fibers and soma at physiological velocity (between 200 and 300 μm/ms). Importantly, spikes in the model with parallel fibers were generated in the mid of the ascending branch supporting the finding reported using the model with the ascending branch only. Other aspects, like the variation in spike size observed along the axon, could not be further explored because of the lack of details on channels in the parallel fibers and in the axonal bifurcation.
Transmission of synaptic potentials and synaptic integration
The granule cell has long been supposed to be an ideal synaptic integrator (Gabbiani et al. 1994; see also Gall et al. 2005). To assess this property, we visualized membrane potential transmission between dendrites and axon (Fig. 9). EPSP transmission from the dendrites to the axonal spike initiation site occurred with negligible decrement or delay (<0.4 ms and <0.8 mV at the peak of EPSPs elicited over the entire subthreshold range; Fig. 9A). There are two possible explanations for this high compactness, one related to the electrotonic structure and the other to EPSP amplification. Indeed the persistent Na+ current and the NMDA current actively enhanced the EPSP, especially in the immediately subthreshold region (Fig. 9A). However, the blockage of the persistent Na+ current and of the NMDA current in the simulations did not appreciably alter EPSP diffusion to the axon, implying that the electrotonic structure was the main responsible of fast and reliable EPSP diffusion (Fig. 9A).
FIG. 9.

Excitatory and inhibitory postsynaptic potential (EPSP and IPSP) transmission. A: EPSPs shown at the left were generated by activating 2 excitatory synaptic inputs (dendrite 1 and 2). To represent a more natural condition, the traces at the right show model responses to a combination of excitatory (dendrite 1 and 2) and inhibitory (dendrite 2) synaptic inputs. The inhibitory synapse is activated 4 ms after the excitatory synapses to respect the delay in the feed-forward Golgi cell–granule cell loop. Both in the absence and presence of inhibition, the model depolarization in dendrite 2 is almost indistinguishable from that in dendrite 4 (that was inactive) and in the soma, hillock and axonal compartments. Superimposition of traces demonstrates their remarkable similarity and absence of relevant electrotonic decay. B: EPSPs were elicited by activating 2 excitatory synapses. Selective conductance switch-off shows that EPSPs are indeed amplified and protracted by Na+ and N-methyl-d-aspartate currents activating in the immediate subthreshold region. However, EPSP amplification was of little effect on potential transmission into the axon.
A mechanism potentially affecting membrane potential transmission from dendrites to axon is activation of inhibitory synapses, which cause an increase in input conductance and a loss of electrotonic compactness. Nonetheless, when inhibitory synapses were activated, the EPSPs still diffused with negligible alteration to the axon as well as to all the other dendrites (Fig. 9B).
As a final test, the granule cell model was bombarded with plausible synaptic input patterns inspired by those recently recorded in vivo (Fig. 10). As real granule cells, the model responded to short high-frequency mossy fiber bursts (5 impulse at 300 Hz) (Rancz et al. 2007) with another burst. The major regulatory factors of granule cell discharge are synaptic inhibition from Golgi cell (Eccles et al. 1967; Forti et al. 2006; Solinas et al. 2008a,b; Vos et al. 1999) and release probability at the mossy fiber-granule cell synapse (Nieus et al. 2006; Sola et al. 2004). Synaptic inhibition was implemented with a 4-ms delayed inhibitory postsynaptic current (IPSC) to reproduce activity in the feed-forward (mossy fiber –Golgi cell –granule cell) loop (Mapelli and D'Angelo 2007). Simulations shown in Fig. 10 demonstrate that certain combinations of inhibitory activity and release probability at the mossy fiber–granule cell synapse can modulate or even suppress granule cell activity. Thus the model, once equipped with the appropriate Na+ channel distribution, was able to reproduce native granule cell activity patterns.
FIG. 10.
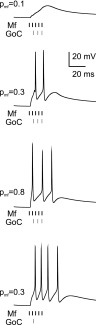
Synaptic integration. The traces show model responses to bursts of spikes in the mossy fibers (5 impulses at 300 Hz). Release probability at the excitatory synapses (from 0.1 to 0.8) and synaptic inhibition (1 to 3 spikes at 200 Hz) regulated the duration and intensity of the discharge. In the simulations, 3 excitatory and 3 inhibitory synapses are activated. All simulations were done from the initial potential of −70 mV.
DISCUSSION
This paper demonstrates the functional consequences of Na+ channel localization in cerebellar granule cells. Na+ channels are enriched in the hillock generating a current that is readily transmitted without remarkable electrotonic distortion to the soma (Magistretti et al. 2006). In addition, a relevant unclamped component indicates that Na+ channels are also localized in the continuation of the axon. This was not unexpected because the granule cell ascending axon and the parallel fibers can actively propagate action potentials (Cohen and Yarom 1998; Eccles et al. 1967; Isope et al. 2004; Vranesic et al. 1994). In support to this view, granule cells obtained by acute dissociation, in which the axon is severed, either did not show any measurable Na+ current or showed a small well-clamped component, probably originating from a residual part of the hillock. Moreover, somatic patches were almost devoid of Na+ channels. In summary, there is strong evidence supporting an almost pure axonal localization of Na+ channels in rat cerebellar granule cells already at the third postnatal week in matching with the segregation observed at more advanced stages of life in mice (Goldfarb et al. 2007).
Multicompartmental modeling allowed to investigate the impact of the specific topography of axonal Na+ channel localization on action potential generation and synaptic integration. Due to the cell compact electrotonic structure, EPSPs were efficiently transmitted from the synapses to the axonal spike initiation site (<10% attenuation) and among the dendrites themselves (<1% attenuation). The action potential originated almost simultaneously over the whole axonal ascending branch and then rapidly (<200 μs) back-propagated into the somato-dendritic compartment with an attenuation leading to an upstroke of about +10 mV. Simulated propagation delay and somatic spike amplitude closely match those reported in real cells (D'Angelo et al. 1995; Isope et al. 2004). The high current density in the hillock limited the sharp decrease in spike size that would follow current dissipation at the axon-soma junction. This mechanism caused an efficient back-propagation even in the absence of dendritic Na+ channels, which are needed in more complex neurons like pyramidal cells (Antic 2003;Stuart and Sakmann 1994; Stuart et al. 1997a,b; Zhou et al. 2007) to ensure that spikes reach the dendritic endings. These electrotonic and excitable properties provide the biophysical substrate for coincidence detection and rapid information transfer at the input stage of the cerebellar network. The functional importance of Na+-dependent excitability in granule cells is illustrated by the fact that its alteration causes disturbances of motor control as observed in FHF1-4 KO mice (Goldfarb et al. 2007), in Nav1.6 KO mice (Levin et al. 2006), and in PrP KO mice (Prestori et al. 2009).
A fundamental property of this model is that it has been built on available experimental data without anticipating any of the properties that had to be reproduced. Granule cell morphology was derived from histological and EM reconstructions (Hàmori and Somogy 1983) yielding passive electrical responses and a somato-dendritic electronic length (L = 0.031) in excellent matching with experimental estimates (see Figs. 1 and 2) (cf. D'Angelo et al. 1993; Silver et al. 1992). The voltage-dependent and synaptic mechanisms were derived from previous electrophysiological analysis (for a summary, see D'Angelo et al. 2001; Nieus et al. 2006), implementing the quite exceptional case of a mammalian neuron model in which most active properties can be precisely constrained to experimental data. The main model variable, i.e., Na+ channel localization and density, was explored with extensive simulations. Interestingly, the Na+ channel localization and density that best fitted with voltage-clamp recordings and immuno-labeling data were those that also allowed an efficient reproduction of granule cell excitable patterns and input-output relationships. This result was robust in that neither altering the Na/K channel balance in the axon nor elongating the ascending axon into parallel fibers substantially modified the output spike pattern and the spike initiation site. It should be noted that, in the model, the three main Na+ current components (namely transient, persistent, and resurgent) were distributed in a constant proportion. However, in real granule cells, these current components may be related to different channels subtypes, Nav1.2 and Nav1.6, and may have a different distribution between hillock and axon (Levin et al. 2006). It is tempting to speculate that different Na+ channel subtypes, as well as ionic channels contained in synaptic boutons, might help to preventing the decrease in spike size observed along parallel fibers in the model.
In summary, the axonal localization of Na+ channels in granule cells bears four main implications. First, spike back-propagation into the somato-dendritic compartment can efficiently gate voltage-dependent channels (including various K+ and Ca2+ channels) regulating the temporal dynamics of discharge (D'Angelo et al. 1998 2001), and the NMDA channels can be efficiently unblocked allowing the induction of long-term synaptic plasticity (D'Angelo et al. 1999). Second, signal transmission from dendrites to axon occurs with submillisecond delay, allowing the extraordinary precision in spike timing needed for cerebellar signal processing in the temporal domain. Moreover, all synapses made by the ascending branch on Purkinje cells (and potentially also Golgi cells) (Palay and Chan-Palay 1974) would be almost synchronously activated, implementing an efficient vertical organization of cerebellar activation (Bower and Woolston 1983; Cohen and Yarom 1998; Sims and Hartell 2005). Third, the control of delays in parallel fibers, which have been proposed to act as delay lines on the millisecond time scale (Breitenberg 1967), needs to be operated by mechanisms other than spike generation in the ascending axon. Because similar to the ascending axon, the parallel fibers also have a conduction velocity around 0.2–0.3 μm/ms (Vranesic and Knöepfel 1994), regulation of delays may primarily reside at the mossy fiber–granule cell synapse (Nieus et al. 2006). Finally, it should be noted that whereas the multicompartmental model is not superior to the monocompartmental model in predicting granule cell firing, it presents a main advantage that will be exploited in the future. Axonal Na+ channels generate a powerful sink of positive charge during the spike, while return positive currents would leave the soma acting as a passive source creating an electrical dipole. This arrangement is expected to determine large part of the extracellular current flow needed to generate field potentials recorded in vitro (Mapelli and D'Angelo 2007) and in vivo (Eccles et al. 1967) from the granular layer, opening the route to mathematical procedures for field potential reconvolution (Diwakar and D'Angelo, unpublished data).
GRANTS
This work was supported by the European Community Grant SENSOrimotor structuring of Perception and Action for emergent Cognition (FP6-IST028056) and by the Consorzio Nazionale Interuniversitario per le Scienze Fisiche della Materia (CNISM) Grant NEUROIMAGE to E. D'Angelo and Naitonal Institute of Neurological Disorders and Stroke Grant NS-39906 to M. Goldfarb. S. Diwakar was the percipient of an Miglioramento delle risorse umane nel settore della ricerca e dello sviluppo tecnologico fellowship from the European Social Fund, Ministero del Lavoro e della Previdenza Sociale and Regione Lombardia of Italy.
Acknowledgments
The authors acknowledge helpful discussion on this work by S. Solinas and T. Nieus and control imaging experiments by F. Prestori.
The costs of publication of this article were defrayed in part by the payment of page charges. The article must therefore be hereby marked “advertisement” in accordance with 18 U.S.C. Section 1734 solely to indicate this fact.
Footnotes
The online version of this article contains supplemental material.
REFERENCES
- Aldrich 1983.Aldrich RW, Corey DP, Stevens CF. A reinterpretation of mammalian sodium channel gating based on single channel recording. Nature 306: 436–441, 1983. [DOI] [PubMed] [Google Scholar]
- Alzheimer 1993.Alzheimer C, Schwindt PC, Crill WE. Modal gating of Na+ channels as a mechanism of persistent Na+ current in pyramidal neurons from rat and cat sensorimotor cortex. J Neurosci 13: 660–673, 1993. [DOI] [PMC free article] [PubMed] [Google Scholar]
- Antic 2003.Antic SD Action potentials in basal and oblique dendrites of rat neocortical pyramidal neurons. J Physiol 550: 35–50, 2003. [DOI] [PMC free article] [PubMed] [Google Scholar]
- Bower 1983.Bower JM, Woolston DC. Congruence of spatial organization of tactile projections to granule cell and Purkinje cell layers of cerebellar hemispheres of the albino rat: vertical organization of cerebellar cortex. J Neurophysiol 49: 745–766, 1983. [DOI] [PubMed] [Google Scholar]
- Breitenberg 1967.Breitenberg V Is the cerebellar cortex a biological clock in the millisecond range? Prog Brain Res 25: 334–346, 1967. [DOI] [PubMed] [Google Scholar]
- Carnevale 1995.Carnevale NT, Tsai KY, Claiborne BJ, Brown TH. The electrotonic transformation: a tool for relating neuronal form to function. In: Advances in Neural Information Processing Systems, edited by Tesauro G, Touretzky DS, Leen TK. Cambridge, MA: MIT Press, 1995, vol. 7, p. 69–76. [Google Scholar]
- Carnevale 1997.Carnevale NT, Tsai KY, Claiborne BJ, Brown TH. Comparative electrotonic analysis of three classes of rat hippocampal neurons. J Neurophysiol 78: 703–720, 1997. [DOI] [PubMed] [Google Scholar]
- Clark 2005.Clark BA, Monsivais P, Branco T, London M, Hausser M. The site of action potential initiation in cerebellar Purkinje neurons. Nat Neurosci 8: 137–139, 2005. [DOI] [PubMed] [Google Scholar]
- Cohen 1998.Cohen D, Yarom Y. Patches of synchronized activity in the cerebellar cortex evoked by mossy-fiber stimulation: questioning the role of parallel fibers. Proc Natl Acad Sci USA 95: 15032–15036, 1998. [DOI] [PMC free article] [PubMed] [Google Scholar]
- Colbert 1998.Colbert CM, Johnston D. Axonal action-potential initiation and Na+ channel densities in the soma and axon initial segment of subicular pyramidal neurons. J Neurosci 16: 6676–6686, 1998. [DOI] [PMC free article] [PubMed] [Google Scholar]
- D'Angelo 2001.D'Angelo E, Nieus T, Maffei A, Armano S, Rossi P, Taglietti V, Fontana A, Naldi G. Theta-frequency bursting and resonance in cerebellar granule cells: experimental evidence and modeling of a slow K+-dependent mechanism. J Neurosci 21: 759–770, 2001. [DOI] [PMC free article] [PubMed] [Google Scholar]
- D'Angelo 1998.D'Angelo E, Filippi GD, Rossi P, Taglietti V. Ionic mechanism of electroresponsiveness in cerebellar granule cells implicates the action of a persistent sodium current. J Neurophysiol 80: 493–503, 1998. [DOI] [PubMed] [Google Scholar]
- D'Angelo 1995.D'Angelo E, Filippi GD, Rossi P, Taglietti V. Synaptic excitation of individual rat cerebellar granule cells in situ: evidence for the role of NMDA receptors. J Physiol 484: 397–413, 1995. [DOI] [PMC free article] [PubMed] [Google Scholar]
- D'Angelo 1999.D'Angelo E, Rossi P, Armano S, Taglietti V. Evidence for NMDA and mGlu receptor-mediated long-term potentiation of mossy fibre-granule cell transmission in the rat cerebellum. J Neurophysiol 81: 277–287, 1999. [DOI] [PubMed] [Google Scholar]
- D'Angelo 1994.D'Angelo E, Rossi P, Filippi GD, Magistretti J, Taglietti V. The relationship between synaptogenesis and expression of voltage-dependent currents in cerebellar granule cells in situ. J Physiol 88: 197–207, 1994. [DOI] [PubMed] [Google Scholar]
- D'Angelo 1993.D'Angelo E, Rossi P, Taglietti V. Different proportions of N-methyl-d-aspartate and non-N-methyl-d-aspartate receptor currents at the mossy fibre-granule cell synapse of developing rat cerebellum. Neuroscience 53: 121–130, 1993. [DOI] [PubMed] [Google Scholar]
- Eccles 1967.Eccles JC, Ito M, Szentagothai J. The Cerebellum as a Neuronal Machine. New York: Springer-Verlag, 1967.
- Forti 2006.Forti L, Cesana E, Mapelli J, D'Angelo E. Ionic mechanisms of autorhythmic firing in rat cerebellar Golgi cells. J Physiology 574.3: 711–729, 2006. [DOI] [PMC free article] [PubMed] [Google Scholar]
- Gabbiani 1994.Gabbiani F, Midtgaard J, Knopfel T. Synaptic integration in a model of cerebellar granule cells. J Neurophysiol 72: 999–1009, 1994. [DOI] [PubMed] [Google Scholar]
- Gall 2005.Gall D, Prestori F, Sola E, D'Errico A, Roussel C, Forti L, Rossi P, D'Angelo E. Intracellular calcium regulation by burst discharge determines bidirectional long-term synaptic plasticity at the cerebellum input stage. J Neurosci 25: 4813–4822, 2005. [DOI] [PMC free article] [PubMed] [Google Scholar]
- Goldfarb 2007.Goldfarb M, Schoorlemmer J, Williams A, Diwakar S, Wang Q, Huang X, Giza J, Tchetchik D, Kelley K, Vega A, Matthews G, Rossi P, Ornitz DM, D'Angelo E. Fibroblast growth factor homologous factors control neuronal excitability through modulation of voltage-gated sodium channels. Neuron 55: 449–463, 2007. [DOI] [PMC free article] [PubMed] [Google Scholar]
- Golding 2002.Golding NL, Staff NP, Spruston N. Dendritic spikes as a mechanism for cooperative long-term potentiation Nature 418: 326–331, 2002. [DOI] [PubMed] [Google Scholar]
- Hamill 1981.Hamill OP, Marty A, Neher E, Sakmann B, Sigworth FJ. Improved patch-clamp techniques for high-resolution current recording from cells and cell-free membrane patches. Pfluegers 391: 85–100, 1981. [DOI] [PubMed] [Google Scholar]
- Hàmori 1983.Hàmori J, Somogyi J. Differentiation of cerebellar mossy fiber synapses in the rat: a quantitative electron microscope study. J Comp Neurol 220:365–377, 1983. [DOI] [PubMed] [Google Scholar]
- Hansel 2001.Hansel C, Linden DJ, D'Angelo E. Beyond parallel fiber LTD: the diversity of synaptic and non-synaptic plasticity in the cerebellum. Beyond parallel fiber LTD: the diversity of synaptic and non-synaptic plasticity in the cerebellum. Nat Neurosci 4: 467–475, 2001. [DOI] [PubMed] [Google Scholar]
- Häusser 1995.Häusser M, Stuart G, Racca C, Sakmann B. Axonal initiation and active dendritic propagation of action potentials in substantia nigra neurons. Neuron 15: 637–647, 1995. [DOI] [PubMed] [Google Scholar]
- Hines 1997.Hines ML, Carnevale NT. The NEURON simulation environment. Neural Comput 9: 1179–1209, 1997. [DOI] [PubMed] [Google Scholar]
- Hines 2001.Hines ML, Carnevale NT. NEURON: a tool for neuroscientists. Neuroscientist 7: 123–135, 2001. [DOI] [PubMed] [Google Scholar]
- Isope 2004.Isope P, Franconville R, Barbour B, Ascher P. Repetitive firing of rat cerebellar parallel fibers after a single stimulation. J Physiol 554: 829–39, 2004. [DOI] [PMC free article] [PubMed] [Google Scholar]
- Jackson 1992.Jackson MB Cable analysis with the whole-cell patch clamp. Theory and experiment. Biophys J 61: 756–766, 1992. [DOI] [PMC free article] [PubMed] [Google Scholar]
- Jakab 1988.Jakab RL, Hámori J. Quantitative morphology and synaptology of cerebellar glomeruli in the rat. Anat Embryol 179: 81–88, 1988. [DOI] [PubMed] [Google Scholar]
- Kirsch 1989.Kirsch GE, Brown AM. Kinetic properties of single sodium channels in rat heart and rat brain. J Gen Physiol 93: 85–99, 1989. [DOI] [PMC free article] [PubMed] [Google Scholar]
- Koch 1997.Koch C Computation and the single neuron. Nature 385: 207–210, 1997. [DOI] [PubMed] [Google Scholar]
- Koch 1999.Koch C Biophysics of Computation. New York: Oxford Univ. Press, 1999.
- Levin 2006.Levin SI, Khaliq ZM, Aman TK, Grieco TM, Kearney JA, Raman IM, Meisler MH. Impaired motor function in mice with cell-specific knockout of sodium channel Scn8a (NaV1.6) in cerebellar purkinje neurons and granule cells. J Neurophysiol 96: 785–793, 2006. [DOI] [PubMed] [Google Scholar]
- Lüscher 1998.Lüscher HR, Larkum ME. Modeling action potential initiation and back-propagation in dendrites of cultured rat motoneurons. J Neurophysiol 80: 715–729, 1998. [DOI] [PubMed] [Google Scholar]
- Magee 1995.Magee JC, Johnston D. Characterization of single voltage-gated Na+ and Ca2+ channels in apical dendrites of rat CA1 pyramidal neurons. J Physiol 487: 67–90, 1995. [DOI] [PMC free article] [PubMed] [Google Scholar]
- Magistretti 2006.Magistretti J, Castelli L, Forti L, D'Angelo E. Kinetic and functional analysis of transient, persistent and resurgent sodium currents in rat cerebellar granule cells in situ: an electrophysiological and modelling study. J Physiol 573: 83–106, 2006. [DOI] [PMC free article] [PubMed] [Google Scholar]
- Magistretti 1999.Magistretti J, Ragsdale DS, Alonso A. High conductance sustained single channel activity responsible for the low threshold persistent Na+ current in entorhinal cortex neurons. J Neurosci 19: 7334–7341, 1999. [DOI] [PMC free article] [PubMed] [Google Scholar]
- Mainen 1995.Mainen ZF, Joerges J, Huguenard JR, Sejnowski TJ. A model of spike initiation in neocortical pyramidal neurons. Neuron 15: 1427–1439, 1995. [DOI] [PubMed] [Google Scholar]
- Mapelli 2007.Mapelli J, D'Angelo E. The spatial organization of long-term synaptic plasticity at the input stage of cerebellum. J Neurosci 27: 1285–1296, 2007. [DOI] [PMC free article] [PubMed] [Google Scholar]
- Nieus 2006.Nieus T, Sola E, Mapelli J, Saftenku E, Rossi P, D'Angelo E. LTP regulates burst initiation and frequency at mossy fiber-granule cell synapses of rat cerebellum: experimental observations and theoretical predictions. J Neurophysiol 95: 686–699, 2006. [DOI] [PubMed] [Google Scholar]
- Palay 1974.Palay SL, Chan-Palay V. Cerebellar Cortex: Cytology and Organization. New York: Springer-Verlag, 1974.
- Prestori 1968.Prestori F, Rossi P, Bearzatto B, Lainé J, Necchi D, Diwakar S, Schiffmann SN, Axelrad H, D'Angelo E. Altered neuron excitability and synaptic plasticity in the cerebellar granular layer of juvenile prion protein knock-out mice with impaired motor control. J Neurosci 28: 7091–2103, 2008. [DOI] [PMC free article] [PubMed] [Google Scholar]
- Rall 1977.Rall W Core conductor theory and cable properties of neurons. Handbook of Physiology: The Nervous System, vol 1, pp. 39–98. Baltimore, 1977. [Google Scholar]
- Rall 1968.Rall W, Shepherd GM. Theoretical reconstruction of field potentials and dendro-dendritic synaptic interactions in olfactory bulb. J Neurophysiol 31: 884–915, 1968. [DOI] [PubMed] [Google Scholar]
- Rancz 2007.Rancz EA, Ishikawa T, Duguid I, Chadderton P, Mahon S, Häusser M. High-fidelity transmission of sensory information by single cerebellar mossy fibre boutons. Nature 450: 1245–1248, 2007. [DOI] [PMC free article] [PubMed] [Google Scholar]
- Rossi 2006.Rossi P, Mapelli L, Roggeri L, Gall D, de Kerchove d'Exaerde A, Schiffmann SN, Taglietti V, D'Angelo E. Inhibition of constitutive inward rectifier currents in cerebellar granule cells by pharmacological and synaptic activation of GABA receptors. Eur J Neurosci 24: 419–432, 2006. [DOI] [PubMed] [Google Scholar]
- Sakmann 1983.Sakmann B, Neher E. Geometric parameters of pipettes and membrane patches. In: Single-Channel Recording, edited by Sakmann B, Neher E. New York; Plenum, 1983, p. 37–68.
- Shen 1999.Shen GY, Chen WR, Midtgaard J, Shepherd GM, Hines ML. Computational analysis of action potential initiation in mitral cell soma and dendrites based on dual patch recordings. J Neurophysiol 82: 3006–3010, 1999. [DOI] [PubMed] [Google Scholar]
- Shepherd 1987.Shepherd GM, Brayton RK. Logic operations are properties of computer-simulated interactions between excitable dendritic spines. Neuroscience 21: 151–165, 1987. [DOI] [PubMed] [Google Scholar]
- Shibata 2000.Shibata R, Nakahira K, Shibasaki K, Wakazono Y, Imoto K, Ikenaka K. A-type K+ current mediated by the Kv4 channel regulates the generation of action potential in developing cerebellar granule cells. J Neurosci 20: 4145–4155, 2000. [DOI] [PMC free article] [PubMed] [Google Scholar]
- Silver 1992.Silver RA, Traynelis SF, Cull-Candy SG. Rapid-time-course miniature and evoked excitatory currents at cerebellar synapses in situ. Nature 355: 163–166, 1992. [DOI] [PubMed] [Google Scholar]
- Sims 2005.Sims RE, Hartell NA. Differences in transmission properties and susceptibility to long-term depression reveal functional specialization of ascending axon and parallel fiber synapses to Purkinje cells. Neuroscience 25: 3246–3257, 2005. [DOI] [PMC free article] [PubMed] [Google Scholar]
- Sola 2004.Sola E, Prestori F, Rossi P, Taglietti V, D'Angelo E. Increased neurotransmitter release during long-term potentiation at mossy fibre-granule cell synapses in rat cerebellum. J Physiol 557.3: 843–861, 2004. [DOI] [PMC free article] [PubMed] [Google Scholar]
- Solinas 2007.Solinas S, Forti L, Cesana E, Mapelli J, De Schutter E, D'Angelo E. Computational reconstruction of pacemaking and intrinsic electroresponsiveness in cerebellar Golgi cells. Front Cell Neurosci 1–2: 1–12, 2007. [DOI] [PMC free article] [PubMed] [Google Scholar]
- Solinas 2007.Solinas S, Forti L, Cesana E, Mapelli J, De Schutter E, D'Angelo E. Fast-reset of pacemaking and theta-frequency resonance patterns in cerebellar Golgi cells. Front Cell Neurosci 1–4: 1–9, 2007. [DOI] [PMC free article] [PubMed] [Google Scholar]
- Spruston 1995.Spruston N, Schiller Y, Stuart G, Sakmann B. Activity-dependent action potential invasion and calcium influx into hippocampal CA1 dendrites. Science 268: 297–300, 1995. [DOI] [PubMed] [Google Scholar]
- Stuart 1994.Stuart GJ, Sakmann B. Active propagation of somatic action potentials into neocortical pyramidal cell dendrites. Nature 367: 69–72, 1994. [DOI] [PubMed] [Google Scholar]
- Stuart 1994.Stuart GJ, Häusser M. Initiation and spread of sodium action potentials in cerebellar Purkinje cells. Neuron 13: 703–712, 1994. [DOI] [PubMed] [Google Scholar]
- Stuart 1997a.Stuart G, Schiller J, Sakmann B. Action potential initiation and propagation in rat neocortical pyramidal neurons. J Physiol 505: 617–632, 1997a. [DOI] [PMC free article] [PubMed] [Google Scholar]
- Stuart 1997b.Stuart G, Spruston N, Sakmann B, Häusser M. Action potential initiation and backpropagation in neurons of the mammalian CNS. Trends Neurosci 20: 125–131, 1997b. [DOI] [PubMed] [Google Scholar]
- Vos 1999.Vos BP, Volny-Luraghi A, De Schutter E. Cerebellar Golgi cells in the rat: receptive fields and timing of responses to facial stimulation. Eur J Neurosci 11: 2621–2634, 1999. [DOI] [PubMed] [Google Scholar]
- Vranesic 1994.Vranesic I, Iijima T, Ichikawa M, Matsumoto G, Knöpfel T. Signal transmission in the parallel fiber-Purkinje cell system visualized by high-resolution imaging. Proc Natl Acad Sci USA 91: 13014–13017, 1994. [DOI] [PMC free article] [PubMed] [Google Scholar]
- Yamada 1998.Yamada WM, Koch C, Adams PR. Multiple channels and calcium dynamics. In: Methods in Neuronal Modelling: From Synapses to Networks, edited by Koch C, Segev I. Cambridge, MA: MIT Press, 1998, p. 137–170.
- Wathey 1992.Wathey JC, Lytton WW, Jester JM, Sejnowski TJ. Computer simulations of EPSP-spike (E-S) potentiation in hippocampal CA1 pyramidal cells. J Neurosci 12: 607–618, 1992. [DOI] [PMC free article] [PubMed] [Google Scholar]
- Zhou 2007.Zhou WL, Ping Y, Wuskell JP, Loew LM, Antic SD. Intracellular long wavelength voltage-sensitive dyes for studying the dynamics of action potentials in axons and thin dendrites. J Neurosci Methods 164: 225–239, 2007. [DOI] [PMC free article] [PubMed] [Google Scholar]