

Abstract
The dynamics of sensory input to the nervous system play a critical role in shaping higher-level processing. In the olfactory system, the dynamics of input from olfactory receptor neurons (ORNs) are poorly characterized and depend on multiple factors, including respiration-driven airflow through the nasal cavity, odorant sorption kinetics, receptor–ligand interactions between odorant and receptor, and the electrophysiological properties of ORNs. Here, we provide a detailed characterization of the temporal organization of ORN input to the mammalian olfactory bulb (OB) during natural respiration, using calcium imaging to monitor ORN input to the OB in awake, head-fixed rats expressing odor-guided behaviors. We report several key findings. First, across a population of homotypic ORNs, each inhalation of odorant evokes a burst of action potentials having a rise time of about 80 ms and a duration of about 100 ms. This rise time indicates a relatively slow, progressive increase in ORN activation as odorant flows through the nasal cavity. Second, the dynamics of ORN input differ among glomeruli and for different odorants and concentrations, but remain reliable across successive inhalations. Third, inhalation alone (in the absence of odorant) evokes ORN input to a significant fraction of OB glomeruli. Finally, high-frequency sniffing of odorant strongly reduces the temporal coupling between ORN inputs and the respiratory cycle. These results suggest that the dynamics of sensory input to the olfactory system may play a role in coding odor information and that, in the awake animal, strategies for processing odor information may change as a function of sampling behavior.
INTRODUCTION
Olfactory information is initially represented by patterns of neural activity across a large and functionally diverse population of olfactory receptor neurons (ORNs). In mammals, the ORN population includes nearly 1,000 functionally distinct cell classes defined by the particular odorant receptor protein they express and ORNs—located deep inside the nasal cavity—are distributed across a physically complex space through which odorant molecules must flow to reach the receptor neuron. The axons of ORNs expressing the same odorant receptor converge onto one of two target glomeruli in the olfactory bulb (OB). Sensory neurons therefore present olfactory information to the brain in the form of stimulus-specific combinations of input to OB glomeruli. These patterns of glomerular input serve as the basis for all subsequent processing of olfactory information.
Odorant-evoked patterns of sensory input to OB glomeruli are temporally dynamic. First, the dynamics of ORN activation are strongly shaped by the inhalation of odorant into the nasal cavity and through the complex folds of tissue (turbinates) on which the olfactory epithelium (OE) lies (Schoenfeld and Cleland 2005). The dynamics are further shaped by the kinetics of odorant sorption into the mucus layer of the OE, a process that is dependent on intranasal flow rate and direction, odorant concentration, and odorant chemistry (Mozell and Jagodowicz 1973; Mozell et al. 1987; Scott et al. 2000; Scott-Johnson et al. 2000). Finally, the dynamics of ORN activation may be further shaped by receptor–ligand interactions, the transduction process, or intrinsic physiological properties of ORNs (Bobkov and Ache 2007; Hallem et al. 2004; Reisert and Matthews 2001). In anesthetized mice, ORN input to different glomeruli shows distinct temporal dynamics, with the same odorant eliciting input to glomeruli with different onset latencies, rise times, and decay kinetics (Spors et al. 2006). Thus the fine-scale temporal pattern of sensory input to the OB may contribute to coding odor information.
In addition, the dynamics of sensory input to the OB likely play a major role in shaping postsynaptic processing in the OB and beyond. Temporally structured inputs linked to respiration constitute a key feature of most models of OB network function (Buonviso et al. 2006) and many experimental and computational studies have suggested that olfactory information is encoded in the precise timing of mitral cell spiking relative to the respiratory cycle (Chaput 1986; Hopfield 1995; Macrides and Chorover 1972; Margrie and Schaefer 2003; Schaefer and Margrie 2007). Finer-scale temporal dynamics are also likely important in OB processing: even within a single respiratory cycle, odorant-evoked postsynaptic activity shows latency and rise-time differences in different glomeruli (Spors and Grinvald 2002) and mitral/tufted cells (M/T cells; the principal OB projection neurons) show distinct temporal sequences of excitation and inhibition for different odorants and odorant intensities (Bathellier et al. 2008; Buonviso et al. 1992; Chaput et al. 1992; Meredith 1986; Wellis et al. 1989). In addition, synaptic interactions thought to be important in shaping odor representations—for example, dendrodendritic inhibition between mitral and granule cells—depend on the kinetics of sensory input to the OB (Arevian et al. 2008; Balu et al. 2004; Schoppa 2006a; Young and Wilson 1999). Finally, neurons in piriform cortex, a major target of M/T cells, show fine-scale temporal patterning that is likely shaped by the dynamics of ORN input (Rennaker et al. 2007).
Despite the importance of sensory input dynamics in odor coding and postsynaptic processing, little is known about the temporal structure of ORN input to the OB during natural sampling of odorants in the behaving animal. To date, the only recordings of odorant-evoked action potential firing in mammalian ORNs in vivo have used step pulses of odorant applied directly to the OE (Duchamp-Viret et al. 1999, 2000), revealing little about their natural response dynamics. In a series of recent studies we have used calcium imaging from the presynaptic terminals of ORNs to characterize sensory input to the OB during both natural and artificial odorant inhalation (Pírez and Wachowiak 2008; Spors et al. 2006; Verhagen et al. 2007; Wachowiak and Cohen 2001; Wesson et al. 2008a). The presynaptic calcium signals reflect action potential firing across the population of ORNs converging onto a glomerulus, as well as modulation of calcium influx into the axon terminal by presynaptic inhibition (Wachowiak and Cohen 1999; Wachowiak et al. 2005). These studies have revealed that ORN inputs are strongly shaped by the respiratory cycle and, even within a single inhalation-evoked response, show diverse temporal dynamics. These dynamics are not shaped by feedback presynaptic inhibition onto the ORN terminal (Pírez and Wachowiak 2008) and so primarily reflect complexity in the temporal patterns of odorant-evoked activation of ORNs. We also recently demonstrated that, in the awake rat, the strength and temporal structure of ORN inputs to the OB are dramatically altered during high-frequency sniffing of odorant (Verhagen et al. 2007). Here, we extend that study to provide a detailed characterization of the temporal structure of ORN inputs to the OB in the awake rat as it breathes naturally and expresses odor-guided behavior. We show that, during natural odor sampling, each inhalation evokes a volley of action potentials in ORNs whose activity envelope roughly matches that of odorant-evoked excitatory postsynaptic potentials (EPSPs) recorded from M/T cells in vivo (Cang and Isaacson 2003; Margrie and Schaefer 2003); a significant fraction of glomeruli receive inhalation-evoked ORN inputs even in the absence of odorant. We also find that ORN inputs to individual glomeruli can be activated with distinct dynamics in an odorant-specific manner. Finally, we report that the coherence between the respiratory cycle and the dynamics of ORN input is greatly diminished during high-frequency sniffing, suggesting that the nature of postsynaptic processing in the OB may change qualitatively as a function of odorant-sampling strategy.
METHODS
Data were acquired from seven adult female Long–Evans rats. Different analyses of data from a subset of these animals have been published in three other studies (Verhagen et al. 2007; Wesson et al. 2008a, 2009). Detailed descriptions of the surgical, behavioral, and recording procedures can be found in those studies.
Head-fixed behavioral paradigm
Naïve animals were outfitted with a head bolt for restraint (Katz et al. 2001) and an intranasal cannula for chronic measurement of respiration in a single surgical procedure. Behavioral training began 1–2 wk after surgery, during which rats were shaped to perform a lick/no-lick odor discrimination task (Verhagen et al. 2007). The purpose of the discrimination paradigm was not to test perceptual ability, but mainly to ensure that the rat was attending to the stimulus and to minimize changes in behavioral state and stimulus context during data collection. In the final paradigm, odorants were presented for 4–5.5 s with an intertrial interval varying randomly from 15 to 24 s. In three of seven rats, a 1-s tone preceded odorant presentation by 2 s. During the imaging experiments reported here, rats were used in a single daily session consisting of 50–140 trials (lasting 30–60 min). Rats were well trained in discriminating most of the odorants presented. However, novel odorants or different concentrations of the same odorant were occasionally presented during an imaging session; in all cases the novel stimulus was presented as an unconditioned stimulus (CS−). Licking in response to a novel odorant occurred in about 20% of trials; rats were not rewarded for licking to the novel odorant.
Odorants were monomolecular hydrocarbon compounds known to reliably evoke ORN input to dorsal OB glomeruli (Bozza et al. 2004; Wachowiak and Cohen 2001). For some experiments, a four-component odorant mixture was used that contained benzaldehyde, eugenol, butyraldehyde, and ethyl butyrate (at a ratio of 2:10:1:1 to account for vapor pressure differences). The mixture was used to evoke input to a larger number of dorsal OB glomeruli; prior work has found little significant mixture interactions at the level of ORN input to glomeruli, although mixture suppression may occur at the level of ORN spike generation (McGann et al. 2005; Pírez and Wachowiak 2008; Rospars et al. 2008; Tabor et al. 2004). Odorants were presented using a computer-controlled flow-dilution olfactometer that allowed precise control of odorant concentration, identity, and onset timing (Verhagen et al. 2007). Concentrations are reported as percentage dilution of saturated vapor (s.v.), and ranged from 0.5 to 5% (1% s.v. was typical). Total flow rate of air presented to the animal was 0.5–2 L/min.
Optical recordings
ORNs were loaded with calcium-sensitive dye and optical signals imaged from the dorsal OB of awake, head-fixed rats as described previously (Verhagen et al. 2007; Wachowiak and Cohen 2001). Briefly, for ORN loading, rats were anesthetized with ketamine/xylazine (56/6 mg/kg, administered intraperitoneally) and placed on their back with the dorsum of the nose angled at 60° from horizontal; an infusion canula was inserted 17 mm into one naris. A solution (25–40 μl) containing the dye (3% wt/vol) and 0.2% Triton X-100 (ICN Biomedicals, Aurora, OH) was then infused into the naris and left for 10 min. The animal was then placed on its front for 5 min before repeating the procedure for the other naris.
Imaging was performed through an optical window consisting of thinned bone sealed with ethyl-2-cyanoacrylate glue. Optical signals were recorded in select trials over one to five behavioral sessions. Signals were collected using an Olympus epifluorescence illumination turret (BX51) and full light from a 150-W xenon arc lamp (Opti-Quip) and appropriate filter sets (Verhagen et al. 2007). The imaged area covered a region of about 3 mm (anterior–posterior) × 1.5 mm (medial–lateral) over one OB. Images were acquired using a 256 × 256 pixel CCD and digitized at 25 Hz along with respiration and behavioral (licking) signals using an integrated hardware/software package (NeuroCCD SM-256 and NeuroPlex, RedShirtImaging LLC).
Optical signals evoked by electrical stimulation of the olfactory nerve were recorded in three urethane-anesthetized rats, delivered as described previously (Pírez and Wachowiak 2008; Verhagen et al. 2007). The bone and dura overlying the dorsal OB were removed and a concentric bipolar electrode (outer pole: 125 μm SS; inner pole: 25 μm Pt/Ir; FHC, Bowdoinham, ME) was placed in the anterior–medial region of the OB. Brief (100 μs) constant current stimuli were delivered through a linear stimulus isolator unit (Neurolog System, NL800A, Digitimer). Stimulus trains consisting of pulses of varying amplitude were generated using custom software written in LabVIEW and sent to the stimulus isolator via an analog voltage output device (PCI-6722; National Instruments, Austin, TX). At least four trials were averaged for each stimulus protocol.
Data analysis
Respiration was measured using a chronic intranasal cannula attached to a pressure sensor (Honeywell, model #24PCAFA6G). The opening of the cannula was fixed in the dorsal recess of the naris on one side of the animal. Intranasal pressure signals were high-pass filtered at 1 kHz, digitized, and saved to disk at 100–500 Hz. Pressure decreases are displayed as positive voltages. The beginning of each inhalation was identified using a custom algorithm that involved filtering (second-order Butterworth, 1–25 Hz) and integrating the raw pressure signal, then identifying inflections in the integrated signal that had a slope above an empirically derived threshold (Wesson et al. 2008a). The algorithm was validated using simultaneous recordings of both intranasal pressure and airflow measured with a thermocouple (Verhagen et al. 2007).
Optical signals were processed to remove widespread intrinsic signals and movement artifacts, then regions of interest (ROIs) representing one or a few glomeruli were chosen and signals from each ROI were spatially averaged, as described previously (Verhagen et al. 2007). For most optical data, signals were digitized at 25 Hz and upsampled to 100 Hz for analysis using the “resample” function in Matlab (The MathWorks, Natick, MA). This function effectively interpolates between sampled points, using a polynomial waveform fit to the 10 samples around each time point, and generates an interpolation that is close to the Nyquist-limited ideal. Thus the temporal precision of these measurements was 10 ms but included temporal frequencies only <12.5 Hz. For some data, optical signals were recorded at a frame rate of 50 or 100 Hz; these data yielded quantitatively similar results to the data sampled at lower frequency (Verhagen et al. 2007). Optical data acquired during electrical stimulation experiments were sampled at 100 Hz. Temporal deconvolution of optical signals was performed using the algorithm of Yaksi and Friedrich (2006), as previously described (Verhagen et al. 2007). A decay constant of 260 ms (the mean decay time constant of optical signals evoked by a single olfactory nerve shock) was used and signals were low-pass filtered (fourth-order Butterworth) at 15 Hz prior to deconvolution.
Response latency, rise time, and decay measurements were made using a custom algorithm that fit the optical signals to a double-sigmoid function (Wesson et al. 2008a). The goal of this algorithm was to allow objective and robust measurements of response timing and amplitudes. The algorithm is described in detail in Wesson et al. (2008a). The general process was to first denoise the optical signal with a combination of band-pass filtering (second-order Butterworth, 0.4 to 8 Hz) and wavelet decomposition-based denoising (fourth-order Daubechies wavelet decomposition), then to define the onset time (latency) of a response based on the time of the peak in the product of the first and second derivatives of the optical signal, which corresponds to a strong upward inflection in the signal waveform. Starting at this time, the denoised optical signal was fit, first to a sigmoid rise and (when possible) a sigmoid fall; rise times and response amplitudes were defined by the kinetics and peak of this fitted function. Some responses failed to yield full fits, generally because the response was “interrupted” by the next response in that glomerulus. When this occurred, the responses were not included in the data set; thus the number of measurements for onset times, rise times, and durations could differ. A signal-to-noise ratio measure, defined as the fitted peak amplitude divided by the “noise,” was used to identify significantly responsive ROIs (Wesson et al. 2008a). Here, noise was defined as the SD of the peak response amplitude evoked by all inhalations made during periods preceding odorant presentations.
To compare optical signals elicited by patterns of electrical stimulation with those elicited by odorant inhalation in awake animals, an average odorant-evoked response was calculated. This analysis excluded glomeruli that showed large responses to inhalation alone and excluded all responses to inhalations with intersniff intervals <400 ms. Individual traces were normalized to their maximum values and temporally aligned to their response onset times before averaging. For each electrical stimulation protocol, the average response of each glomerulus was compared with the odorant-evoked average by calculating the mean squared error (m.s.e.) between the two traces over the first 200 ms after response onset. Each stimulation-evoked response was scaled to minimize the difference between the waveforms; thus m.s.e. values reported are comparable and independent of variation in response amplitude. To measure the variance in responses across different glomeruli and odorants, the average inhalation response for each glomerulus/odorant pair was calculated and each of these traces was compared with the overall average using the m.s.e.
Coherence between respiration and the presynaptic calcium signal was measured by first replacing each respiratory cycle in the presence of odorant with an identical, simplified waveform representing an average “sniff.” The simplified waveform was made by averaging the first inhalation of each trial (n = 837; same as Fig. 1C) over a time window 250 ms from the start of each inhalation (defined as above) and then rectifying this average waveform. A simplified “sniff trace” was then constructed by convolving the waveform with an event raster marking the time of each inhalation. Thus the coherence analysis effectively measured the coupling between inhalation timing and presynaptic calcium signals rather than respiration waveform.
FIG. 1.

Sensory input to olfactory bulb (OB) glomeruli is tightly coupled to respiration. A, left: resting fluorescence from the dorsal OB of an awake rat in which olfactory receptor neurons (ORNs) were loaded with calcium-sensitive dye. Right: “sniff-triggered average” map of inhalation-evoked fluorescence changes evoked by inhalation of the odorant 2-hexanone. The map is the average of 37 “sniffs” in 10 trials. Scale bar: 500 μm. B, left: respiration (“sniff,” red trace) and ORN presynaptic calcium signals (black traces) from the 10 glomeruli shown in A during a presentation of 2-hexanone. In most glomeruli, signal activation is linked to respiration and increases in the presence of the odorant. Some glomeruli show responses before odorant presentation. Vertical lines indicate the onset time of each inhalation. Right: same data but with the calcium signals temporally deconvolved to give estimated temporal patterns of action potential firing during the trial (see methods). C, left: average calcium signal waveform (left) evoked by odorant inhalation. Black trace shows the mean of all responses evoked by the first sniff after odorant presentation began, averaged across all trials regardless of odorant and glomerulus (data were included only if there was a minimum of 400 ms between the first and second sniffs: n = 837 trials, 5,776 sniff responses). Responses were normalized to their peak amplitude and aligned to the start of inhalation before averaging. Gray area indicates the SD of the mean response waveform. Red trace shows the average sniff waveform. Right: average deconvolved waveform, using the same data set.
All analyses were performed using custom software written in Matlab or LabVIEW. Statistical tests were performed with Matlab.
RESULTS
Odorant-evoked receptor inputs to the olfactory bulb of awake rats
We used calcium-sensitive dyes to image ORN input to glomeruli of the dorsal OB in awake, head-fixed rats while they performed a simple odor discrimination task. This preparation has been described previously (Verhagen et al. 2007). As noted previously, respiratory behavior was typical of unrestrained, quiescent rats in a familiar environment (Walker et al. 1997), occurring mostly within 1.5–2 Hz with occasional pauses and bouts of high-frequency sniffing. As we previously reported, rats typically (i.e., in most trials) showed little or no change in respiration frequency at the time of odorant onset, such that the mean frequency increase across all trials was <1 Hz (Verhagen et al. 2007; Wesson et al. 2009). For the three rats in which a tone preceded odorant onset, the tone evoked similar slight (<1-Hz) increases in respiration frequency; we did not observe any difference in performance accuracy or inhalation-evoked optical signals when the tone preceded odorant presentation (not shown, but see Supplementary Fig. 3 of Verhagen et al. 2007; Wesson et al. 2009).
Odorant-evoked presynaptic calcium signals in awake rats had peak signal amplitudes of 2–10% ΔF/F and appeared as odorant-specific patterns of discrete foci corresponding to single glomeruli and, possibly in some cases, groups of several adjacent glomeruli that were not easily resolved (Fig. 1A). Although the basic characteristics of these signals have already been described (Verhagen et al. 2007), here we focus on the detailed temporal structure of ORN inputs to the OB, with a particular emphasis on the potential for these dynamics to shape odor information processing in the awake rat.
Our initial analysis focused on the temporal structure of ORN inputs during low-frequency (1- to 3-Hz) respiration; in our head-fixed paradigm such respiration patterns are expressed during discrimination of familiar odorants. The example traces in Fig. 1 illustrate the most prominent features of ORN inputs driven by resting-level respiration in the awake animal. First, ORN input to most (but not all) glomeruli is tightly coupled to respiration. Temporal deconvolution of these calcium signals (see methods) to estimate patterns of action potential firing (Verhagen et al. 2007; Yaksi and Friedrich 2006) suggests that, during 1- to 3-Hz respiration, each inhalation-driven calcium transient in the presence of odorant reflects a burst of firing across the population of ORNs that lasts 100–200 ms. Second, there is variability in temporal response patterns across glomeruli, with some glomeruli (e.g., glomeruli 9 and 10, Fig. 1B) showing more tonic responses during odorant presentation, with little or no modulation by individual inhalations. Close inspection reveals that the onset latency, rise time, and time to peak of the inhalation-evoked input varies somewhat across glomeruli. Third, as we have previously reported (Verhagen et al. 2007), most glomeruli show little response adaptation for subsequent odorant inhalations, at least at respiration frequencies <2.5 Hz. Fourth, input to some glomeruli occurs after each inhalation even in the absence of odorant (i.e., prior to odorant presentation). Finally, inhalation-evoked responses disappear or return to preodorant levels even in the first inhalation after odorant presentation ends (e.g., glomeruli 4–8, Fig. 1), suggesting that odorant is cleared from the nasal cavity within one breathing cycle.
Figure 1C shows the mean response evoked by the first inhalation of odorant, averaged across all trials, glomeruli, and odorants (n = 5,776 responses, 837 trials, 7 animals). We used only the first inhalation after odorant presentation for this calculation to eliminate confounds from decaying responses evoked by preceding inhalations of odorant. To avoid confounds from delays in odorant onset kinetics and from responses driven by inhalations beginning just prior to odorant onset, we eliminated all trials in which the first inhalation occurred within 30 ms of odorant onset (Wesson et al. 2008a). The consistency of this basic response waveform across successive inhalations of odorant is addressed in later analyses. The variance (SD) in this initial response waveform is relatively small and does not increase in size relative to the baseline variance, indicating that the response to the first inhalation of an odorant is relatively stereotyped. Estimates of ORN firing by deconvolution were similarly stereotyped (Fig. 1C, right) and had a half-width of 110 ± 29 (mean ± SD) ms. Thus each initial inhalation of odorant evokes a burst of ORN input to a glomerulus lasting 100–200 ms (Fig. 1, C and E).
Odorant- versus inhalation-driven ORN inputs to glomeruli
Respiratory patterning of postsynaptic neurons in the olfactory bulb (e.g., M/T cells) can occur even in the absence of odorant stimulation (Adrian 1942; Chaput et al. 1992; Macrides and Chorover 1972; Rinberg et al. 2006a); whether this patterning is driven by input from ORNs remains an open question (Grosmaitre et al. 2007; Khan et al. 2008; Sobel and Tank 1993). We addressed this question by analyzing respiration-linked presynaptic calcium signals occurring prior to odorant presentation. As shown in the example in Fig. 1, “odorant-free” inhalations (i.e., before odorant presentation) drive ORN inputs to at least some dorsal OB glomeruli (e.g., glomeruli 1, 2, 3, and 7). Inhalation-driven responses were observed even when charcoal-filtered air was blown over the nose during this time period. We evaluated the strength and extent of such responses in all dorsal glomeruli by generating “sniff-triggered average” waveforms using the preodor time period for all trials in a session (one session in each of 7 animals) and for each glomerulus identified as responding to any tested odorant (see methods). This method allowed for averaging of optical signals across many “odorant-free” inhalations per glomerulus (range: 100–231 inhalations), maximizing the ability to detect even small responses. As a control, we also generated average waveforms using an equal number of samples taken at random times (i.e., not inhalation triggered) during the preodor period. A glomerulus was counted as showing a response to odorant-free inhalation if its sniff-triggered average waveform had a peak value that was fourfold greater than the SD of the control trace (Fig. 2A). Using this significance cutoff, we found that 50% of all glomeruli showed significant odorant-free responses; a greater fraction of glomeruli appear responsive to inhalation using a less conservative cutoff (Fig. 2B).
FIG. 2.
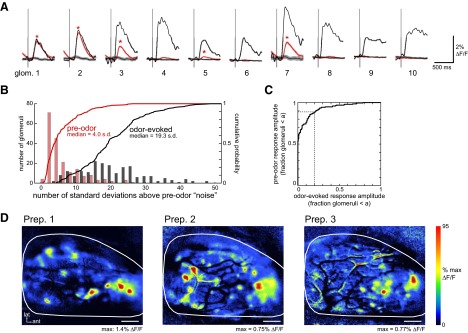
ORN input to some glomeruli is driven by inhalation even in the absence of odorant. A: comparison of sniff-evoked optical signals before (red) and during (black) odorant presentation for the 10 glomeruli shown in Fig. 1. Single black traces show responses to the first inhalation of 2-hexanone (same data as in Fig. 1B). Red traces show sniff-triggered average signals for all sniffs occurring before odorant presentation in all trials in that session (n = 35 trials, 128 sniffs). Also shown are “randomly triggered” average traces made by random selection of signal epochs during the preodor phase (see results). Shaded areas indicate SEs of the average traces. Asterisks (*) indicate glomeruli for which the sniff-triggered response was significantly greater than the randomly triggered control (see results). B: histogram and cumulative probability distributions of sniff-triggered response amplitudes of glomeruli before (red) and during (black) odorant presentation. Odorant-evoked response amplitudes were averaged across all sniffs for each odorant and only the greatest response (i.e., the most effective odorant) was used for that glomerulus. Amplitudes are expressed relative to the SD of the randomly triggered control for that glomerulus. Only data from the 3 animals with the highest number of tested odorants were included (n = 194 trials). Histogram bin size: 2 SD. C: receiver-operating characteristic curve comparing the distributions of responses (taken from B) evoked before (ordinate) and during (abscissa) odorant presentation. Each axis is the fraction of all glomeruli with responses below a particular amplitude cutoff, “a.” The dotted lines compare the distributions at an arbitrarily chosen cutoff value of 0.25 of all odorant-evoked response amplitudes, showing that roughly 90% of glomeruli show preodorant responses smaller than this value. D: location of inhalation-activated glomeruli in 3 different animals. Sniff-triggered maps were generated from all sniffs taken before odorant presentation. In each preparation, a cluster of glomeruli in the anterior–medial dorsal OB was most strongly activated by inhalation, although there were glomeruli throughout the dorsal OB that also responded strongly.
The amplitude of odorant-free responses varied strongly across glomeruli, with responses in most glomeruli being much smaller than the amplitude of odorant-evoked inputs to the same glomerulus (Fig. 2, A and B). However, in each preparation, a few glomeruli showed strong odorant-free responses that were similar in amplitude to those of odorant-evoked responses (odorant-evoked response amplitudes were measured from all inhalations in the presence of odorant). A comparison of odorant-free and odorant-evoked response amplitude distributions is shown in the receiver-operating characteristic plot in Fig. 2C. This plot shows, for example, that roughly 10% of glomeruli showed odorant-free responses that were above the 20th percentile of odorant-evoked response amplitudes. Thus certain glomeruli appear to be much more strongly driven by odorant-free inhalation than others. We asked where on the dorsal OB the most strongly inhalation-driven glomeruli were activated by making maps of the preodor sniff-triggered average waveform. Examples from three preparations are shown in Fig. 2D. Odorant-free inhalation-driven glomeruli were distributed across the dorsal OB, although in every preparation (n = 7), the most strongly activated included several glomeruli in the same region of the anterior–medial dorsal OB (Fig. 2D). Thus whereas weak inhalation-driven ORN input appears to occur for many—and perhaps most—glomeruli in the absence of odorant stimulation, strong inhalation-driven input occurs for a few specific glomeruli.
Odorant- and glomerulus-specific dynamics of ORN input to glomeruli
Earlier work in anesthetized rodents has shown that the temporal dynamics of ORN inputs to glomeruli vary in a glomerulus- and odorant-specific manner (Spors et al. 2006). We observed similar variation in the dynamics of ORN inputs in awake rats, with inhalation-evoked calcium signals varying in latency, rise time, and duration, both for different glomeruli and for input evoked to the same glomerulus by different odorants. An example of this diversity is shown in Fig. 3, in which responses for six glomeruli to three different odorants are shown. Four of these glomeruli are activated by all three odorants, whereas the remaining two glomeruli are activated by two of the odorants. Qualitative differences in the waveform evoked by each inhalation are clear (compare, for example, responses of glomeruli 2 and 5 to benzaldehyde and responses of glomerulus 1 to methyl valerate and ethyl butyrate in Fig. 3B). These differences appeared consistently across successive inhalations, as revealed by sniff-triggered averaging of each response in the presence of odorant (Fig. 3C). The relative latency and fine-scale temporal structure do not appear to be determined by location on the dorsal OB surface; nearby glomeruli could show distinct response latencies and rise times (compare responses of glomeruli 3 and 4 to ethyl butyrate, Fig. 3), whereas distant glomeruli could show similar temporal response patterns.
FIG. 3.

Temporal dynamics of ORN inputs differ across glomeruli and between odorants. A: sniff-triggered average response maps for 3 different odorants eliciting input to different but overlapping ensembles of dorsal OB glomeruli. Scale bar: 500 μm. B: traces showing optical signals in 6 glomeruli (locations shown in A) for one trial for each of the 3 odorants. The inset in the ethyl butyrate trial shows an expansion of the gray shaded area, showing consistent response dynamics repeated with successive sniffs of odorant. C: sniff-triggered average traces for the 6 glomeruli for each odorant, showing that odorant- and glomerulus-specific response dynamics are consistently evoked across sniffs. Shaded areas indicate SE of each averaged trace. Vertical line indicates the start of inhalation to which each response was aligned prior to averaging.
To quantify the variance in the temporal dynamics of ORN inputs, we measured several parameters of the odorant-evoked calcium signal: response latency, rise time, and duration. Response latency (Fig. 4A) was measured from the time of onset of the first inhalation in the presence of odorant to the time of onset of the calcium signal (defined using a custom algorithm; see methods and Wesson et al. 2008a). Rise time was defined as the time from 10 to 90% of the peak response amplitude (Fig. 4B) and duration was defined as the time over which the response was >50% of peak amplitude (Fig. 4C). Peak amplitudes, rise times, and durations were determined by fitting responses to a double-sigmoid function (see methods), as described previously (Wesson et al. 2008a). Measurements were made for all responsive glomeruli and for all inhalations occurring at an intersniff interval of >400 ms (<2.5 Hz). We also excluded all glomeruli showing large responses to inhalation alone (defined as >10-fold the SD of the baseline signal). For this data set, mean response latency was 154 ± 59 (SD) ms (n = 18,865 responses, 7 rats), rise time was 91 ± 40 ms (n = 18,865 responses), and duration was 392 ± 149 ms (n = 15,172 responses). We also compiled these measurements as a function of inhalation number within each trial. All three parameters showed roughly similar mean values across successive inhalations, although response duration was slightly longer and response latency slightly shorter for the first inhalation (Table 1). Finally, we compared inhalation-evoked response dynamics across animals, using the five animals with the largest number of trials and responsive glomeruli (Table 2); again, response latency, rise time, and duration all showed similar values in different animals.
FIG. 4.

Summary of ORN input dynamics for all glomeruli and odorants. A: histogram and cumulative probability plot of the latency of the optical signal following an inhalation. In this and other panels, the schematic above each histogram illustrates the parameter measured (arrows), using a sample sniff trace (bold) and sample optical response (thin trace). Parameter measurements are based on only the first sniff after the onset of odorant presentation, pooled across animals, sessions, odorants, trials, and glomeruli. Time bin is 10 ms. B: histogram and cumulative probability plot of the rise time of the optical signal response (t10 to t90 of the peak response amplitude). Time bin is 10 ms. C: histogram and cumulative probability plot of the duration of the optical signal responses (time during which the response is >50% peak amplitude). Time bin is 50 ms. D: histogram and cumulative probability plot of the temporal spread of optical signal responses from all glomeruli in a trial. Temporal spread is the time from the onset of the earliest glomerular response in a trial to the time when all glomeruli have reached 90% of their peak amplitudes. Only trials with ≥5 responsive glomeruli were included. Time bin is 10 ms.
TABLE 1.
Temporal dynamics of inhalation-evoked optical responses across successive inhalations
| Sniff | Duration | Latency | Rise Time | Temporal Spread |
|---|---|---|---|---|
| 1 | 436 ± 158 (1,879) | 139 ± 50 (2,591) | 88 ± 38 (2,591) | 229 ± 72 (194) |
| 2 | 392 ± 150 (2,094) | 152 ± 58 (2,668) | 89 ± 39 (2,668) | 243 ± 70 (189) |
| 3 | 389 ± 146 (2,060) | 155 ± 58 (2,518) | 92 ± 39 (2,518) | 236 ± 68 (187) |
| 4 | 394 ± 156 (1,958) | 159 ± 61 (2,356) | 94 ± 39 (2,356) | 252 ± 76 (168) |
| 5 | 390 ± 145 (1,981) | 158 ± 60 (2,397) | 92 ± 41 (2,397) | 248 ± 73 (173) |
| 6 | 398 ± 373 (1,875) | 158 ± 60 (2,277) | 92 ± 41 (2,277) | 247 ± 72 (172) |
| All | 392 ± 149 (15,172) | 154 ± 59 (18,865) | 91 ± 40 (18,865) | 242 ± 72 (1,382) |
Values are means ± SD. Number in parentheses indicates the number of inhalation-evoked responses for duration, latency, and rise time measurements and the number of inhalations for temporal spread. See text for definitions of temporal parameters.
TABLE 2.
Temporal dynamics of inhalation-evoked optical responses across animals
| Animal ID | Duration | Latency | Rise Time | Temporal Spread |
|---|---|---|---|---|
| Awake | ||||
| rcr10 | 360 ± 123 (1,456) | 177 ± 44 (1,738) | 90 ± 37 (1,738) | 191 ± 64 (120) |
| rcr20 | 361 ± 126 (2,679) | 181 ± 47 (3,306) | 82 ± 37 (3,306) | 224 ± 68 (239) |
| rcr21 | 401 ± 167 (3,631) | 174 ± 50 (4,817) | 93 ± 40 (4,817) | 241 ± 59 (365) |
| rcr36 | 406 ± 156 (4,459) | 122 ± 61 (5,176) | 86 ± 38 (5,176) | 241 ± 76 (374) |
| rcr38 | 402 ± 137 (2,922) | 138 ± 59 (3,791) | 105 ± 43 (3,791) | 282 ± 67 (284) |
| Anesthetized | ||||
| Pooled | 443 ± 119 (596)** | — | 122 ± 32 (675)** | 264 ± 50 (42)* |
Values are means ± SD. Number in parentheses indicates the number of inhalation-evoked responses for duration, latency, and rise time measurements and the number of inhalations for temporal spread. For pooled anesthetized data, n = 2 animals. Response onset time was not calculated for anesthetized animals due to differences in the respiration waveform between anesthetized and awake animals. See text for definitions of temporal parameters. Asterisks indicate statistical difference (t-test) between pooled anesthetized and awake measurements:
P < 0.001,
P < 0.05.
We next evaluated the diversity of these parameters first among individual glomeruli, then for individual glomeruli in the presence of different odorants. For each odorant in each imaging session, we selected the five glomeruli that responded most strongly (averaged across multiple inhalations), measured the latency and rise time of all inhalation-evoked responses (there were about 4–8 inhalations per trial), and performed a two-way ANOVA for each measured parameter to test for a significant effect of glomerulus identity on both latency and rise time, using a significance cutoff of P < 0.01. For all three odorants shown in Fig. 3, glomerulus identity had a highly significant effect (P < 10−4) on both latency and rise time. Overall, 29/35 odorant groups (82.9%) showed a significant effect of glomerulus identity on latency and 27/35 (77.1%) showed a significant effect of glomerulus identity on rise time (grouped by odorant and imaging session; n = 35 groups from five animals, 10–69 inhalations/group). Thus the dynamics of ORN input to the OB differ across glomeruli but remain reliable across successive inhalations. Similarly, we evaluated the effect of odorant on response onset and rise times for each glomerulus. For this analysis, we selected 60 glomeruli (from 10 imaging sessions in four animals) that responded to at least three odorants (≥10 inhalations/odorant, >400 ms ISI) and performed a separate two-way ANOVA for each of the latency and rise time parameters. Overall, odorant had significant (P < 0.01) effect on onset latency in 36% of glomeruli and on rise time in 33%.
We also measured the temporal spread over which ORN inputs occur following an inhalation, defined as the time from the onset of the earliest-responding glomerulus to the time to 90% of peak for the latest-responding glomerulus in the same trial (Fig. 4D). This value was calculated for each trial and included only trials in which at least five glomeruli were activated by an odorant. The temporal spread of ORN inputs had a mean of 242 ± 72 ms (n = 1,382 inhalations, 194 trials). Thus glomerular response maps evolve for about 200 ms after each inhalation; this time may be important for defining temporal windows for postsynaptic integration during natural odorant sampling.
Finally, we compared response dynamics with those from urethane-anesthetized, freely breathing rats. We measured rise time, duration, and temporal spread in two rats (26 glomeruli; we did not compare onset latencies due to differences in respiration waveform in anesthetized and awake animals). Inhalation-evoked response waveforms were qualitatively similar (not shown), although rise time, duration, and temporal spread of responses were all slightly but significantly longer in anesthetized rats (P < 0.05, unpaired t-test; see Table 2).
Temporal structure of ORN inputs evoked by inhalation
Understanding the temporal structure of action potentials arriving at the ORN axon terminals in a glomerulus is important for understanding postsynaptic information processing in the olfactory bulb. For example, a number of recent studies in OB slice preparations have revealed novel network phenomena that emerge during patterned electrical stimulation of ORN axons designed to mimic natural respiration (Balu et al. 2004; Hayar et al. 2004; Schoppa 2006b; Schoppa and Westbrook 2001). These studies have used either single olfactory nerve (ON) shocks or brief, 30-ms-long trains of isointensity ON shocks to mimic input evoked by a single “sniff.” However, our deconvolution estimates of the envelope of action potential firing (Fig. 1C) suggested that an inhalation evokes a volley of ORN input lasting significantly longer (100–200 ms). We thus performed a series of experiments in which we imaged presynaptic calcium signals evoked by patterned electrical stimulation of ORN axons in the anesthetized rat and compared these responses to those evoked by odorant inhalation. The purpose of these experiments was twofold: 1) to test the accuracy with which commonly used electrical stimulus paradigms mimic inhalation-driven ORN input dynamics and 2) to verify the prediction from the deconvolution estimates that inhalation-driven inputs are spread over a relatively long (100–200 ms) time window.
We tested several different ON shock patterns (Fig. 5A) and compared response waveforms of the shock-evoked signal with those of the mean inhalation-evoked signal shown in Fig. 1C. We focused in particular on the first 200 ms of each response because this time window appears to be critical for odor identification (Abraham et al. 2004; Rinberg et al. 2006b; Uchida and Mainen 2003; Wesson et al. 2008a) and because initial input dynamics are likely the most important determinant of postsynaptic activity patterns. Single (0.1-ms) ON shocks elicited calcium signals with an initial rise that was extremely rapid, reaching peak amplitude in one to two frames (i.e., <20 ms) after on shock (n = 22 glomeruli, 2 animals). We also used a train of three pulses delivered at 100 Hz because this protocol has been used to mimic naturalistic ORN inputs in several recent studies (Gire and Schoppa 2008; Schoppa 2006b; Schoppa and Westbrook 2001). This protocol elicited responses only slightly slower than those of the single-shock protocol (Fig. 5A, pattern 2), with a time to peak of 20–30 ms (n = 13 glomeruli, 2 animals). We quantitatively compared initial response waveforms by calculating the mean squared error (m.s.e.) between individual response traces and the mean odorant-evoked response (shown in Fig. 5B) over the first 200 ms after response onset (see methods for details). As a measure of variance in response dynamics across different glomeruli, the m.s.e. between the mean odorant-evoked response and that from individual glomerulus–odorant pairs was 0.0061 ± 0.015 (n = 374, 7 animals). Both the single-shock and three-shock response waveforms varied by several orders of magnitude from the mean inhalation-evoked waveform (m.s.e. = 0.157 ± 0.037 for pattern 1; m.s.e. = 0.109 ± 0.021 for pattern 2). Increasing the length of the stimulus train to 28 pulses at 100 Hz (Fig. 5A, pattern 3) evoked presynaptic calcium signals that more closely approximated the inhalation-evoked response but still showed a significantly different initial response waveform (m.s.e. = 0.014 ± 0.004; n = 7 glomeruli, 2 animals; P = 0.0011, unpaired t-test).
FIG. 5.

Temporal dynamics of ORN input evoked by patterned electrical stimulation. A: traces showing the optical signal imaged from one glomerulus after in vivo electrical stimulation of the olfactory nerve (see methods). Each trace shows the response to a different stimulus pattern (indicated below). Stimulus protocols consist of a single ON shock (“1,” purple), a train of 3 pulses at 100 Hz (“2,” green), a train of 28 pulses at 100 Hz (“3,” blue), and a train of 28 pulses but with patterned increases in intensity through the train (“4,” red). The arrow indicates the initiation of stimulation. Signals are averages of multiple (4–8) trials and are unfiltered. All traces are from the same glomerulus and are normalized to the same peak amplitude. B: comparison of the average shock-evoked responses (n for each protocol given in the text; same color coding as in A) with the average inhalation-evoked odorant response in an awake rat (black with gray shaded SD, reproduced from Fig. 1C). All traces are aligned to the initiation of the calcium response following the stimulation (arrow) and normalized to the same peak amplitude. Pattern 4 best replicates the time course of a sniff-evoked odorant response to odorant. See results for additional analysis.
The deconvolution estimates of inhalation-evoked responses suggest a more gradual activation of ORNs over the course of about 100 ms (see Fig. 1C). We attempted to mimic this response by using a train of pulses delivered at different current intensities, with the goal of recruiting new subsets of ORNs over the course of the train, mimicking the presumed progressive activation of ORNs by odorant flux across the OF. The train consisted of three stages: a low- but constant-intensity phase (3 pulses set to near- or just subthreshold for evoking detectable responses with single shocks), a ramp phase (17 pulses) in which stimulus intensity increased with each pulse, and a final phase of 8 pulses of decreasing intensity (Fig. 5A, pattern 4). The most important feature of this protocol is that the ramp phase spans the range of recruitment of different ORNs innervating a glomerulus. Because we expected that the initial, low-intensity portion of the protocol would likely activate only a few ORNs, we used a protocol that was longer in total duration (280 ms) than our estimates of inhalation-evoked action potential bursts. This protocol was more effective than the simple train of isointensity shocks at eliciting an initial response waveform similar to that evoked by odorant inhalation (Fig. 5B). The m.s.e. between pattern 4–evoked responses and the sniff-evoked response (m.s.e. = 0.0044 ± 0.0019; n = 9 glomeruli, 2 preparations) was an order of magnitude lower than that of the isointensity train and not significantly different from the m.s.e. representing variance in odorant-evoked response profiles (P > 0.05, unpaired t-test). Overall these results agree with the temporal deconvolution estimates in suggesting that odorant inhalation evokes a “slow burst” of ORN firing whose envelope rises and falls over a time window of ≥100 ms. In addition, whereas other stimulus patterns might be even more effective at mimicking inhalation-evoked calcium signals, these results suggest that the dynamics of ORN input are qualitatively different from those evoked by repeated, synchronous activation of ORNs using trains of isointensity nerve shocks.
Effect of odorant intensity on response maps and dynamics
In anesthetized mice, spatial patterns of glomerular input change dramatically as odorant concentration increases, with increasing numbers of glomeruli being activated and large (approximately fivefold) increases in the amplitude of the input signal (Bozza et al. 2004; McGann et al. 2005; Wachowiak and Cohen 2001). Studies visualizing patterns of glomerular activation using 2-deoxyglucose and functional magnetic resonance imaging have reported less dramatic changes (Johnson and Leon 2000; Xu et al. 2000). Thus we asked how odorant concentration shapes the magnitude and spatial pattern of ORN input in awake rats. Figure 6, A and B, shows “sniff-triggered average” maps and example traces of responses to increasing concentrations of the odorant benzaldehyde. In total we tested four odorants (two different animals) at a minimum of three concentrations spanning a range of at least one log unit. All measurements were made from the first inhalation of odorant and taken from trials in which the odorant was not novel and the animal exhibited low-frequency (1- to 3-Hz) respiration. In all, increasing concentration increased the number and spatial distribution of glomeruli receiving odorant-evoked ORN input, a result similar to that seen in anesthetized mice (Bozza et al. 2004; McGann et al. 2005; Wachowiak and Cohen 2001). Increasing concentration also, on average, increased the magnitude of the inhalation-evoked response (Fig. 6C), although the relationship between concentration and magnitude was often nonmonotonic and differed for different glomeruli. Interestingly, moderate changes in concentration of a familiar odorant typically did not evoke the same high-frequency exploratory sniffing as did novel odorants (not shown).
FIG. 6.

Effect of odorant concentration on magnitude and dynamics of ORN inputs. A: sniff-triggered average maps showing the optical response of the same preparation to 4 different concentrations of the odorant benzaldehyde. Maps are scaled to their own peak amplitudes (indicated below each map). Increasing odorant concentration recruits ORN input to new glomeruli with a modest increase in maximal response amplitude. Scale bar: 500 μm. B: respiration (red) and optical signals (black) recorded from the 5 glomeruli indicated in A while presenting 3 different concentrations of benzaldehyde. Glomeruli 1 and 2 are recruited by higher concentrations, glomerulus 3 responses become more reliable, and glomerulus 4 responses appear to increase in duration at higher concentration. The noise in glomerulus 5 is due to its proximity to a blood vessel. C: concentration–response functions plotted for glomeruli in 4 concentration series (2 series in each of 2 animals). Each plot shows the averaged, normalized amplitude of all activated glomeruli in a series. Responses from individual glomeruli were averaged across multiple (2–6, typically 4) trials and normalized to the response at the highest concentration tested, after which responses were averaged across all glomeruli in the series. Amplitude is measured from the first response following odorant onset. Normalized response amplitudes to inhalation alone (“no odor”) are shown at the far left of the x-axis. The benzaldehyde series (blue; n = 17 trials, 5 glomeruli) is the same preparation as from A and B. Other odorants shown are hexanone (red; n = 6 trials, 11 glomeruli); methyl valerate (gray; n = 14 trials, 5 glomeruli); and a 4-component mixture (see methods) (green; n = 14 trials, 13 glomeruli). Note that x-axis units are percentage saturated vapor. D: odorant concentration vs. rise time for signals imaged in response to the same odorant concentration series shown in C. Each plot indicates a different odorant series, with rise times averaged across all glomeruli as in C. Plot colors are the same as in C. Only glomeruli showing responses with a signal-to-noise ratio >4 at all concentrations were included. E: odorant concentration vs. onset latency, averaged and plotted for each concentration series as in D. Both rise time and latencies show modest effects of concentration.
We next asked how odorant intensity affected response dynamics, focusing on the latency and rise time of odorant-evoked responses. Again, we restricted the main analysis to the first inhalation after odorant onset in each trial and to trials in which animals were breathing at frequencies <3 Hz. We included only those glomeruli that responded to all tested concentrations. A particular odorant concentration was presented in multiple trials and the parameter was averaged across trials (two to six trials per measurement). The most consistent effect of increasing odorant concentration was a slight decrease in response latency and rise time (on average, a decrease of about 20–30 ms in both parameters over a 10-fold increase in concentration; Fig. 6, D and E). Thus, compared with the relative increase in response amplitude, the effect of increasing odorant concentration on the initial dynamics of the odorant-evoked response was modest.
Effect of frequency on the temporal structure of ORN inputs
In active rodents, respiration rarely occurs at regular low rates but instead varies across a frequency range of 2 to 10 Hz (Kepecs et al. 2007; Macrides 1975; Verhagen et al. 2007; Welker 1964; Wesson et al. 2008b; Youngentob et al. 1987). We recently reported a strong effect of sniff frequency on the nature of ORN inputs to the OB, but focused in that study on magnitude effects (Verhagen et al. 2007). Here, we focus on the effect of sniff frequency on the temporal structure of ORN inputs, in particular the coupling of inputs to the respiratory cycle. As in our previous study (Verhagen et al. 2007), we used presentations of novel odorants to evoke sustained high-frequency (typically 4- to 7-Hz) investigative sniffing of an odorant and compared responses to those evoked during low-frequency sampling of the same odorants in subsequent trials. We limited this analysis to data from four animals showing responses in the largest number of glomerulus–odorant pairs.
Figure 7A shows an example of optical signals measured from one glomerulus during both low- and high-frequency sampling of the same odorant (ethyl butyrate). Whereas low-frequency sampling evokes inhalation-coupled responses that return rapidly to baseline, high-frequency sniffing (elicited by the first presentation of this odorant earlier in the session; Verhagen et al. 2007) evokes sustained responses that show no clear coupling to respiration. Importantly, the degree to which respiration-locked responses were lost during high-frequency sniffing was odorant specific and was independent of the magnitude of the initial response. Figure 7B shows an example of optical signals imaged from the same glomerulus as that in Fig. 7A, but evoked during both low- and high-frequency sampling of a different odorant (valeric acid). Despite the fact that the initial response to this odorant is as great as that evoked by ethyl butyrate, individual inhalations during the high-frequency bout still elicit clear responses. Thus the loss of respiration-linked responses during high-frequency sniffing is not due to response saturation or an inability of the calcium-sensitive dye to follow high-frequency inputs; instead, this effect appears to reflect odorant-specific differences in the dynamics of ORN activation at different sampling frequencies.
FIG. 7.

Effect of sniff frequency on respiratory patterning of ORN inputs. A: optical signals and respiration (“sniff”) measured during 2 presentations of ethyl butyrate. Right traces show a high-frequency sniffing response to ethyl butyrate (presented for the first time in this case); left traces show response to low-frequency sampling of ethyl butyrate after habituation to the odorant. Gray area indicates region over which coherence with respiration was measured and includes the time of odorant presentation after the second inhalation of odorant. Bold gray trace shows the simplified sniff waveform used in the coherence measurements (see results). B: optical signals and respiration during 2 presentations of a different odorant (valeric acid). The behavioral session and glomerulus imaged is the same as in A. Valeric acid evokes an initial response with a similar amplitude to that evoked by ethyl butyrate, but the response shows less coherence loss during high-frequency sniffing. C and D: power spectra (left plots) and coherence functions for the data shown in A and B. The leftmost plot shows the power spectra of the optical (black) and simplified sniff (gray) waveforms during the low-frequency trial. There are local maxima in both spectra at 1.54 Hz (the mean sniff frequency). The estimated magnitude squared coherence functions between the optical signal and simplified sniff are shown for both low- and high-frequency trials. Points indicate the coherence value at the mean sniff respiration for each trial. Coherence peaks are near this frequency in all cases. E: scatterplot of coherence values for high- vs. low-frequency sniffing of the same odorant/glomerulus pair (n = 109 pairs). Coherence values were obtained from a single high-frequency trial and averaged across multiple low-frequency trials. Symbols correspond to the values obtained in the examples of A and B. F: change in coherence from low- to high-frequency sniffing trials plotted as a function of initial response amplitude (measured during low-frequency sniffing), using the same data as in E. Response amplitude is normalized to the maximal response observed in that glomerulus to any odorant, which reflects the intrinsic dynamic range of that glomerulus. There is no clear relationship. G: change in coherence as a function of response duration, using a subset (n = 83 pairs) of the data in E and F. There is no clear relationship.
To quantify the coupling between presynaptic calcium signals and the respiratory cycle, we measured the coherence between the optical and respiratory signals. The coherence function is a continuous function that indicates the correlation between these two signals as a function of frequency. In this analysis we were concerned with the relationship between ORN responses and the occurrence of an inhalation rather than its waveform. To avoid confounds in the coherence measurement caused by variation in sniff waveforms, we constructed simplified “sniff traces” consisting of the same waveform representing an average “sniff” repeated at the time of each inhalation in the raw intranasal pressure signal (see methods for details). The relationship between the measured pressure signal and the simplified sniff trace is shown graphically in Fig. 7, A and B. For trials in which rats showed only low-frequency respiration (defined as all inhalations occurring at a minimum interval of 400 ms, or <2.5 Hz), a coherence function was calculated using the period from the second inhalation after odorant onset to the last one before the end of odorant presentation (using the second inhalation avoided confounds caused by the initial response to odorant, which is independent of frequency). For trials showing high-frequency sniffing (defined as 9 sniffs per 2-s time window, or 4-Hz average frequency), coherence was calculated from the second sniff after odorant onset to either the end of the high-frequency sniff bout or the end of odorant presentation, whichever came first. We defined the degree of coupling between the respiratory cycle and optical signals as the value of the coherence function at the mean respiration frequency in a given trial. As expected, mean respiration frequency had a corresponding peak in the power spectrum of the simplified trace and, for low-frequency trials, the optical signal trace (Fig. 7C) (other peaks in the power spectra reflect high-frequency components of the sniff and optical signal waveforms). The coherence function also showed a peak at or near the mean respiration frequency, for both low- and high-frequency trials (Fig. 7, C and D).
We measured coherence with respiration in this way using trials from four sessions (24 high-frequency sniffing trials, 380 low-frequency trials, 4 animals) and including all glomeruli showing an initial odorant-evoked response having a signal-to-noise ratio >4 (measured from the first odorant-evoked response during low-frequency respiration and calculated as described in methods). On average, the coherence between respiration and the presynaptic calcium signal was higher for low-frequency trials (0.53 ± 0.23, n = 2,755) than that for high-frequency trials (0.31 ± 0.22, n = 140; P < 1 × 10⁻²⁷, unpaired t-test). Comparing mean coherence for low- versus high-frequency sampling of the same odorant in the same glomerulus (Fig. 7E) revealed that nearly all glomeruli showed frequency-dependent decreases in coherence (P < 2×10⁻¹⁹, paired t-test, n = 109). The magnitude of this effect varied, however, across glomeruli and odorants, as already described for the glomerulus shown in Fig. 7A. Overall, there was no significant relationship between the decrement in coherence with respiration and the magnitude of the response evoked by low-frequency sampling of the odorant (Fig. 7F; Pearson's linear correlation coefficient r = −0.076, P = 0.43, n = 109, testing nonzero correlation), nor was there a significant relationship between the change in coherence and average response duration for a given glomerulus and odorant (Fig. 7G; r = −0.154, P = 0.17, n = 83). Thus loss of respiratory patterning of ORN inputs is a robust phenomenon, but one that shows stimulus- and glomerulus-specific variations in magnitude.
DISCUSSION
Here, we have characterized in detail the nature of sensory input to the olfactory bulb of awake rats during natural odor sampling, with a particular focus on the temporal structure of this input. These results, together with our earlier reports of ORN inputs in the awake rat (Verhagen et al. 2007; Wesson et al. 2008a), constitute the first description of how mammalian olfactory sensory neurons represent odorant information during natural respiration. Previous studies have characterized ORN response properties in vivo by continuously applying odorant to the OE (Duchamp-Viret et al. 1999, 2000) or by measuring electroolfactogram OE signals (which reflect summed receptor potentials from ORNs) from the awake or anesthetized animals (Chaput 2000; Chaput and Chalansonnet 1997). The most elementary results of this study are 1) that ORN inputs to the OB are strongly patterned by respiration; 2) that inhalation even in the absence of odorant evokes significant input to many OB glomeruli; 3) that these inputs are temporally diverse, with odorants evoking different temporal patterns of input to different glomeruli and maps of glomerular activation evolving over time; and 4) that changes in odorant sampling behavior can qualitatively change the temporal structure of ORN responses.
These results largely agree with those obtained from anesthetized mice during free respiration and artificial inhalation (Spors et al. 2006). In particular, odorant-evoked presynaptic calcium signals in anesthetized mice are tightly coupled to inhalation, show glomerulus- and odorant-specific temporal dynamics over a range of about 200 ms, and show a loss of temporal patterning at high (>4-Hz) artificial inhalation frequencies (Spors et al. 2006). One difference, however, is the appearance of ORN inputs driven by inhalation alone; we have consistently failed to observe inhalation-driven calcium signals in anesthetized mice, whether freely breathing or using artificial inhalation (Pírez and Wachowiak 2008; Spors et al. 2006; Wachowiak and Cohen 2001). Nonetheless, experiments in both awake rats and anesthetized mice indicate that primary sensory input to the olfactory system is temporally complex and that this complexity is shaped both by intrinsic (e.g., odorant-receptor interactions) and by extrinsic factors (e.g., respiration).
Extrinsic (respiration-driven) determinants of ORN input dynamics
The fact that ORN activation is strongly coupled to the respiratory cycle is itself not surprising. Indeed, at least in rodents, inhalation is required for odorant molecules to reach the OE and activate ORNs (Wesson et al. 2008a) and EOG signals in freely breathing rats are—like the presynaptic calcium signals imaged here—phasic and strongly coupled to respiration (Chaput 2000; Chaput and Chalansonnet 1997). Strong respiratory patterning of ORN input is also consistent with the fact that OB projection neurons (M/T cells) often show spiking patterns that are coupled to respiration (Bathellier et al. 2008; Chaput et al. 1992; Khan et al. 2008; Macrides and Chorover 1972; Sobel and Tank 1993). Several features of the inhalation-driven signals measured here, however, are not only surprising but also relevant for understanding information processing dynamics in the olfactory system.
First, inhalation-evoked bursts of ORN input develop over a relatively long time window. The rise time (t10–t90) of the inhalation-evoked calcium signal—although variable (discussed in the following text)—was about 85 ms; this value is similar to the rise time of odorant-evoked EPSPs in M/T cells of anesthetized, freely breathing rats (Cang and Isaacson 2003; Margrie and Schaefer 2003). We could not reproduce the inhalation-evoked calcium signal waveform using simple trains of isointense electrical stimuli; instead, it was necessary to use ramps of increasing stimulus intensity during the train. Such a stimulus pattern presumably recruits new subpopulations of afferents over the course of the train. This outcome suggests that odorant inhalation evokes a progressive recruitment of activation of ORNs over a time window of at least 80–100 ms. This time window may be even longer, as suggested by the fact that the patterned stimulus train effective at evoking realistic rise times was 280 ms long, with a phase of increasing stimulus intensities lasting 180 ms (see Fig. 5). Such recruitment kinetics are consistent with odorant reaching ORNs expressing the same receptor in different regions of the OE or having different odorant.
Second, inhalation-evoked bursts of ORN input appear to cease rapidly after inhalation ends. Patterned electrical stimulation having a “decay” phase of only 60 ms after peak stimulus intensities are reached produced response waveforms with decay times similar to those of most inhalation-evoked responses (see Fig. 5). Finally, only about 10% of glomeruli showed response durations >600 ms (see Fig. 4). EOG recordings from freely breathing rats also show a rapid termination of this signal after the inhalation phase of respiration (Chaput 2000; Chaput and Chalansonnet 1997), suggesting that the decay of the presynaptic calcium signal reflects a true cessation of odorant responsiveness in ORNs. Whether the transient nature of the ORN response is due to rapid clearance of odorant from the receptor site or rapid adaptation of ORNs—as previously demonstrated in vitro (Reisert and Matthews 2001)—remains to be determined.
The relatively slow activation of ORN populations during natural odorant sampling has important consequences for models of synaptic processing in the OB. Many of the characteristic features of the OB network have been described using single ON shocks to drive postsynaptic activity (reviews: Schoppa and Urban 2003; Shipley and Ennis 1996; Wachowiak and Shipley 2006). However, recent studies have revealed that novel response features emerge when afferent inputs begin to approximate those elicited by natural odor sampling. For example, brief trains of ON shocks repeated at frequencies in the range of natural sniffing result in amplification of M/T cell responses, glomerulus-specific synchronization of action potential firing in M/T cells and external tufted cells, increased temporal precision of M/T cell firing, and the emergence of gamma-frequency oscillations in M/T membrane potentials (Balu et al. 2004; Hayar et al. 2004; Schoppa 2006b; Schoppa and Westbrook 2001). It will thus be interesting to test for the emergence of these and perhaps additional network phenomena using stimulus protocols that evoke more naturalistic, progressively increasing (i.e., 50- to 100-ms rise time) inputs to the OB. Likewise, using realistic input dynamics to drive biophysical and network models of the OB (David et al. 2007; Rubin and Cleland 2006) may yield insights into dynamic mechanisms of odor information processing.
We found that inhalation alone evoked detectable ORN input to a large fraction (≥50%) of dorsal OB glomeruli. This result provides the first direct evidence that ORN input to the olfactory bulb can be driven solely by inhalation in vivo. We found that the magnitude of inhalation-evoked input to most glomeruli was a fraction of that evoked by odorant stimulation; at the same time we found that inhalation evoked large-magnitude inputs to a few glomeruli. These latter glomeruli may receive input from ORNs that are highly sensitive to odorants emitted by the animal. Our results are also consistent with the hypothesis that at least some ORNs are sensitive to mechanical stimulation associated with intranasal airflow: mechanosensitivity to pressures approximating those generated during respiration has been demonstrated for ORNs in vitro (Grosmaitre et al. 2007) and electrophysiological recordings from OB neurons have provided indirect evidence in support of this hypothesis in vivo (Onoda and Mori 1980; Ueki and Domino 1961; Walsh 1956).
The role played by ORN inputs driven by inhalation alone in shaping respiratory patterning of postsynaptic activity in the OB remains controversial. Although many studies have reported respiratory patterning of postsynaptic activity in the absence of odorant (Adrian 1942; Chaput et al. 1992; Macrides and Chorover 1972; Rinberg et al. 2006a), others have found no such patterning or observed patterned responses in some OB neurons but not others (Sobel and Tank 1993; Walsh 1956). The fact that different glomeruli appear to receive differing magnitudes of inhalation-driven ORN input may provide one explanation for these conflicting results. In addition, if ORNs are in fact driven by mechanical stimulation, then even slight differences in inhalation parameters—for example, as a result of anesthesia—may lead to considerable differences in the degree to which inhalation drives ORN inputs. We speculate that, in the awake animal, inhalation-driven afferent input and centrifugal fibers reflecting the respiratory rhythm may interact to shape the temporal patterning of postsynaptic OB neurons in a manner that changes dynamically with sampling behavior.
Intrinsic variability in ORN input dynamics
In addition to the temporal structure imposed on ORN inputs by the respiratory rhythm, we found that ORN inputs showed response dynamics that varied according to the glomerulus they innervated, odorant identity, and to a lesser degree odorant concentration. These dynamics occurred mainly as differences in the latency, rise time, and duration of the burst of ORN input evoked by a single inhalation. Temporally diverse presynaptic calcium signals likely reflect “intrinsic” variability in the temporal patterns of odorant- and respiration-evoked action potential firing across populations of ORNs converging onto different glomeruli, rather than temporal shaping of calcium influx by presynaptic inhibition onto the ORN terminal. This conclusion is supported by the fact that, in anesthetized mice, presynaptic inhibition affects the magnitude of ORN inputs but does not contribute significantly to their dynamics, nor does it contribute to the attenuation and loss of respiratory patterning of calcium signals during high-frequency artificial sniffing (Pírez and Wachowiak 2008). Thus temporally diverse presynaptic calcium signals likely reflect odorant-specific differences in the kinetics of odorant access to the ORNs as well as ligand–receptor interactions.
Dynamic odor representations following a single inhalation may play a role in coding odor information in the awake animal (Schaefer and Margrie 2007). We found that the intrinsic dynamics of ORN input to glomeruli varied reliably across glomeruli and across multiple samples of odorant, consistent with this hypothesis. In addition, rats and mice are capable of performing simple odor discriminations in as little as 160–200 ms after an inhalation (Abraham et al. 2004; Rinberg et al. 2006b; Uchida and Mainen 2003; Wesson et al. 2008a), a time at which only a fraction of ORN inputs to glomeruli have become fully activated (Wesson et al. 2008a). However, for more difficult discriminations, mice and rats take up to 200 ms longer (Abraham et al. 2004; Rinberg et al. 2006b), a time that roughly matches the temporal spread over which odor representations develop in the present study (242 ± 72 ms). Thus the intrinsic variability in the dynamics of inhalation-evoked ORN inputs to the OB may set an upper limit on the time window for integration of odor information in the behaving animal.
Sniff frequency and odor information processing in the OB
Odorant sampling frequency had a strong impact on the temporal structure of sensory input to the OB, reducing the degree to which ORN inputs are linked to the respiratory rhythm. Although the magnitude of this effect was variable for different glomeruli, some loss of respiratory patterning occurred for nearly all glomeruli and was independent of the magnitude of odorant-evoked input to a glomerulus. These results are qualitatively similar to those reported previously in anesthetized mice using artificial inhalation at different frequencies (Spors et al. 2006). As with the temporal dynamics of responses evoked by a single inhalation, the effect of high-frequency sniffing was odorant specific, to a degree, with ORN input to the same glomerulus showing different amounts of coherence loss when evoked by different odorants, even when these odorants evoked responses of similar magnitude (e.g., Fig. 7, A, B, and F). It is unlikely that the frequency-dependent loss of patterning simply reflects inability of the calcium-sensitive dye to follow high-frequency inputs. Instead, this effect likely reflects the kinetics of odorant flow within the nasal cavity and/or the kinetics of receptor–ligand interactions. Limitations on bulk flow rates through the complex nasal cavity may particularly limit the degree to which odorant levels are modulated during high-frequency respiration (Yang et al. 2007); indeed, recent hydrodynamic modeling data suggest that odorant concentrations show significant tonic components during high-frequency sniffing (Zhao and Jiang 2008).
A change in the temporal structure of sensory input from phasic and respiration-locked to predominately tonic may substantially alter the postsynaptic processing of olfactory information. For example, the synapse between ORNs and second-order neurons is subject to strong activity-dependent depression due to feedback presynaptic inhibition and vesicle depletion and postsynaptic α-amino-3-hydroxy-5-methyl-4-isoxazolepropionic acid receptors show rapid desensitization (McGann et al. 2005; Murphy et al. 2004; Wachowiak et al. 2005). Thus the overall strength of synaptic coupling between ORNs and M/T cells may be suppressed by tonic ORN activation. Second, recurrent inhibition between mitral and granule cells enhances the temporal precision of mitral cell firing when excitatory inputs to mitral cells themselves are temporally patterned (Balu et al. 2004; Schoppa 2006b), but modeling and experimental studies suggest that this precision is reduced or lost when inputs are temporally dispersed or occur tonically (Balu et al. 2004; David et al. 2007). Thus M/T cell responses may become largely decoupled from the respiratory cycle—as well as less synchronized with each other—during high-frequency sniffing. Indeed, such a loss of respiratory patterning in M/T cell responses has been observed during high-frequency sniffing in awake, freely moving rats (Bhalla and Bower 1997; Kay and Laurent 1999; Pager 1985). It will be interesting to test these hypotheses by systematically examining the effect of sampling frequency on both the dynamics and odorant-response specificity of M/T cells.
Finally, frequency-dependent changes in the temporal structure of ORN input may alter odor-coding strategies in the OB. Although respiration-related patterning of OB activity has the potential to play an important role in odor coding at low, regular frequencies (i.e., 1–3 Hz) (Chaput 1986; Hopfield 1995; Macrides and Chorover 1972; Margrie and Schaefer 2003; Schaefer and Margrie 2007), sniffing behavior in the freely moving animal is both aperiodic and higher in mean frequency (Bhalla and Bower 1997; Kay and Laurent 1999; Wesson et al. 2008b). The loss of respiratory patterning we observe under these conditions suggests that this respiratory-phase–related encoding of odor information might not be possible during active odor-guided behaviors (Kay and Laurent 1999). Instead, alternate strategies may be implemented.
GRANTS
This work was supported by grants from the National Institute on Deafness and Other Communication Disorders and Boston University.
Acknowledgments
We thank A. Fontanini, D. Katz, and H. Eichenbaum for advice with the behavioral paradigm, R. Friedrich for providing code for the deconvolution analysis, K. Sen for advice on coherence analysis, and members of the Wachowiak lab for comments on the manuscript.
Present address of J. V. Verhagen: The John B. Pierce Foundation, New Haven, CT 06520.
The costs of publication of this article were defrayed in part by the payment of page charges. The article must therefore be hereby marked “advertisement” in accordance with 18 U.S.C. Section 1734 solely to indicate this fact.
REFERENCES
- Abraham et al. 2004.Abraham NM, Spors H, Carleton A, Margrie TW, Kuner T, Schaefer AT. Maintaining accuracy at the expense of speed: stimulus similarity defines odor discrimination time in mice. Neuron 44: 865–876, 2004. [DOI] [PubMed] [Google Scholar]
- Adrian 1942.Adrian ED Olfactory reactions in the brain of the hedgehog. J Physiol 100: 459–473, 1942. [DOI] [PMC free article] [PubMed] [Google Scholar]
- Arevian et al. 2008.Arevian AC, Kapoor V, Urban NN. Activity-dependent gating of lateral inhibition in the mouse olfactory bulb. Nat Neurosci 11: 80–87, 2008. [DOI] [PMC free article] [PubMed] [Google Scholar]
- Balu et al. 2004.Balu R, Larimer P, Strowbridge BW. Phasic stimuli evoke precisely timed spikes in intermittently discharging mitral cells. J Neurophysiol 92: 743–753, 2004. [DOI] [PubMed] [Google Scholar]
- Bathellier et al. 2008.Bathellier B, Buhl DL, Accolla R, Carleton A. Dynamic ensemble odor coding in the mammalian olfactory bulb: sensory information at different timescales. Neuron 57: 586–598, 2008. [DOI] [PubMed] [Google Scholar]
- Bhalla and Bower 1997.Bhalla US, Bower JM. Multiday recordings from olfactory bulb neurons in awake freely moving rats: spatially and temporally organized variability in odorant response properties. J Comput Neurosci 4: 221–256, 1997. [DOI] [PubMed] [Google Scholar]
- Bobkov and Ache 2007.Bobkov YV, Ache BW. Intrinsically bursting olfactory receptor neurons. J Neurophysiol 97: 1052–1057, 2007. [DOI] [PubMed] [Google Scholar]
- Bozza et al. 2004.Bozza T, McGann JP, Mombaerts P, Wachowiak M. In vivo imaging of neuronal activity by targeted expression of a genetically encoded probe in the mouse. Neuron 42: 9–21, 2004. [DOI] [PubMed] [Google Scholar]
- Buonviso et al. 2006.Buonviso N, Amat C, Litaudon P. Respiratory modulation of olfactory neurons in the rodent brain. Chem Senses 31: 145–154, 2006. [DOI] [PubMed] [Google Scholar]
- Buonviso et al. 1992.Buonviso N, Chaput MA, Berthommier F. Temporal pattern analyses in pairs of neighboring mitral cells. J Neurophysiol 68: 417–424, 1992. [DOI] [PubMed] [Google Scholar]
- Cang and Isaacson 2003.Cang J, Isaacson JS. In vivo whole-cell recording of odor-evoked synaptic transmission in the rat olfactory bulb. J Neurosci 23: 4108–4116, 2003. [DOI] [PMC free article] [PubMed] [Google Scholar]
- Chaput et al. 1992.Chaput M, Buonviso N, Bethommier F. Temporal patterns in spontaneous and odor-evoked mitral cell discharges recorded in anesthetized freely-breathing animals. Eur J Neurosci 4: 813–822, 1992. [DOI] [PubMed] [Google Scholar]
- Chaput 1986.Chaput MA Respiratory-phase-related coding of olfactory information in the olfactory bulb of awake freely-breathing rabbits. Physiol Behav 36: 319–324, 1986. [DOI] [PubMed] [Google Scholar]
- Chaput 2000.Chaput MA EOG responses in anesthetized freely breathing rats. Chem Senses 25: 695–701, 2000. [DOI] [PubMed] [Google Scholar]
- Chaput and Chalansonnet 1997.Chaput MA, Chalansonnet M. Recording the slow potentials evoked by odors in the olfactory mucosa of awake animals. J Neurosci Methods 75: 193–198, 1997. [DOI] [PubMed] [Google Scholar]
- David et al. 2007.David F, Linster C, Cleland TA. Lateral dendritic shunt inhibition can regularize mitral cell spike patterning. J Comput Neurosci 25: 25–38, 2007. [DOI] [PubMed] [Google Scholar]
- Duchamp-Viret et al. 1999.Duchamp-Viret P, Chaput MA, Duchamp A. Odor response properties of rat olfactory receptor neurons. Science 284: 2171–2174, 1999. [DOI] [PubMed] [Google Scholar]
- Duchamp-Viret et al. 2000.Duchamp-Viret P, Duchamp A, Chaput MA. Peripheral odor coding in the rat and frog: quality and intensity specification. J Neurosci 20: 2383–2390, 2000. [DOI] [PMC free article] [PubMed] [Google Scholar]
- Gire and Schoppa 2008.Gire DH, Schoppa NE. Long-term enhancement of synchronized oscillations by adrenergic receptor activation in the olfactory bulb. J Neurophysiol 99: 2021–2025, 2008. [DOI] [PubMed] [Google Scholar]
- Grosmaitre et al. 2007.Grosmaitre X, Santarelli LC, Tan J, Luo M, Ma M. Dual functions of mammalian olfactory sensory neurons as odor detectors and mechanical sensors. Nat Neurosci 10: 348–354, 2007. [DOI] [PMC free article] [PubMed] [Google Scholar]
- Hallem et al. 2004.Hallem EA, Ho MG, Carlson JR. The molecular basis of odor coding in the Drosophila antenna. Cell 117: 965–979, 2004. [DOI] [PubMed] [Google Scholar]
- Hayar et al. 2004.Hayar A, Karnup S, Shipley MT, Ennis M. Olfactory bulb glomeruli: external tufted cells intrinsically burst at theta frequency and are entrained by patterned olfactory input. J Neurosci 24: 1190–1199, 2004. [DOI] [PMC free article] [PubMed] [Google Scholar]
- Hopfield 1995.Hopfield JJ Pattern recognition computation using action potential timing for stimulus representation. Nature 376: 33–36, 1995. [DOI] [PubMed] [Google Scholar]
- Johnson and Leon 2000.Johnson BA, Leon M. Modular representations of odorants in the glomerular layer of the rat olfactory bulb and the effects of stimulus concentration. J Comp Neurol 422: 496–509, 2000. [DOI] [PubMed] [Google Scholar]
- Katz et al. 2001.Katz DB, Simon SA, Nicolelis MA. Dynamic and multimodal responses of gustatory cortical neurons in awake rats. J Neurosci 21: 4478–4489, 2001. [DOI] [PMC free article] [PubMed] [Google Scholar]
- Kay and Laurent 1999.Kay LM, Laurent G. Odor- and context-dependent modulation of mitral cell activity in behaving rats. Nat Neurosci 2: 1003–1009, 1999. [DOI] [PubMed] [Google Scholar]
- Kepecs et al. 2007.Kepecs A, Uchida N, Mainen ZF. Rapid and precise control of sniffing during olfactory discrimination in rats. J Neurophysiol 98: 205–213, 2007. [DOI] [PubMed] [Google Scholar]
- Khan et al. 2008.Khan AG, Thattai M, Bhalla US. Odor representations in the rat olfactory bulb change smoothly with morphing stimuli. Neuron 57: 571–585, 2008. [DOI] [PMC free article] [PubMed] [Google Scholar]
- Macrides 1975.Macrides F Temporal relationships between hippocampal slow waves and exploratory sniffing in hamsters. Behav Biol 14: 295–308, 1975. [DOI] [PubMed] [Google Scholar]
- Macrides and Chorover 1972.Macrides F, Chorover SL. Olfactory bulb units: activity correlated with inhalation cycles and odor quality. Science 175: 84–87, 1972. [DOI] [PubMed] [Google Scholar]
- Margrie and Schaefer 2003.Margrie TW, Schaefer AT. Theta oscillation coupled spike latencies yield computational vigour in a mammalian sensory system. J Physiol 546: 363–374, 2003. [DOI] [PMC free article] [PubMed] [Google Scholar]
- McGann et al. 2005.McGann JP, Pírez N, Gainey MA, Muratore C, Elias AS, Wachowiak M. Odorant representations are modulated by intra- but not interglomerular presynaptic inhibition of olfactory sensory neurons. Neuron 48: 1039–1053, 2005. [DOI] [PubMed] [Google Scholar]
- Meredith 1986.Meredith M Patterned response to odor in the mammalian olfactory bulb: the influence of intensity. J Neurophysiol 56: 572–597, 1986. [DOI] [PubMed] [Google Scholar]
- Mozell and Jagodowicz 1973.Mozell MM, Jagodowicz M. Chromatographic separation of odorants by the nose: retention times measured across in vivo olfactory mucosa. Science 181: 1247–1249, 1973. [DOI] [PubMed] [Google Scholar]
- Mozell et al. 1987.Mozell MM, Sheehe PR, Hornung DE, Kent PF, Youngentob SL, Murphy SJ. Imposed and inherent mucosal activity patterns. J Gen Physiol 90: 625–650, 1987. [DOI] [PMC free article] [PubMed] [Google Scholar]
- Murphy et al. 2004.Murphy GJ, Glickfeld LL, Balsen Z, Isaacson JS. Sensory neuron signaling to the brain: properties of transmitter release from olfactory nerve terminals. J Neurosci 24: 3023–3030, 2004. [DOI] [PMC free article] [PubMed] [Google Scholar]
- Onoda and Mori 1980.Onoda N, Mori K. Depth distribution of temporal firing patterns in olfactory bulb related to air-intake cycles. J Neurophysiol 44: 29–39, 1980. [DOI] [PubMed] [Google Scholar]
- Pager 1985.Pager J Respiration and olfactory bulb unit activity in the unrestrained rat: statements and reappraisals. Behav Brain Res 16: 81–94, 1985. [DOI] [PubMed] [Google Scholar]
- Pírez and Wachowiak 2008.Pírez N, Wachowiak M. In vivo modulation of sensory input to the olfactory bulb by tonic and activity-dependent presynaptic inhibition of receptor neurons. J Neurosci 28: 6360–6371, 2008. [DOI] [PMC free article] [PubMed] [Google Scholar]
- Reisert and Matthews 2001.Reisert J, Matthews HR. Response properties of isolated mouse olfactory receptor cells. J Physiol 530: 113–122, 2001. [DOI] [PMC free article] [PubMed] [Google Scholar]
- Rennaker et al. 2007.Rennaker RL, Chen C-FF, Ruyle AM, Sloan AM, Wilson DA. Spatial and temporal distribution of odorant-evoked activity in the piriform cortex. J Neurosci 27: 1534–1542, 2007. [DOI] [PMC free article] [PubMed] [Google Scholar]
- Rinberg et al. 2006a.Rinberg D, Koulakov A, Gelperin A. Sparse odor coding in awake behaving mice. J Neurosci 26: 8857–8865, 2006a. [DOI] [PMC free article] [PubMed] [Google Scholar]
- Rinberg et al. 2006b.Rinberg D, Koulakov A, Gelperin A. Speed–accuracy tradeoff in olfaction. Neuron 51: 351–358, 2006b. [DOI] [PubMed] [Google Scholar]
- Rospars et al. 2008.Rospars JP, Lansky P, Chaput M, Duchamp-Viret P. Competitive and noncompetitive odorant interactions in the early neural coding of odorant mixtures. J Neurosci 28: 2659–2666, 2008. [DOI] [PMC free article] [PubMed] [Google Scholar]
- Rubin and Cleland 2006.Rubin DB, Cleland TA. Dynamical mechanisms of odor processing in olfactory bulb mitral cells. J Neurophysiol 96: 555–568, 2006. [DOI] [PubMed] [Google Scholar]
- Schaefer and Margrie 2007.Schaefer AT, Margrie TW. Spatiotemporal representations in the olfactory system. Trends Neurosci 30: 92–100, 2007. [DOI] [PubMed] [Google Scholar]
- Schoenfeld and Cleland 2005.Schoenfeld TA, Cleland TA. The anatomical logic of smell. Trends Neurosci 28: 620–627, 2005. [DOI] [PubMed] [Google Scholar]
- Schoppa 2006a.Schoppa NE AMPA/kainate receptors drive rapid output and precise synchrony in olfactory bulb granule cells. J Neurosci 26: 12996–13006, 2006a. [DOI] [PMC free article] [PubMed] [Google Scholar]
- Schoppa 2006b.Schoppa NE Synchronization of olfactory bulb mitral cells by precisely timed inhibitory inputs. Neuron 49: 271–283, 2006b. [DOI] [PubMed] [Google Scholar]
- Schoppa and Urban 2003.Schoppa NE, Urban NN. Dendritic processing within olfactory bulb circuits. Trends Neurosci 26: 501–506, 2003. [DOI] [PubMed] [Google Scholar]
- Schoppa and Westbrook 2001.Schoppa NE, Westbrook GL. Glomerulus-specific synchronization of mitral cells in the olfactory bulb. Neuron 31: 639–651, 2001. [DOI] [PubMed] [Google Scholar]
- Scott et al. 2000.Scott JW, Brierley T, Schmidt FH. Chemical determinants of the rat electro-olfactogram. J Neurosci 20: 4721–4731, 2000. [DOI] [PMC free article] [PubMed] [Google Scholar]
- Scott-Johnson et al. 2000.Scott-Johnson PE, Blakley D, Scott JW. Effects of air flow on rat electroolfactogram. Chem Senses 25: 25: 761–768, 2000. [DOI] [PubMed] [Google Scholar]
- Shipley and Ennis 1996.Shipley MT, Ennis M. Functional organization of olfactory system. J Neurobiol 30: 123–176, 1996. [DOI] [PubMed] [Google Scholar]
- Sobel and Tank 1993.Sobel EC, Tank DW. Timing of odor stimulation does not alter patterning of olfactory bulb unit activity in freely breathing rats. J Neurophysiol 69: 1331–1337, 1993. [DOI] [PubMed] [Google Scholar]
- Spors and Grinvald 2002.Spors H, Grinvald A. Spatio-temporal dynamics of odor representations in the mammalian olfactory bulb. Neuron 34: 301–315, 2002. [DOI] [PubMed] [Google Scholar]
- Spors et al. 2006.Spors H, Wachowiak M, Cohen LB, Friedrich RW. Temporal dynamics and latency patterns of receptor neuron input to the olfactory bulb. J Neurosci 26: 1247–1259, 2006. [DOI] [PMC free article] [PubMed] [Google Scholar]
- Tabor et al. 2004.Tabor R, Yaksi E, Weislogel JM, Friedrich RW. Processing of odor mixtures in the zebrafish olfactory bulb. J Neurosci 24: 6611–6620, 2004. [DOI] [PMC free article] [PubMed] [Google Scholar]
- Uchida and Mainen 2003.Uchida N, Mainen ZF. Speed and accuracy of olfactory discrimination in the rat. Nat Neurosci 6: 1224–1229, 2003. [DOI] [PubMed] [Google Scholar]
- Ueki and Domino 1961.Ueki S, Domino EF. Some evidence for a mechanical receptor in olfactory function. J Neurophysiol 24: 12–25, 1961. [DOI] [PubMed] [Google Scholar]
- Verhagen et al. 2007.Verhagen JV, Wesson DW, Netoff TI, White JA, Wachowiak M. Sniffing controls an adaptive filter of sensory input to the olfactory bulb. Nat Neurosci 10: 631–639, 2007. [DOI] [PubMed] [Google Scholar]
- Wachowiak and Cohen 1999.Wachowiak M, Cohen LB. Presynaptic inhibition of primary olfactory afferents mediated by different mechanisms in lobster and turtle. J Neurosci 19: 8808–8817, 1999. [DOI] [PMC free article] [PubMed] [Google Scholar]
- Wachowiak and Cohen 2001.Wachowiak M, Cohen LB. Representation of odorants by receptor neuron input to the mouse olfactory bulb. Neuron 32: 723–735, 2001. [DOI] [PubMed] [Google Scholar]
- Wachowiak et al. 2005.Wachowiak M, McGann JP, Heyward PM, Shao Z, Puche AC, Shipley MT. Inhibition of olfactory receptor neuron input to olfactory bulb glomeruli mediated by suppression of presynaptic calcium influx. J Neurophysiol 94: 2700–2712, 2005. [DOI] [PMC free article] [PubMed] [Google Scholar]
- Wachowiak and Shipley 2006.Wachowiak M, Shipley MT. Coding and synaptic processing of sensory information in the glomerular layer of the olfactory bulb. Semin Cell Dev Biol 17: 411–423, 2006. [DOI] [PubMed] [Google Scholar]
- Walker et al. 1997.Walker JKL, Lawson BL, Jennings DB. Breath timing, volume and drive to breathe in conscious rats: comparative aspects. Respir Physiol 107: 241–250, 1997. [DOI] [PubMed] [Google Scholar]
- Walsh 1956.Walsh RR Single cell spike activity in the olfactory bulb. Am J Physiol 186: 255–257, 1956. [DOI] [PubMed] [Google Scholar]
- Welker 1964.Welker WI Analysis of sniffing in the albino rat. Behavior 22: 223–244, 1964. [Google Scholar]
- Wellis et al. 1989.Wellis DP, Scott JW, Harrison TA. Discrimination among odorants by single neurons of the rat olfactory bulb. J Neurophysiol 61: 1161–1177, 1989. [DOI] [PubMed] [Google Scholar]
- Wesson et al. 2008a.Wesson DW, Carey RM, Verhagen JV, Wachowiak M. Rapid encoding and perception of novel odors in the rat. PLoS Biol 6: e82, 2008a. [DOI] [PMC free article] [PubMed] [Google Scholar]
- Wesson et al. 2008b.Wesson DW, Donahou TN, Johnson MO, Wachowiak M. Sniffing behavior of mice during performance in odor-guided tasks. Chem Senses 33: 581–596, 2008b. [DOI] [PMC free article] [PubMed] [Google Scholar]
- Wesson et al. 2009.Wesson DW, Verhagen JV, Wachowiak M. Why sniff fast? The relationship between sniff frequency, odor discrimination, and receptor neuron activation in the rat. J Neurophysiol 101: 1089–1102, 2009. [DOI] [PMC free article] [PubMed] [Google Scholar]
- Xu et al. 2000.Xu F, Kida I, Hyder F, Shulman RG. Assessment and discrimination of odor stimuli in rat olfactory bulb by dynamic functional MRI. Proc Natl Acad Sci USA 97: 10601–10606, 2000. [DOI] [PMC free article] [PubMed] [Google Scholar]
- Yaksi and Friedrich 2006.Yaksi E, Friedrich RW. Reconstruction of firing rate changes across neuronal populations by temporally deconvolved Ca(2+) imaging. Nat Methods 3: 377–383, 2006. [DOI] [PubMed] [Google Scholar]
- Yang et al. 2007.Yang GC, Scherer PW, Mozell MM. Modeling inspiratory and expiratory steady-state velocity fields in the Sprague-Dawley rat nasal cavity. Chem Senses 32: 215–223, 2007. [DOI] [PubMed] [Google Scholar]
- Young and Wilson 1999.Young TA, Wilson DA. Frequency-dependent modulation of inhibition in the rat olfactory bulb. Neurosci Lett 276: 65–67, 1999. [DOI] [PubMed] [Google Scholar]
- Youngentob et al. 1987.Youngentob SL, Mozell MM, Sheehe PR, Hornung DE. A quantitative analysis of sniffing strategies in rats performing odor discrimination tasks. Physiol Behav 41: 59–69, 1987. [DOI] [PubMed] [Google Scholar]
- Zhao and Jiang 2008.Zhao K, Jiang J. Spatial and temporal odorant transport patterns in rat nose: a computational study. In: International Symposium on Olfaction and Taste. San Francisco, CA: Association for Chemoreception Sciences, 2008.