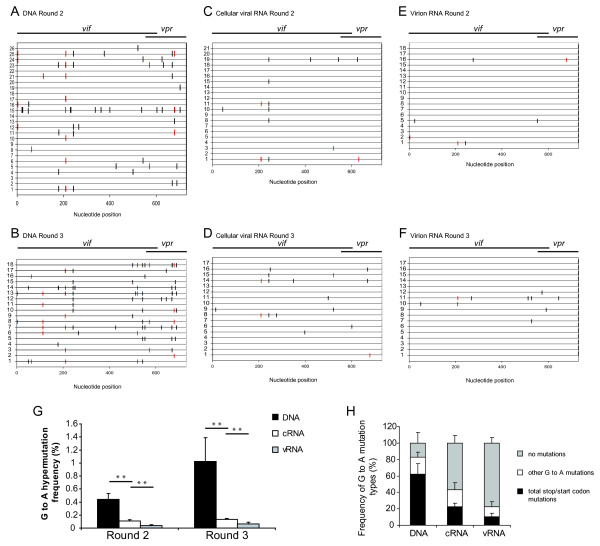
Figure 3.
Gradient of A3G-induced hypermutation across proviral DNA, cellular viral RNA (cRNA), and virion RNA (vRNA) observed in the vif of HIV-YRHHY > A5. (A and B) Schematic representation of a sample of proviral DNA sequences of individual clones from Rounds 2 and 3. Genomic DNA was extracted from infected CEM cells at the peak of infection (as determined by RT activity). A 730 bp region including the vif gene and a portion of the vpr gene was amplified, cloned, and sequenced. Each horizontal line represents an individual clone. Each vertical line represents a G-to-A mutation. Red vertical lines represent G-to-A mutations that would result in a loss of Vif production due to either mutation of the start codon or insertion of a premature stop codon. Red vertical lines in the Vif/Vpr overlapping region are mutations that altered the Vpr start codon or generated stop codons in the Vif or Vpr open reading frames. Some vertical lines appear to be thick because two or more thin lines are very close to each other. (C and D) Schematic representation of a sample of cRNA sequences of individual clones from Rounds 2 and 3. The layout is as described above except that each clone originates from cRNA extracted from infected CEM cells at the peak of virus infection. (E and F) Schematic representation of a sample of vRNA sequences of individual clones from Rounds 2 and 3. The layout is as described above except that each clone originates from vRNA extracted from virus-containing supernatant at the peak of virus infection. (G) Graphical representation of the G-to-A hypermutation frequency from each round of infection. The frequency of G-to-A hypermutation in the proviral DNA, cRNA, and vRNA across each individual infection (YA, YB and YC) for Rounds 2 and 3 was determined. Statistical significance was calculated using the t-test assuming equal variance with a one-tailed analysis. (H) Graphical representation of the type of G-to-A mutations observed in each individual clone in the proviral DNA, the cRNA, and the vRNA. The sequences from Rounds 2 and 3 were separated into 3 different groups – those that had G-to-A mutations that would destroy expression of either Vif, Vpr, or both; those that had G-to-A mutations that did not destroy protein production and those that had no G-to-A mutations within the region sequenced. For the proviral DNA 139 sequences were analyzed, for the cRNA 108 sequences were analyzed, and for the vRNA 127 sequences were analyzed.

