Abstract
Sustentacular cells have structural features that allude to functions of secretion, absorption, phagocytosis, maintenance of extracellular ionic gradients, metabolism of noxious chemicals, and regulation of cell turnover. We present data detailing their dynamic activity. We show, using a mouse olfactory epithelium slice model, that sustentacular cells are capable of generating two types of calcium signals: intercellular calcium waves where elevations in intracellular calcium propagate between neighboring cells, and intracellular calcium oscillations consisting of repetitive elevations in intracellular calcium confined to single cells. Sustentacular cells exhibited rapid, robust increases in intracellular calcium in response to G-protein coupled muscarinic and purinergic receptor stimulation. In a subpopulation of sustentacular cells, oscillatory calcium transients were evoked. We pharmacologically characterized the properties of purinergic-evoked increases in intracellular calcium. Calcium transients were elicited by release from intracellular stores and were not dependent on extracellular calcium. BAPTA-AM, a cytosolic calcium chelator, and cyclopiazonic acid, an endoplasmic reticulum Ca2+-ATPase inhibitor irreversibly blocked the purinergic-induced calcium transient. Phospholipase C (PLC) antagonist U73122 inhibited the purinergic-evoked calcium transient. 2-aminoethoxydiphenyl borate (2-APB), an inositol-1,4,5-trisphosphate (IP3) receptor antagonist, and the ryanodine receptor (RyR) antagonists tetracaine and ryanodine, inhibited the UTP-induced calcium transients. Collectively, these data suggest that activation of the PLC pathway, IP3-mediated calcium release, and subsequent calcium-induced-calcium release is involved in ATP-elicited increases in intracellular calcium. Our findings indicate that sustentacular cells are not static support cells, and, like glia in the central nervous system, have complex calcium signaling.
Keywords: glial cell, olfactory system, calcium oscillations, calcium waves
Introduction
The olfactory epithelium (OE) of mammals consists of four primary cell types: basal progenitor cells, microvillar cells, the putative bipolar secondary chemosensory cells (Elsaesser et al., 2005; Elsaesser and Paysan, 2007), ciliated olfactory sensory neurons, the primary chemosensory cells, and sustentacular cells. Sustentacular cells function as both epithelial and glial support cells. As epithelial-like cells, sustentacular cells are involved in secretion (Menco and Morrison, 2003), endocytosis (Bannister and Dodson, 1992), and metabolism of toxicants (Dahl et al., 1982; Dahl, 1988). As glial-like cells (Okano and Takagi, 1974; Getchell, 1977), sustentacular cells physically and chemically insulate olfactory sensory neurons (Breipohl et al., 1974), actively phagocytose dead cells (Suzuki et al., 1996), and regulate the extracellular ionic environment (Breipohl et al., 1974; Rafols and Getchell, 1983; Getchell, 1986).
In the central nervous system, glial calcium regulates multiple cell functions including gene expression, cell proliferation, metabolism, ion transport systems, release of cell products, and cell death. Two types of glial calcium signals are intercellular Ca2+ waves where elevations in intracellular calcium propagate between neighboring cells, and intracellular calcium oscillations which consist of repetitive elevations in intracellular calcium that remain confined to single cells. Here, we demonstrate that sustentacular cells exhibit both types of glial calcium signals: intercellular calcium waves that may involve gap junctions or extracellular factors, and intracellular calcium oscillations. We show that activation of G-protein coupled receptors including the P2Y purinergic receptor and the muscarinic acetylcholine receptor produce calcium oscillations in sustentacular cells. We pharmacologically determined that activation of the PLC pathway with subsequent production of inositol-1,4,5-trisphosphate (IP3) is involved in G-protein coupled receptor evoked intracellular calcium increases. Our findings point to a key role for sustentacular cells in integrating communication between neurons, basal cells and sustentacular cells (Masukawa et al., 1983; Hansel et al., 2001; Vogalis et al., 2005a; Vogalis et al., 2005b).
Materials and Methods
Materials
All chemicals were obtained from Sigma Aldrich Chemicals (St. Louis, MO) except for ryanodine (Calbiochem, San Diego, CA), cyclopiazonic acid (CPA, Alomone Labs, Jerusalem), and 2-aminoethoxydiphenyl borate (2-APB, Caymen Chemical, Ann Arbor, MI).
Solutions
Ringer’s solution contained (mM): 140 NaCl, 5 KCl, 1 MgCl2, 2 CaCl2, 10 HEPES, 10 glucose; pH 7.4, 290–320 mOsms. Probenecid (500 μM), an inhibitor of the organic anion transporter, was included to aid in the loading and retention of fluo-4 AM (Di et al., 1990; Manzini et al., 2008). Zero calcium Ringer’s solution contained (mM) 130 NaCl, 5.5 KCl, 10 HEPES, 10 glucose; 4 glycol-bis(2-aminoethylether)-N,N,N′,N′-tetraacetic acid (EGTA), pH 7.4, 290–320 mOsms. In some experiments, NaCl was replaced with an equimolar amount of either KCl or caffeine. Concentrated stocks were made in water or Ringer’s solution (ATP, UTP, ryanodine, Ni2+, neomycin, mecamylamine, acetylcholine), stored at −20 °C and reconstituted on the day of the experiment. BAPTA-AM, U73122, U73343, and CPA stocks were made in DMSO (0.1–1% final concentration DMSO), and atropine was made in ethanol (0.03% final concentration ethanol). The odorants amyl acetate and r-carvone, (10 kM each) were added directly to Ringer’s solution.
Preparation of Olfactory Epithelium Slices
All animal procedures were approved by the University of Utah or Michigan State University Institutional Animal Care and Use Committees, and all applicable guidelines from the National Institutes of Health Guide for Care and Use of Laboratory Animals were followed. To prepare olfactory epithelial (OE) slices, neonatal Swiss Webster or C57/BL6 mice (Charles River, Portage, MI or Simonsen, Gilroy, CA; postnatal day 0–6) were quickly decapitated, and the skin and lower jaw were removed. Tissue was embedded in a carrot, mounted on a vibratome-cutting block in ice cold Ringer’s solution and 250–300 μm slices were made. For the chronic BAPTA-AM study, slices were exposed to 100 μM BAPTA-AM or vehicle (1% DMSO) at 37°C in 5% CO2 in Neuroblast media (Invitrogen, Carlsbad, CA) and 2.5% antibiotic-antimycotic solution (Invitrogen, Carlsbad, CA). Slices were loaded with 18 kM fluo-4 AM (Molecular Probes, Eugene, OR) for 90 minutes at 25 °C. A stock solution of fluo-4 AM was prepared weekly in DMSO containing 20% pluronic F-127 (Invitrogen, Carlsbad, CA). Ringer’s solution was added to this stock solution for a final concentration of 18 μM fluo-4 AM, 0.04% pluronic F-127 and 0.4% DMSO.
Confocal Calcium Imaging
Slices were placed in a laminar flow chamber (Warner Instruments, Hamden, CT) and perfused continuously with Ringer’s solution at a flow rate of 1.5–2.0 ml/min. Test solutions were applied using bath exchange and a small volume loop injector (200 μl). Our perfusion system exchanges the bath in ca. 7–10 s and traces were not corrected for this delay. Imaging occurred 50–100 km below the surface of the slice to avoid damaged cells.
A Zeiss LSM 510 confocal laser scanning system (Zeiss, Thornwood, NY) was used for data collection and analysis. A krypton-argon ion laser was used for fluorescence excitation at 488 nm. Fluorescence emissions were filtered at 510 nm. Time series experiments were performed collecting 1400 × 700 pixel images at 0.2 – 1 Hz. Some experiments were performed using an Olympus Fluoview 100 laser scanning confocal microscope (Olympus, PA), an argon laser, and equivalent laser settings. The fluorometric signals obtained are expressed as relative fluorescence (F) change, ΔF/F = (F−F0)/F0, where F0 is the basal fluorescence level (mean F of first 10 frames). Increases in fluorescence greater than 10% above baseline were deemed responses.
Imaging Data Analysis
Experiments were performed by sequentially obtaining (1) initial control agonist-evoked calcium transients, (2) calcium transients evoked by co-application of agonist in the presence of antagonists and (3) recovery agonist-evoked calcium transients. To be included in our data set, the peak amplitude of the recovery Ca2+ transient had to be at least 75% of the initial transient amplitude. All data was normalized to the initial Ca2+ transient. Linear rundown occurred during multiple applications of test compounds. Thus, to determine if there were treatment effects, we performed a linear regression on the peak amplitude of the control and recovery purinergic responses for every sustentacular cell. Using the linear regressions, predicted peak amplitudes for a second agonist response were calculated. Unless noted otherwise, paired Student’s t-tests were used to determine significant differences (p < 0.05) between the predicted peak amplitude and the observed peak amplitude.
Odorants (10 μM n-amyl acetate and/or 10–100 μM R-carvone) and elevated potassium Ringer’s solution (50–145 mM) were superfused onto slices at the end of an experiment to distinguish odorant- and voltage-insensitive sustentacular cells, and olfactory sensory neurons. In addition, the locations of sustentacular cell somas in apical OE, versus olfactory sensory neuron somas, in middle OE, were used to identify cell types.
Results
Sustentacular cells rarely generate spontaneous calcium waves
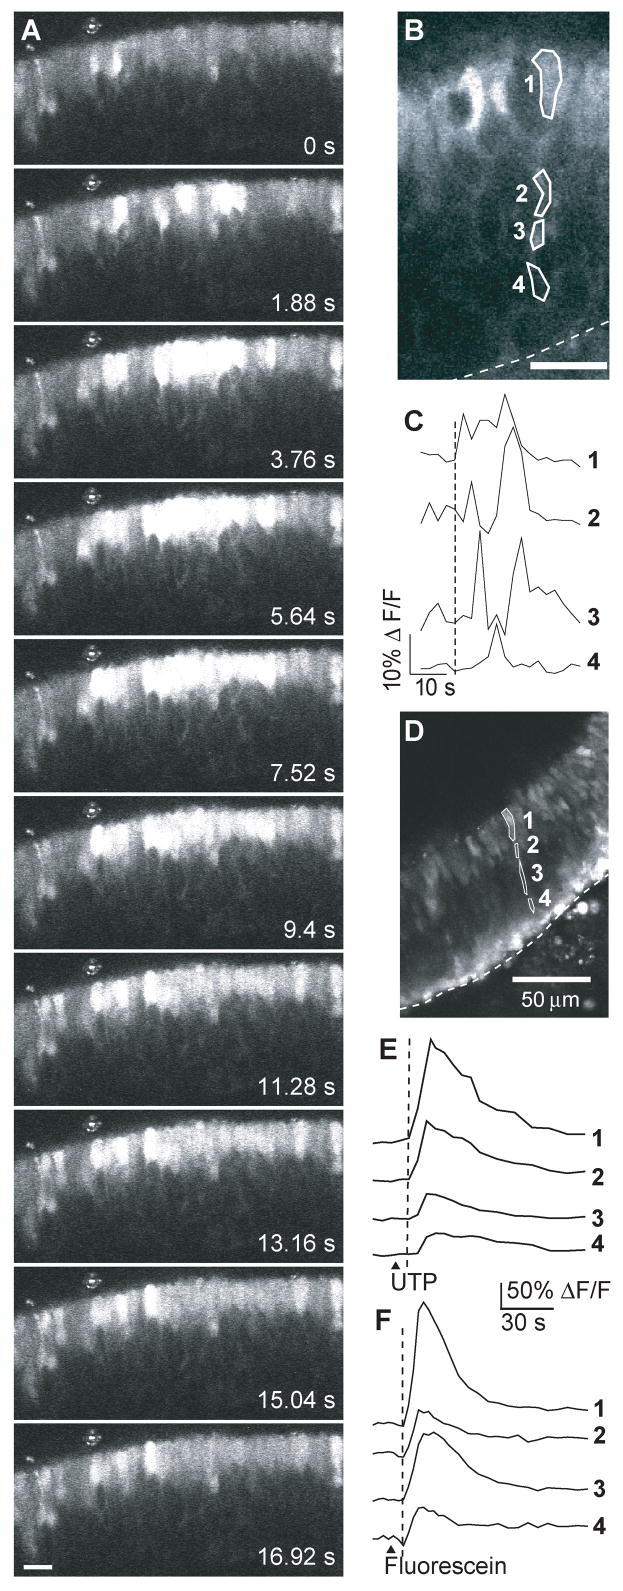
We used a neonatal mouse olfactory epithelium slice preparation loaded with fluo-4 AM to study sustentacular cell physiology. We occasionally observed intercellular calcium waves in sustentacular cells that propagated to neighboring cells (Figure 1A; see also supplementary movie). On average, a calcium wave traveled 107 ± 11 μm (n = 4) before extinguishing. Either an extracellular factor or chemical coupling between sustentacular cells may be involved in the propagation of these waves. There is ample evidence of gap junctions present in sustentacular cells (Menco, 1988; Miragall et al., 1992; Zhang and Restrepo, 2002; Rash et al., 2005), and we have shown that sustentacular cells are electrically coupled to each other (Vogalis et al., 2005a). Spontaneous intracellular calcium waves could be observed in a few slices that acquired fluo-4 AM loading in the thin cytoplasmic extensions and endfeet of sustentacular cells. The intracellular calcium increased in the cell soma first and slowly traveled to the basal region (Figure 1B,C). In Figure 1B, the wave traveled from the cell soma to the basal cell layer in 9.5 s (0.4 Hz sampling rate). The frequency of imaging a spontaneous intercellular or intracellular calcium wave was low (0.7%; 4/524 slices), although calcium waves may occur when the slices were not actively imaged. Thus, we did not investigate the mechanisms of initiation and propagation of the intercellular calcium waves.
Figure 1. Intercellular and Intracellular calcium waves in sustentacular cells.
(A) Shown are a series of images acquired during a spontaneous intercellular calcium wave in a Fluo-4AM loaded slice. See supplemental data for movie. Scale bar, 20 μm. (B) Example of a spontaneous intracellular calcium wave traveling from the apical to the basal cell layer. Numbered regions correspond to the traces shown in (C). Dashed line, basement membrane. Scale bar, 20 μm. (C) Time course of the transient Ca2+ increase recorded from the sustentacular cell shown in B. Numbered traces correspond to the regions shown in (B). (D–F) Confocal image (D) and time course of the UTP evoked Ca2+ transients (E) and inherent fluorescein (F) fluorescence recorded from the sustentacular cell shown in (D). Numbered traces correspond to the regions shown in (D). ▲, time of loop injection of UTP or fluorescein.
Evoked oscillatory calcium transients in sustentacular cells
We previously showed that sustentacular cells express G-protein coupled P2Y2-type purinergic receptors (Hegg et al., 2003; Hegg and Lucero, 2006). Purinergics evoked intracellular calcium waves in sustentacular cells (Figure 1D,E). Like the spontaneous intracellular calcium wave, the ATP-evoked calcium wave initiated in the cell soma and traveled to the basal layer at an average speed of 35 ± 20 μm/s (n=4, range 6–77 μm/s). At the end of an experiment, fluorescein, an inert fluorescent compound, was used to monitor perfusion rates. The fluorescein fluorescence simultaneously reached the entire breadth of the OE (Figure 1F), from apical surface to basal cell layer, suggesting that the intracellular wave was not due to a perfusion artifact.
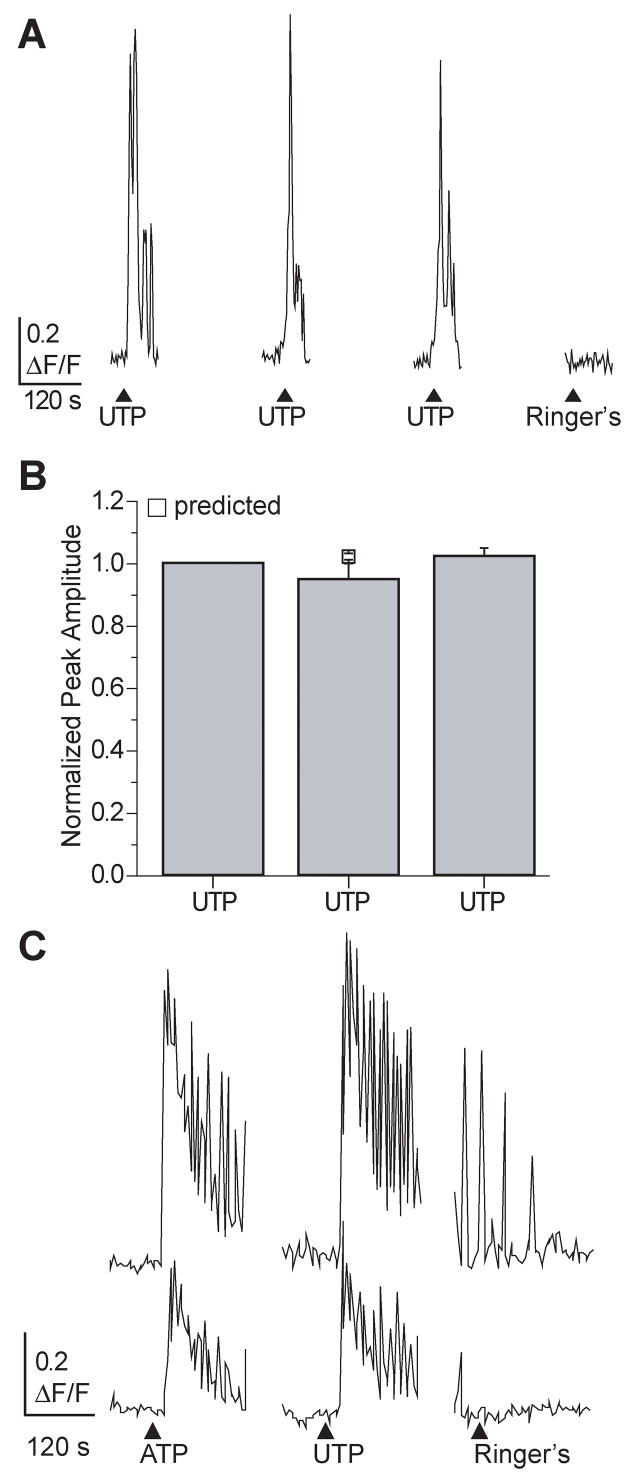
The majority of increased intracellular calcium was measured in the cell soma, likely due to its size, and the low loading of fluo-4 AM in the thin cytoplasmic extensions of the sustentacular cells. Thus, we examined the increases in intracellular calcium from the soma. The selective P2Y receptor agonist UTP reproducibly evoked calcium transients in sustentacular cells (Figure 2A). The average normalized peak calcium amplitudes from 3 successive applications of UTP superfused 5 minutes apart were 1.00 ± 0.00, 0.95 ± 0.05, and 1.02 ± 0.03 (Figure 2B; n=24cells/3 slices, p=0.37). Interestingly, in 61% of cells examined (106/175 cells), the UTP-stimulated response was complex with an initial calcium transient followed by calcium oscillations that could be fused and led to a sustained increase in calcium (Figure 2A,C). Similar results were observed when the non-selective P2X and P2Y receptor agonist ATP was used (Figure 2C). In 3% of the cells exhibiting oscillatory calcium responses (6/175 cells), the cyclical oscillations persisted long after UTP had been washed away (Figure 2C, Ringer’s). 36% of sustentacular cells (63/175 cells) exhibited a single monophasic increase in intracellular calcium (see Figure 1E), and 3% (6/175) exhibited unfused oscillations in intracellular calcium (similar to top trace in Fig. 2C Ringer’s). Thus, sustentacular cells exhibit complex temporal patterns of calcium signaling upon purinergic stimulation.
Figure 2. Purinergic- evoked oscillatory calcium transients in sustentacular cells.
(A) Multiple applications of 10 μM UTP produce similar changes in intracellular calcium. ▲indicates time of UTP superfusion. In this figure and all subsequent figures, breaks in traces correspond to time when images were not collected. (B) Average normalized peak calcium transient amplitudes are not different from the predicted peak amplitude for the second application (□, mean ± s.e.m). (C) Representative traces showing oscillatory calcium transients evoked by the superfusion of 10 μM purinergic agonists ATP and UTP.
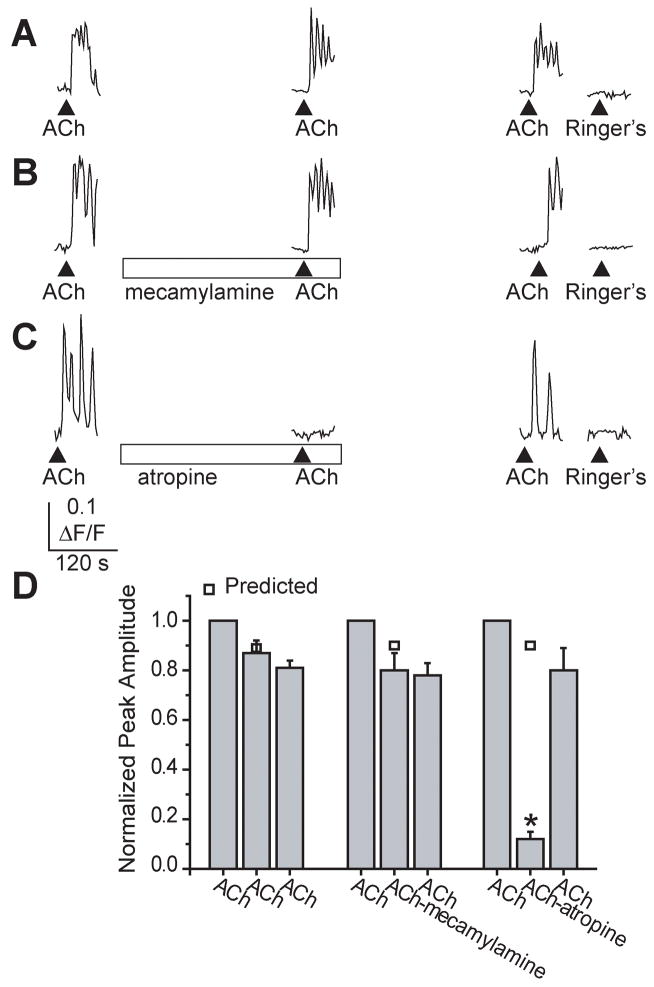
Multiple calcium transients and oscillations could also be evoked in sustentacular cells by 500 μM acetylcholine (ACh), an agonist to both muscarinic and nicotinic ACh receptors (Figure 3). In 55% of the cholinergically-stimulated sustentacular cells (21/38 cells), the calcium oscillations became fused leading to a sustained increase in calcium that eventually recovered to baseline (Figure 3A–C). The average normalized peak calcium amplitudes from 3 successive applications of ACh superfused 5 minutes apart were 1.00 ± 0.00, 0.87 ± 0.05, and 0.81 ± 0.03 (Figure 3A,D; n=7cells/3 slices, p=0.39). The nicotinic acetylcholine receptor antagonist mecamylamine (30 μM) had no significant effect on the amplitude of evoked calcium transients (80 ± 7% of control; Figure 3B,D; p=0.17, n=5cells/3 slices) but atropine (10 μM), a competitive antagonist to G-protein coupled muscarinic ACh receptors, significantly inhibited the calcium transients by 89% (11 ± 3% of control; Figure 3C,D; p<0.001; n=6 cells/3 slices). Thus, activation of G-protein coupled purinergic and muscarinic receptors evoked oscillatory calcium transients in sustentacular cells.
Figure 3. Acetylcholine-evoked oscillatory calcium transients in sustentacular cells.
(A–C) Oscillatory calcium transients evoked by the superfusion of 500 μM acetylcholine (ACh). (▲indicates time of ACh superfusion, □ indicates time of antagonist superfusion). (B, C) ACh-evoked calcium transients were inhibited by 10 μM atropine, a muscarinic antagonist, but not 30 μM mecamylamine, a competitive nicotinic antagonist. (D) Average normalized peak amplitudes are shown, as are the predicted peak amplitudes for the second application (□). *, p<0.001.
Purinergics evoke transient calcium increases via release from intracellular stores
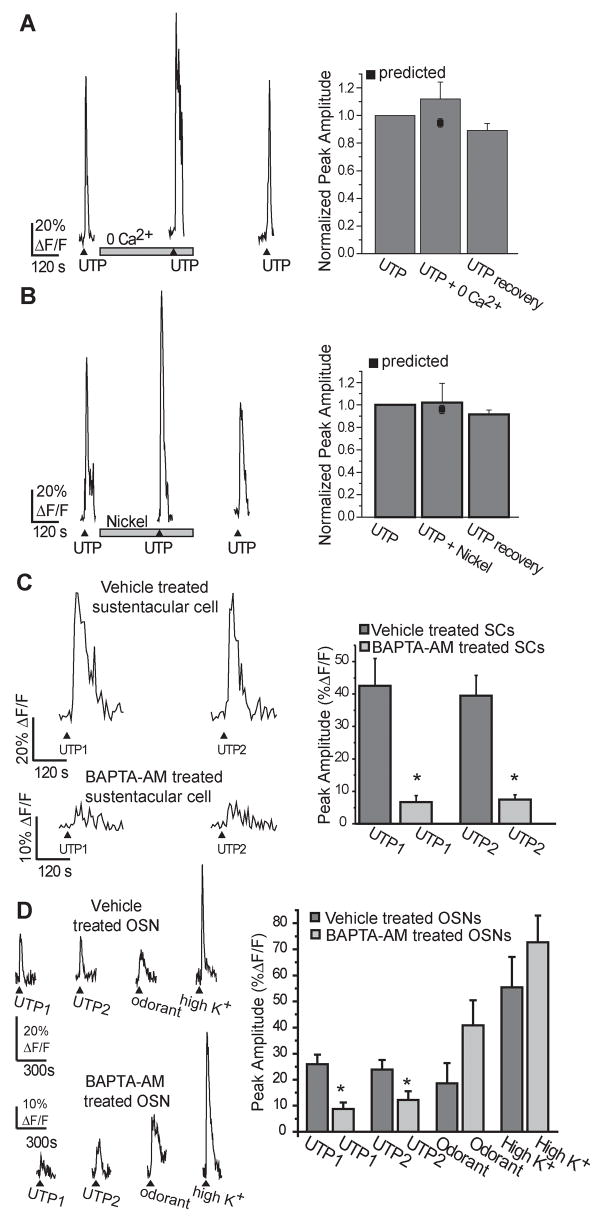
Increases in intracellular calcium can occur either by influx from the extracellular space or by release from intracellular calcium stores located within the endoplasmic reticulum (ER) (Berridge et al., 2000). We investigated the source of the intracellular calcium increase by comparing purinergic responses evoked in the presence and absence of extracellular calcium (Figure 4A). When the slice was superfused with calcium-free Ringer’s solution, the UTP-evoked calcium transients in sustentacular cells were not significantly different than in the presence of extracellular calcium (112 ± 9% of control, p=0.09, n=6 cells/3 slices), suggesting that increases in calcium were mainly mediated via activation of G-protein coupled P2Y receptors with subsequent release from intracellular stores. To further distinguish between release from calcium stores and calcium influx, we used the non-specific voltage-dependent calcium channel blocker nickel (Figure 4B). Nickel (100 μM) had no effect on the UTP-evoked calcium transients (103 ± 19% of control, p=0.71, n=5 cells/3 slices).
Figure 4. Purinergic evoked calcium transients are mediated via intracellular calcium.
(A,B) Slices were superfused with multiple applications of 10 μM UTP in (A) the absence of extracellular calcium (+ 4 mM EGTA) or (B) the presence of 100 μM nickel. (▲indicates time of UTP superfusion, □ indicates time of drug superfusion). Y axis is normalized peak amplitude. Right panels: Average normalized peak amplitudes are shown as are the predicted peak amplitudes for the second application (■). (C, D) Representative calcium transients from slices pre-treated with BAPTA-AM (100 μM) or vehicle (1% DMSO) in (C) sustentacular cells (SCs) or in (D) olfactory sensory neurons (OSNs). Right panels: average peak amplitudes + s.e.m. *, p<0.05.
To test whether intracellular calcium is required, we used the cell-permeable cytosolic calcium chelator BAPTA-AM to buffer the intracellular level of calcium. BAPTA-AM (100 μM) or vehicle (1% DMSO) was applied to slices for 1 hour prior to fluo-4 AM loading and calcium imaging to allow time for de-esterification of the AM component. Compared to the vehicle-treated slices, where two UTP applications evoked calcium transients that were on average 43 ± 8 and 39 ± 6 % ΔF/F (n=14 cells/4 slices), BAPTA-AM significantly reduced the UTP-induced calcium transients by 84 and 81% to 7 ± 2 and 7 ± 2 % ΔF/F (n=16 cells/5 slices, p<0.0001, independent t-Test, Figure 4C). Interestingly, exposure to BAPTA-AM reduced the main monophasic calcium transient, but did not entirely eliminate the oscillatory calcium increases. To ensure that the BAPTA-AM treatment was not damaging the OE, we also applied odorant (100 μM R-carvone) and elevated potassium Ringer’s solution (145 mM; high K+) to the same slices. Odorants bind to G-protein coupled odorant receptors on olfactory sensory neurons (OSNs), elevating cAMP levels, and opening cyclic nucleotide-gated channels, allowing calcium influx from the extracellular space. Likewise, elevated potassium depolarizes the OSNs opening voltage-gated calcium channels with subsequent calcium influx. We found that BAPTA-AM treatment had no effect on odorant (p=0.13, Independent t-Test) or depolarization-evoked (p=0.30) calcium responses in OSNs (n=10 OSNs/4 vehicle slices and 17 OSNs/5 BAPTA-AM treated slices; Figure 4D). As with the sustentacular cells, BAPTA treatment significantly reduced the UTP-evoked calcium transient in OSNs from 26 ± 4 and 24 ± 4% ΔF/F (n=14 cells/4 slices) to 11 ± 3 and 13 ± 3% ΔF/F (n=17 OSNs/5 slices, Independent t-tests, p=0.002 and 0.05).
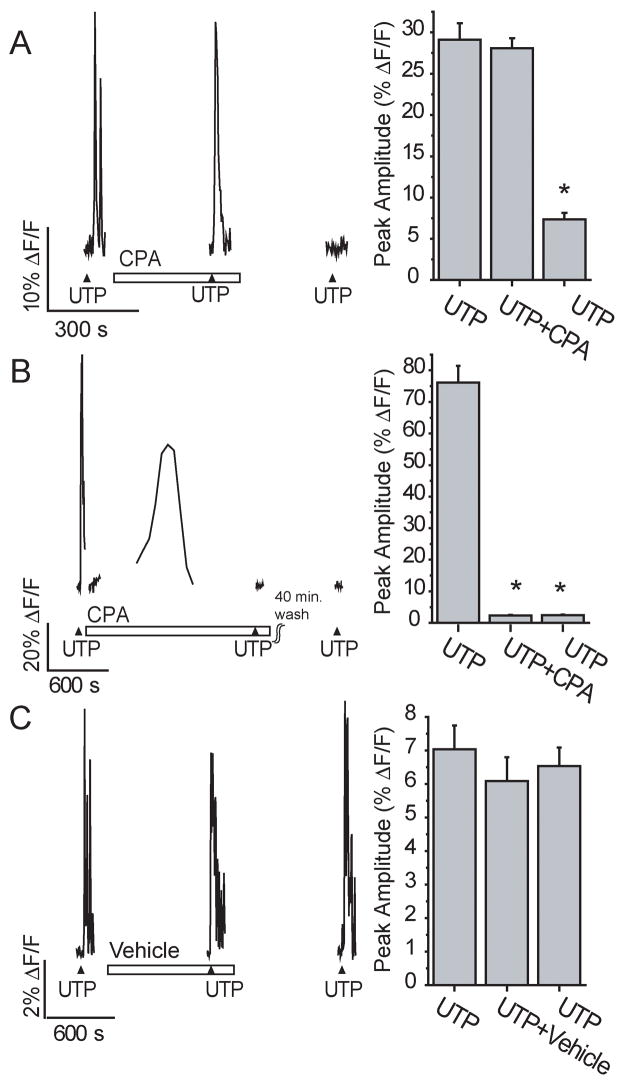
To further test whether intracellular calcium is required, we prevented the refilling of intracellular calcium stores with cyclopiazonic acid (CPA, 10 μM), a highly specific inhibitor of the endoplasmic reticulum Ca2+-ATPase. After a 5 minute application of CPA, the peak calcium response elicited by UTP was not significantly different than the initial control calcium transient (29.1 v. 28.1% ΔF/F, p=0.51, n=51 cells/3 slices, Figure 5A). However, none of the 51 cells had a recovery peak calcium transient that was greater than the 75% criteria to be included in the data set (7.4% ΔF/F, 25 ± 2% of initial control response, p<0.001). The slices were still viable after 5 minute CPA exposure as odorant responses from OSNs were still observed (27.2 ± 2.5% ΔF/F, n=20 OSNs/3 slices, data not shown). This suggested that CPA needed a longer exposure time to be more effective. Thus, we stopped the bath perfusion to prolong CPA application. The intracellular calcium concentrations were monitored every minute over a 15–30 minute period. As previously reported in glia (Simpson and Russell, 1997), CPA caused a delayed and prolonged increase in intracellular calcium levels that returned to baseline levels over a 30 minute period, presumably due to elevated intracellular calcium as the inhibited Ca2+-ATPase is unable to re-sequester calcium into stores, followed by a return to baseline calcium levels as the cell’s calcium buffering activity increases (Figure 5B). After the intracellular calcium levels had returned to baseline, the bath perfusion was started and UTP was applied in the maintained presence of CPA. CPA depletion of intracellular stores significantly reduced the UTP elicited calcium transient by 96% from 76.1 ± 5.4% ΔF/F to 2.3 ± 0.2% ΔF/F (p<0.001, n=59 cells/3 slices). Although CPA inhibition of the Ca2+-ATPase is reversible in other systems, CPA inhibition of the UTP-evoked calcium increase was irreversible in the OE slices, even after up to 75 minutes wash, with a peak UTP calcium transient of 2.4 ± 0.2% ΔF/F (p<0.001, n=59cells/3 slices, Figure 5B). Odorants were able to evoke an increase in calcium from OSNs 10 minutes after washout of CPA (data not shown), suggesting that the slices were still viable following chronic CPA exposure. In comparison, when slices were treated with vehicle (0.1% DMSO) under a similar protocol, 52% of the cells that responded to the initial UTP application (14/27) also responded to the third recovery UTP application 10–30 minutes post- wash with a peak calcium transient of 75% or greater. The vehicle-treated peak UTP-induced calcium transients were not significantly different with values of 7.0 ± 0.7, 6.1 ± 0.7, and 6.5 ± 0.5% ΔF/F, respectively (p> 0.3, n=14 cells/3 slices, Figure 5C). Collectively, with our previous report (Hegg et al., 2003), these data suggest that purinergics activate a P2Y receptor on sustentacular cells that evokes an increase in intracellular calcium via release from intracellular stores. Thus, for the rest of the study the selective G-protein coupled P2Y receptor agonist UTP was utilized.
Figure 5. Purinergic evoked calcium transients are mediated via intracellular calcium release.
Slices were superfused with multiple applications of 10 μM UTP in 5 min. acute (A) or 15–30 min. chronic (B,C) presence of 10 μM cyclopiazonic acid (CPA) or vehicle (0.1% DMSO). (▲ indicates time of UTP superfusion, □ indicates time of drug superfusion). Right panels: Average peak calcium transient amplitudes are shown *, p<0.001.
The phospholipase C pathway contributes to purinergic evoked increases in intracellular calcium
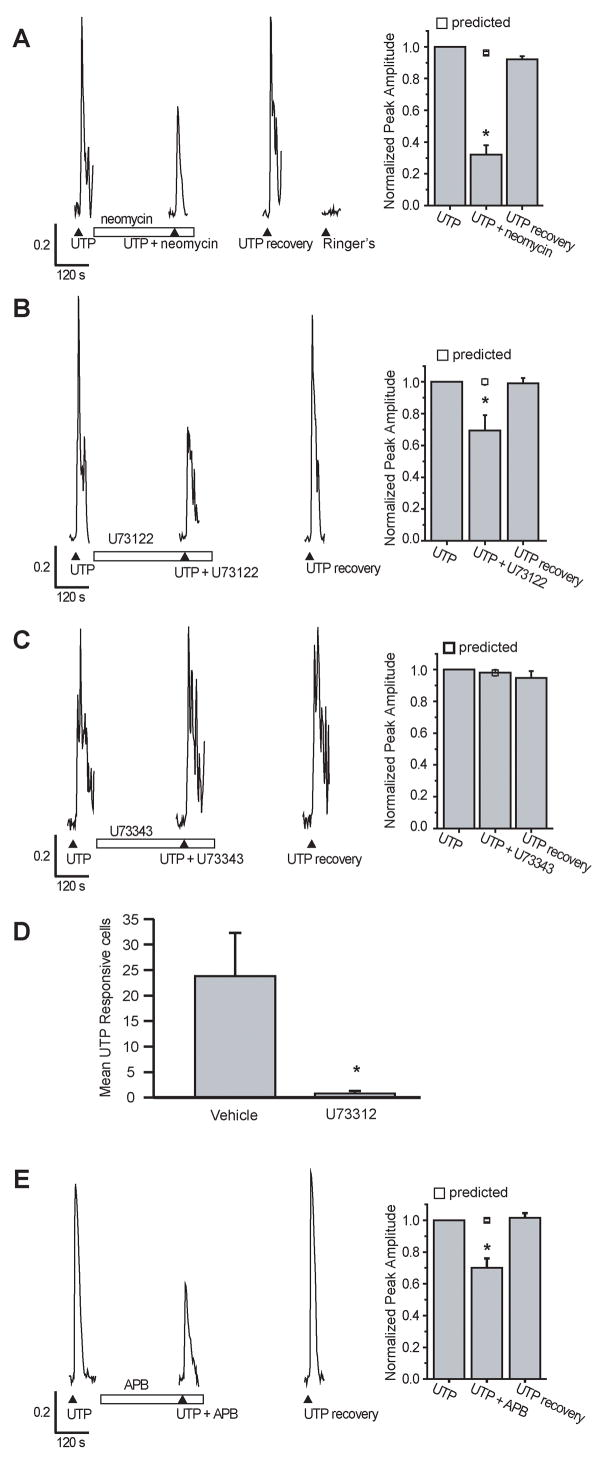
G-protein coupled receptor activation can trigger intracellular calcium increases via activation of phospholipase C (PLC) and subsequent production of IP3 and diacylglycerol (DAG). G-protein coupled receptor production of IP3 could evoke cyclical release of calcium from IP3-sensitive stores. We investigated the role of the PLC pathway by using the non-specific PLC antagonist neomycin, and the specific antagonist U73122. In the presence of neomycin, the UTP induced calcium transient was significantly reduced by 68 ± 6% (Figure 6A, n=34 cells/3 slices, p<0.001). Likewise, 5 min pre-incubation of U73312 (100 μM) inhibited the UTP-evoked calcium transient by 31 ± 9% (Figure 6B, n=20 cells/3 slices, p=0.01) whereas the inactive structural analog, U73343 (100 μM), did not have any effect on the UTP-evoked calcium transients (99 ± 4% of recovery, n=52 cells/3 slices; p=0.80, Figure 6C). Furthermore, slices incubated 20 min in U73312 (200 μM) were no longer responsive to UTP (Figure 6D). The mean number of UTP-responsive cells following U73312 treatment was 0.8 ± 0.5/slice and following vehicle treatment (0.1% DMSO) was 23.8 ± 8.5 (n=10 and 4 slices, p=0.0008). Both the U73312- and vehicle-treated slices showed normal odorant responses indicating that the slices were healthy. Co-application of UTP and 2-aminoethoxydiphenyl borate (2-APB; 100 μM), a membrane permeable antagonist of IP3-sensitive Ca2+ channels and store-operated Ca2+ entry, significantly inhibited UTP-evoked calcium transients by 30% (n=25 cells/3 slices, p<0.001, Figure 6E). Collectively, this suggests that the PLC pathway mediates the purinergic-evoked calcium increases.
Figure 6. The PLC pathway has a role in purinergic-evoked calcium increases.
(A–C, E) Slices were superfused with multiple applications of 10 μM UTP in the presence of (A) 150 μM neomycin, (B) 100 μM U73122, (C) 100 μM U73343, (E) 100 μM 2-APB. (▲indicates time of UTP superfusion, □ indicates time of drug superfusion). Y axis is normalized peak amplitude. Right panels: Average normalized peak amplitudes and the predicted peak amplitudes for the second application (v) are shown. *, p<0.01. (D) UTP responsive cells (mean ± s.e.m.) from slices incubated 20 min in 0.1% DMSO vehicle (n=4) or 200 μM U73122 (n=10, p=0.0008).
Involvement of calcium release channels
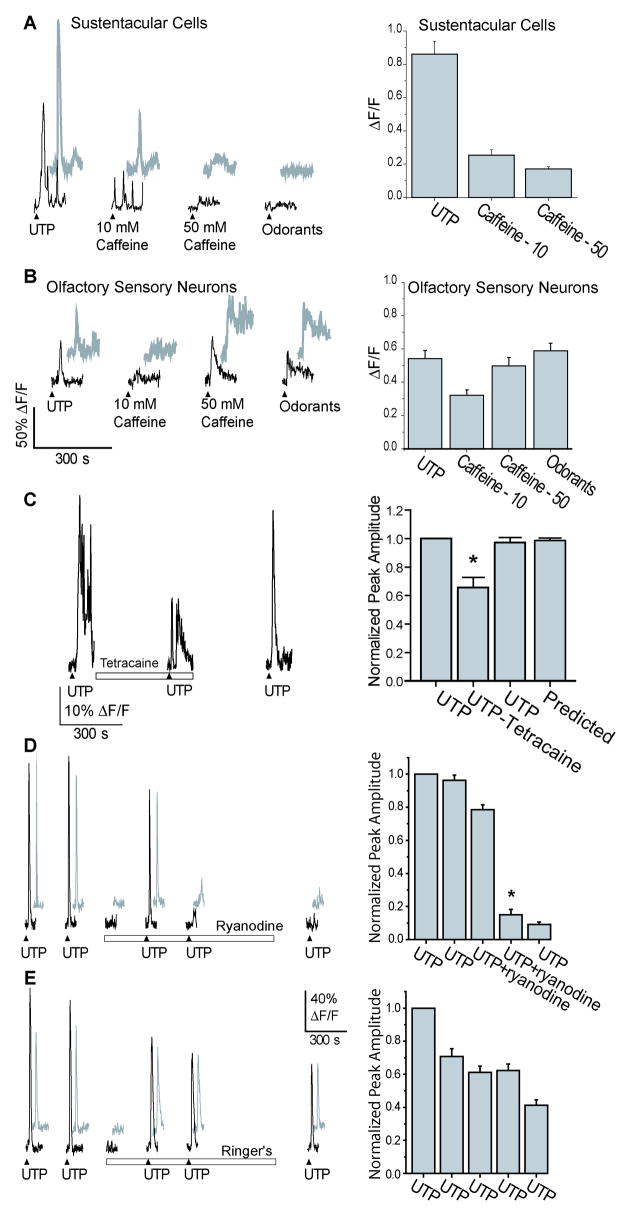
There are two families of calcium release channels located on the endoplasmic reticulum of most cells, the IP3 receptors and the ryanodine receptors (RyR) (Berridge et al., 2000), which could contribute to the UTP-induced increases in intracellular calcium. To examine the role of ryanodine receptors, caffeine, a RyR agonist at millimolar concentrations, was acutely superfused onto our OE slices (Figure 7A,B). Caffeine (10, 50 mM) induced transient increases in intracellular calcium in both OSNs and sustentacular cells (Table 1, n=5 slices). In sustentacular cells, the caffeine-induced calcium transients were significantly smaller than UTP-induced calcium increases (Table 1, p<0.001, Figure 7A,B). In contrast, in OSNs, only the 10 mM caffeine-induced calcium increase was significantly smaller than UTP-, 50 mM caffeine-, or odorant-induced calcium transients (Table 1, p<0.05, Figure 7A,B). These data suggest that sustentacular cells have smaller caffeine-sensitive stores than OSNs.
Figure 7. Involvement of the ryanodine receptor in sustentacular cell calcium signaling.
(A–B) Representative traces from 2 sustentacular (A) and 2 OSNs (B) during acute superfusion of caffeine (10–50 mM). (▲indicates time of UTP, caffeine, or odorant superfusion). Right panels: Average peak amplitudes are shown *, p<0.01. (C) Representative trace from a sustentacular cell superfused with UTP in the absence and presence of tetracaine (500 μM). (▲indicates time of UTP superfusion, □ indicates time of drug superfusion). Right panel: Average normalized peak amplitudes are shown as is the predicted peak amplitude for the second application. *, p<0.001. (D–E) Two representative traces from sustentacular cells repetitively superfused with UTP in the presence (D) or absence (E) of ryanodine (50 μM). (▲indicates time of UTP superfusion, □ indicates time of drug superfusion). Right panels: Average normalized peak amplitudes are shown.*, p<0.001.
Table 1.
Characteristics of caffeine-elicited calcium increases
| Sustentacular cells | OSNs | |||
|---|---|---|---|---|
| Number of responding cells | Peak amplitude (% ΔF/F) |
Number of responding cells | Peak amplitude (% ΔF/F) |
|
| UTP | 117/117 | 86 ± 8 | 33/68 | 54 ± 5 |
| 10 mM caffeine | 46/117 | 25 ± 3 ** | 33/68 | 32 ± 3 * |
| 50 mM caffeine | 41/117 | 17 ± 1** | 39/68 | 50 ± 5 |
| Odorants | Na | na | 64/68 | 59 ± 5 |
, ** significantly different from UTP;
, p<0.05;
, p<0.001; na, not applicable.
To examine the role of RyRs in purinergic-mediated sustentacular cell calcium oscillations, we used tetracaine, a non-specific antagonist of RyRs. Tetracaine (500 μM) significantly reduced the UTP-induced calcium transient to 66 ± 7% of the initial UTP calcium transient peak (Figure 7C, n = 19 cells/3 slices, p<0.001). As expected, tetracaine had an even greater effect on the oscillatory portion of the calcium response. We examined all cells in which UTP-evoked an oscillatory calcium transient, and compared the areas under the curves from the peak of the second calcium oscillation across repeated UTP applications. In control studies, the second UTP application actually increased the area under curve to 204 ± 25% of the initial UTP response (n=17 cells from 2 slices; data not shown). In the presence of tetracaine, the area under the curve was significantly reduced to 51 ± 4% of the initial UTP transient’s area under the curve (n=19 cells from 3 slices, p<0.0001).
Ryanodine was used to further ascertain the role of RyRs in purinergic-mediated calcium signaling (Figure 7D). In these experiments, two control UTP-induced calcium transients were elicited with normalized peak heights of 1.0 ±0.0 and 0.96 ± 0.03. Multiple UTP responses were elicited in the presence of 50 μM ryanodine. Ryanodine had no effect on the first UTP-evoked calcium transient with a peak height of 0.79 ±0.03. However, the second UTP response was reduced to 0.15 ± 0.03 (n=19 cells/2 slices, p<0.001), and subsequent UTP responses remained reduced, even following washout (peak height=0.09 ± 0.01). In comparison, in Ringer’s control solution, UTP application elicited five similar calcium transients with normalized peak heights of 1.0 ±0, 0.71±0.05, 0.61± 0.04, 0.62 ± 0.04, and 0.41 ± 0.03 (Figure 7E, n=26 cells/2 slices). The difference in peak heights between the UTP-induced calcium transients elicited in the presence of ryanodine was significantly greater than the difference in peak heights elicited in Ringer’s control (p<0.001). These data suggest that ryanodine may bind to ryanodine receptors only after they have been activated. In this case, the first UTP application in the presence of ryanodine evokes calcium induced calcium release (CICR), activating RyRs and allows ryanodine to inhibit RyRs. Alternatively, ryanodine may partially activate RyRs and deplete calcium stores. With either mechanism, subsequent UTP-evoked calcium transients are reduced, suggesting that RyRs contribute to the UTP-evoked calcium signaling. Collectively, these data suggest that both IP3 receptors and ryanodine receptors are involved in G-protein coupled receptor evoked intracellular calcium increases.
Discussion
Historically, sustentacular cells have been thought of as epithelial support cells, but evidence is mounting to suggest that they are also glial-like. Using confocal calcium imaging of neonatal mouse olfactory epithelium slices, we observed spontaneous intercellular calcium waves and intracellular calcium oscillations in sustentacular cells that are characteristic of glial calcium signaling.
Intercellular and intracellular calcium waves in sustentacular cells
Sustentacular cells may be chemically coupled and may propagate increases in intracellular calcium between cells via gap junctions. Both ultrastructural (Breipohl et al., 1974; Menco, 1988) and immunocytochemical (Miragall et al., 1992; Zhang and Restrepo, 2002; Rash et al., 2005) evidence supports that sustentacular cells form gap junctions with each other in the apical zone at all stages of development. Our recent electrophysiological study (Vogalis et al., 2005a) explored the presence of gap junctions in mouse sustentacular cells. We found evidence for unopposed gap junction channels, or hemichannels, and electrical coupling between sustentacular cells. There are several possible intracellular messengers that could participate in the generation and propagation of intercellular calcium waves, including IP3 and calcium itself. These factors may diffuse through gap junctions to neighboring cells and potentially trigger calcium release therein. It is also possible that a released factor, such as ATP, diffuses extracellularly to neighboring cells and stimulates cell-surface G-protein coupled receptors. In this way, the propagation of the intercellular calcium wave may depend on both intracellular and extracellular signals. Detailed characterization of intercellular wave propagation in sustentacular cells will be addressed in future studies.
Spontaneous and purinergic-evoked intracellular calcium waves were measured on occasions when the dye loaded from apex to base of the OE. The UTP-induced calcium transient initiated in the apical portion of the sustentacular cell and travelled to the basal cell layer at a speed ranging from 6–77 μm/s, similarly to that reported in sustentacular cells of Xenopus laevis tadpoles (Hassenklover et al., 2008).
G-protein coupled receptors evoke intracellular calcium oscillations
We routinely observed the second main form of glial calcium signaling, intracellular calcium oscillations, in sustentacular cells. We only observed calcium responses to agonists of purinergic and cholinergic metabotropic receptors on sustentacular cells, although we have screened a number of bioactive compounds, including norepinephrine, serotonin, GABA, glutamate, and histamine. It is possible that a faster stimulus delivery system would reveal other rapidly desensitizing receptor-mediated responses. We observed a variety of temporal patterns of sustentacular cell intracellular calcium increases. As in glia (Verkhratsky and Kettenmann, 1996), the time course of the increase was either a single spike, a transient followed by fused oscillations, or oscillations. Previous reports have shown that stimulation of metabotropic receptors evokes oscillatory increases in intracellular calcium in glia (Charles et al., 1991; Cornell-Bell and Finkbeiner, 1991; Kim et al., 1994).
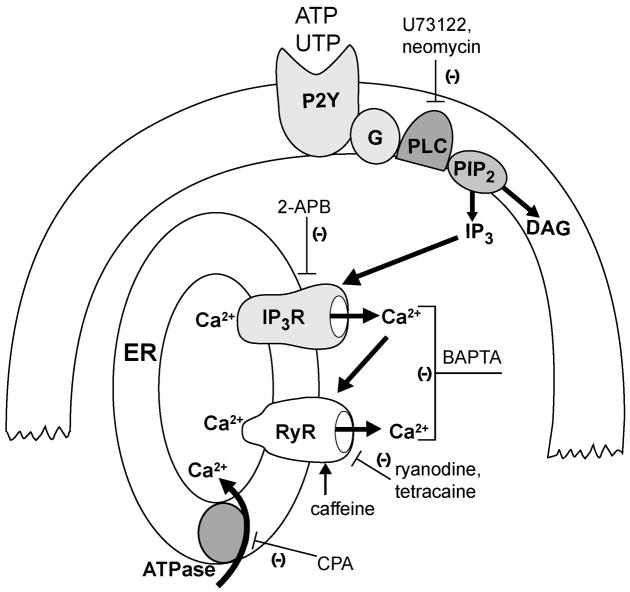
We pharmacologically investigated the mechanism involved in UTP-mediated increases in intracellular calcium (Figure 8). We saw no change in calcium responses in the absence of calcium from the extracellular solution, whereas when intracellular calcium stores were depleted with cyclopiazonic acid, the UTP-induced calcium transient was completely abolished, suggesting an intracellular calcium source. G-protein coupled receptor (GPCR) activation can trigger intracellular calcium increases via activation of phospholipase C (PLC) and subsequent production of IP3 and DAG. Inhibitors of the PLC pathway (neomycin, U73122) attenuated the UTP-elicited increase in calcium. Inhibitors of the IP3 receptor reduced the UTP-elicited calcium increase, suggesting that IP3 activation of the IP3 receptor releases calcium from stores. Chronic exposure to the membrane-permeant calcium chelator BAPTA-AM, which rapidly buffers cytosolic calcium, reduced both the main monophasic calcium transient and the oscillatory calcium increases induced by UTP. This suggests that under normal conditions, there is tight coupling between IP3-induced calcium release from stores and activation of CICR from ryanodine receptors located on the endoplasmic reticulum. Indeed, inhibition of ryanodine receptors reduced the UTP-mediated peak calcium transient and decreased the amount of calcium released following the initial peak. Our data points to a role for both ryanodine and IP3 receptors in producing the main monophasic increase in intracellular calcium, as well as the oscillatory increases in calcium.
Figure 8. Mechanism of G-protein coupled receptor calcium mobilization.
Activation of GPCRs activates phospholipase C and production of DAG and IP3. IP3 activates the IP3 receptor with subsequent release of calcium from stores. The increase in cytosolic calcium induces calcium-dependent calcium release via the ryanodine receptor. Large arrows depict pathway of GPCR activation, and thin lines depict pharmacological targets. Abbreviations: 2-APB, 2-aminoethoxydiphenyl borate; ATPase, Ca2+-ATPase; CPA, cyclopiazonic acid; DAG, diacylglycerol; ER, endoplasmic reticulum; GPCR, G-protein coupled receptor; G, G protein; IP3R, IP3 receptor; PLC, phospholipase C; PIP2, phosphoinositols; RyR, ryanodine receptor.
Physiological significance of oscillatory calcium transients
The increases in intracellular calcium that occur in individual cells or as intercellular waves propagating through many cells are very similar to that which occurs in glia in the CNS. Glial calcium signaling has been implicated in a variety of physiological and pathological processes (Kurosinski and Gotz, 2002), including modulation of neuronal synaptic signaling (Hansson and Ronnback, 2003), modulation of the response of the retina to light (Newman, 2004), slowly propagated pathological phenomena such as spreading depression (Lian and Stringer, 2004), and the multicellular response to localized injury (Kelley and Steward, 1997).
Dynamic intracellular calcium fluxes in sustentacular cells can serve as many different signals in the olfactory epithelium. Intracellular calcium fluxes may govern secretion, proliferation and development in sustentacular cells, and, via calcium-dependent exocytosis, may release chemical signals to basal cells, neuronal precursors, or neurons. Transient increases in intracellular calcium have been reported in sustentacular cells of Xenopus laevis tadpoles and are proposed to mediate vesicle release which could modify mucus composition and modulate odorant sensitivity (Czesnik et al., 2006). It has been proposed that released ATP modulates the odorant sensitivity of both OSNs (Hegg et al., 2003) and trigeminal afferents (Spehr et al., 2004). Thus, calcium signals in sustentacular cells could play a role in setting the general excitability of the OE.
Calcium oscillations can serve as a developmental signal. All recordings in this study were performed in neonates, and it could be that, as with glia in CNS, the oscillations occur preferentially during neonatal development. The calcium fluxes could be a signal for cell turnover as calcium oscillations and waves in glia are important in regulating cell turnover, or neurogenesis (Weissman et al., 2004). In the olfactory system, the signals for injury-evoked regeneration are unknown; however, both positive and negative feedback signals have been proposed to play a role. In negative regulation of neurogenesis, a signal expressed in OSNs, such as GDF11 (Wu et al., 2003), inhibits proliferation and generation of new neurons in the OE. Thus, destruction of OSNs removes the source of the inhibitory anti-proliferative signal, and promotes neuronal regeneration. Additionally, in positive regulation of neurogenesis, dead and dying OSNs or their neighboring sustentacular cells can release growth-promoting factors that initiate proliferation (Bauer et al., 2003). Secreted neurotrophic factors or stress factors, such as ATP, could activate receptors on sustentacular cells thereby inducing calcium oscillations. The oscillating calcium transients could act as a chemical signal to induce calcium-dependent exocytosis of growth factors onto progenitor or immature neurons.
Recent discoveries of voltage-gated channels, receptors, and transmitter release in both peripheral and central glial cells suggest direct communication between neurons and glia. The identification of similar components in sustentacular cells suggests that, like their glial counterparts, they are capable of rapid communication between themselves and the neural elements of the olfactory epithelium. Cell-attached patch recording revealed that murine sustentacular cells have calcium-dependent K+ channels that oscillate in activity, presumably following the intracellular calcium oscillations (Vogalis et al., 2005b). Voltage-gated Na+ channels in sustentacular cells generate action potentials following sufficient hyperpolarization (Vogalis et al., 2005b). Thus, the oscillatory intracellular calcium signal may be translated to an electrical membrane signal through K+ and Na+ channels. Electrical signaling along sustentacular cells provides a rapid way to send information from the apical to basal reaches of the olfactory epithelium. It was previously suggested that sustentacular cells form a network for intercellular communication within the sensory epithelium (Masukawa et al., 1983). The sustentacular cell syncytium may utilize specific calcium oscillations to decode the position and strength of various stimuli, and thus integrate and coordinate multicellular functions. Our findings point to a key role for sustentacular cells in integrating communication between neurons, basal cells and sustentacular cells themselves.
Acknowledgments
This work was supported by NIH DC006897 (CCH) and NIH DC002944 (MTL).
References
- Bannister LH, Dodson HC. Endocytic pathways in the olfactory and vomeronasal epithelia of the mouse: ultrastructure and uptake of tracers. Microsc Res Tech. 1992;23:128–141. doi: 10.1002/jemt.1070230204. [DOI] [PubMed] [Google Scholar]
- Bauer S, Rasika S, Han J, Mauduit C, Raccurt M, Morel G, Jourdan F, Benahmed M, Moyse E, Patterson PH. Leukemia inhibitory factor is a key signal for injury-induced neurogenesis in the adult mouse olfactory epithelium. J Neurosci. 2003;23:1792–1803. doi: 10.1523/JNEUROSCI.23-05-01792.2003. [DOI] [PMC free article] [PubMed] [Google Scholar]
- Berridge MJ, Lipp P, Bootman MD. The versatility and universality of calcium signalling. Nat Rev Mol Cell Biol. 2000;1:11–21. doi: 10.1038/35036035. [DOI] [PubMed] [Google Scholar]
- Breipohl W, Laugwitz HJ, Bornfeld N. Topological relations between the dendrites of olfactory sensory cells and sustentacular cells in different vertebrates. An ultrastructural study. J Anat. 1974;117:89–94. [PMC free article] [PubMed] [Google Scholar]
- Charles AC, Merrill JE, Dirksen ER, Sanderson MJ. Intercellular signaling in glial cells: calcium waves and oscillations in response to mechanical stimulation and glutamate. Neuron. 1991;6:983–992. doi: 10.1016/0896-6273(91)90238-u. [DOI] [PubMed] [Google Scholar]
- Cornell-Bell AH, Finkbeiner SM. Ca2+ waves in astrocytes. Cell Calcium. 1991;12:185–204. doi: 10.1016/0143-4160(91)90020-f. [DOI] [PubMed] [Google Scholar]
- Czesnik D, Kuduz J, Schild D, Manzini I. ATP activates both receptor and sustentacular supporting cells in the olfactory epithelium of Xenopus laevis tadpoles. Eur J Neurosci. 2006;23:119–128. doi: 10.1111/j.1460-9568.2005.04533.x. [DOI] [PubMed] [Google Scholar]
- Dahl AR. The effect of cytochrome P-450-dependent metabolism and other enzyme activities on olfaction. In: Margolis FL, Getchell TV, editors. Molecular Neurobiology of the Olfactory System. New York: Plenum Press; 1988. pp. 51–70. [Google Scholar]
- Dahl AR, Hadley WM, Hahn FF, Benson JM, McClellan RO. Cytochrome P-450-dependent monooxygenases in olfactory epithelium of dogs: possible role in tumorigenicity. Science. 1982;216:57–59. doi: 10.1126/science.7063870. [DOI] [PubMed] [Google Scholar]
- Di VF, Steinberg TH, Silverstein SC. Inhibition of Fura-2 sequestration and secretion with organic anion transport blockers. Cell Calcium. 1990;11:57–62. doi: 10.1016/0143-4160(90)90059-4. [DOI] [PubMed] [Google Scholar]
- Elsaesser R, Montani G, Tirindelli R, Paysan J. Phosphatidyl-inositide signalling proteins in a novel class of sensory cells in the mammalian olfactory epithelium. Eur J Neurosci. 2005;21:2692–2700. doi: 10.1111/j.1460-9568.2005.04108.x. [DOI] [PubMed] [Google Scholar]
- Elsaesser R, Paysan J. The sense of smell, its signalling pathways, and the dichotomy of cilia and microvilli in olfactory sensory cells. BMC Neurosci. 2007;8:S1. doi: 10.1186/1471-2202-8-S3-S1. [DOI] [PMC free article] [PubMed] [Google Scholar]
- Getchell TV. Analysis of intracellular recordings from salamander olfactory epithelium. Brain Res. 1977;123:275–286. doi: 10.1016/0006-8993(77)90479-6. [DOI] [PubMed] [Google Scholar]
- Getchell TV. Functional properties of vertebrate olfactory receptor neurons. Physiol Rev. 1986;66:772–818. doi: 10.1152/physrev.1986.66.3.772. [DOI] [PubMed] [Google Scholar]
- Hansel DE, Eipper BA, Ronnett GV. Neuropeptide Y functions as a neuroproliferative factor. Nature. 2001;410:940–944. doi: 10.1038/35073601. [DOI] [PubMed] [Google Scholar]
- Hansson E, Ronnback L. Glial neuronal signaling in the central nervous system. FASEB J. 2003;17:341–348. doi: 10.1096/fj.02-0429rev. [DOI] [PubMed] [Google Scholar]
- Hassenklover T, Kurtanska S, Bartoszek I, Junek S, Schild D, Manzini I. Nucleotide-induced Ca(2+) signaling in sustentacular supporting cells of the olfactory epithelium. Glia. 2008 doi: 10.1002/glia.20714. [DOI] [PubMed] [Google Scholar]
- Hegg CC, Greenwood D, Huang W, Han P, Lucero MT. Activation of purinergic receptor subtypes modulates odor sensitivity. J Neurosci. 2003;23:8291–8301. doi: 10.1523/JNEUROSCI.23-23-08291.2003. [DOI] [PMC free article] [PubMed] [Google Scholar]
- Hegg CC, Lucero MT. Purinergic receptor antagonists inhibit odorant-induced heat shock protein 25 induction in mouse olfactory epithelium. Glia. 2006;53:182–190. doi: 10.1002/glia.20258. [DOI] [PMC free article] [PubMed] [Google Scholar]
- Kelley MS, Steward O. Injury-induced physiological events that may modulate gene expression in neurons and glia. Rev Neurosci. 1997;8:147–177. doi: 10.1515/revneuro.1997.8.3-4.147. [DOI] [PubMed] [Google Scholar]
- Kim WT, Rioult MG, Cornell-Bell AH. Glutamate-induced calcium signaling in astrocytes. Glia. 1994;11:173–184. doi: 10.1002/glia.440110211. [DOI] [PubMed] [Google Scholar]
- Kurosinski P, Gotz J. Glial cells under physiologic and pathologic conditions. Arch Neurol. 2002;59:1524–1528. doi: 10.1001/archneur.59.10.1524. [DOI] [PubMed] [Google Scholar]
- Lian XY, Stringer JL. Astrocytes contribute to regulation of extracellular calcium and potassium in the rat cerebral cortex during spreading depression. Brain Res. 2004;1012:177–184. doi: 10.1016/j.brainres.2004.04.011. [DOI] [PubMed] [Google Scholar]
- Manzini I, Schweer TS, Schild D. Improved fluorescent (calcium indicator) dye uptake in brain slices by blocking multidrug resistance transporters. J Neurosci Methods. 2008;167:140–147. doi: 10.1016/j.jneumeth.2007.07.018. [DOI] [PubMed] [Google Scholar]
- Masukawa LM, Kauer JS, Shepherd GM. Intracellular recordings from two cell types in an in vitro preparation of the salamander olfactory epithelium. Neurosci Lett. 1983;35:59–64. doi: 10.1016/0304-3940(83)90527-x. [DOI] [PubMed] [Google Scholar]
- Menco BP. Tight-junctional strands first appear in regions where three cells meet in differentiating olfactory epithelium: a freeze-fracture study. J Cell Sci. 1988;89:495–505. doi: 10.1242/jcs.89.4.495. [DOI] [PubMed] [Google Scholar]
- Menco BP, Morrison EE. Morphology of the mammalian olfactory epithelium: Form, Fine structure and pathology. In: Doty R, editor. Handbook of Olfaction and Gustation. New York: Marcel Dekker; 2003. pp. 17–49. [Google Scholar]
- Miragall F, Hwang TK, Traub O, Hertzberg EL, Dermietzel R. Expression of connexins in the developing olfactory system of the mouse. J Comp Neurol. 1992;325:359–378. doi: 10.1002/cne.903250304. [DOI] [PubMed] [Google Scholar]
- Newman EA. Glial modulation of synaptic transmission in the retina. Glia. 2004;47:268–274. doi: 10.1002/glia.20030. [DOI] [PMC free article] [PubMed] [Google Scholar]
- Okano M, Takagi SF. Secretion and electrogenesis of the supporting cell in the olfactory epithelium. J Physiol Lond. 1974;242:353–370. doi: 10.1113/jphysiol.1974.sp010711. [DOI] [PMC free article] [PubMed] [Google Scholar]
- Rafols JA, Getchell TV. Morphological relations between the receptor neurons, sustentacular cells and Schwann cells in the olfactory mucosa of the salamander. Anat Rec. 1983;206:87–101. doi: 10.1002/ar.1092060111. [DOI] [PubMed] [Google Scholar]
- Rash JE, Davidson KG, Kamasawa N, Yasumura T, Kamasawa M, Zhang C, Michaels R, Restrepo D, Ottersen OP, Olson CO, Nagy JI. Ultrastructural localization of connexins (Cx36, Cx43, Cx45), glutamate receptors and aquaporin-4 in rodent olfactory mucosa, olfactory nerve and olfactory bulb. J Neurocytol. 2005;34:307–341. doi: 10.1007/s11068-005-8360-2. [DOI] [PMC free article] [PubMed] [Google Scholar]
- Simpson PB, Russell JT. Role of sarcoplasmic/endoplasmic-reticulum Ca2+-ATPases in mediating Ca2+ waves and local Ca2+-release microdomains in cultured glia. Biochem J. 1997;325:239–247. doi: 10.1042/bj3250239. [DOI] [PMC free article] [PubMed] [Google Scholar]
- Spehr J, Spehr M, Hatt H, Wetzel CH. Subunit-specific P2X-receptor expression defines chemosensory properties of trigeminal neurons. Eur J Neurosci. 2004;19:2497–2510. doi: 10.1111/j.0953-816X.2004.03329.x. [DOI] [PubMed] [Google Scholar]
- Suzuki Y, Takeda M, Farbman AI. Supporting cells as phagocytes in the olfactory epithelium after bulbectomy. J Comp Neurol. 1996;376:509–517. doi: 10.1002/(SICI)1096-9861(19961223)376:4<509::AID-CNE1>3.0.CO;2-5. [DOI] [PubMed] [Google Scholar]
- Verkhratsky A, Kettenmann H. Calcium signalling in glial cells. Trends Neurosci. 1996;19:346–352. doi: 10.1016/0166-2236(96)10048-5. [DOI] [PubMed] [Google Scholar]
- Vogalis F, Hegg CC, Lucero MT. Electrical coupling in sustentacular cells of the mouse olfactory epithelium. J Neurophysiol. 2005a;94:1001–1012. doi: 10.1152/jn.01299.2004. [DOI] [PubMed] [Google Scholar]
- Vogalis F, Hegg CC, Lucero MT. Ionic conductances in sustentacular cells of the mouse olfactory epithelium. J Physiol. 2005b;562:785–799. doi: 10.1113/jphysiol.2004.079228. [DOI] [PMC free article] [PubMed] [Google Scholar]
- Weissman TA, Riquelme PA, Ivic L, Flint AC, Kriegstein AR. Calcium waves propagate through radial glial cells and modulate proliferation in the developing neocortex. Neuron. 2004;43:647–661. doi: 10.1016/j.neuron.2004.08.015. [DOI] [PubMed] [Google Scholar]
- Wu HH, Ivkovic S, Murray RC, Jaramillo S, Lyons KM, Johnson JE, Calof AL. Autoregulation of neurogenesis by GDF11. Neuron. 2003;37:197–207. doi: 10.1016/s0896-6273(02)01172-8. [DOI] [PubMed] [Google Scholar]
- Zhang C, Restrepo D. Expression of connexin 45 in the olfactory system. Brain Res. 2002;929:37–47. doi: 10.1016/s0006-8993(01)03372-8. [DOI] [PubMed] [Google Scholar]


