Abstract
Interfacial water has unique properties in various functions. Here, using 4-dimensional (4D), ultrafast electron crystallography with atomic-scale spatial and temporal resolution, we report study of structure and dynamics of interfacial water assembly on a hydrophobic surface. Structurally, vertically stacked bilayers on highly oriented pyrolytic graphite surface were determined to be ordered, contrary to the expectation that the strong hydrogen bonding of water on hydrophobic surfaces would dominate with suppressed interfacial order. Because of its terrace morphology, graphite plays the role of a template. The dynamics is also surprising. After the excitation of graphite by an ultrafast infrared pulse, the interfacial ice structure undergoes nonequilibrium “phase transformation” identified in the hydrogen-bond network through the observation of structural isosbestic point. We provide the time scales involved, the nature of ice-graphite structural dynamics, and relevance to properties related to confined water.
Keywords: hydrophilic and hydrophobic interactions, ice-substrate structure and dynamics, nonequilibrium phase transition
Water at interfaces is fundamental to the understanding of various phenomena, such as wetting, molecular recognition and macromolecular folding. When compared with bulk phases (1, 2), the nano-scale interface is believed to have a unique function in nanotribology (3, 4), chemical reactivity (4–6) and biological structure and dynamics (7–10). From the structural point of view, considering the energetics, the determining factor at interfaces is the delicate balance of hydrogen bonding among water molecules and the comparable interactions with a substance, defining the 2 extremes of hydrophobic and hydrophilic behavior. However, the time scales of structural dynamics are important for defining the microscopic mechanisms of relaxations and the role of substrate structure and morphology (11). For water ice on a hydrophilic substrate, the ordered layers are evidenced by their diffraction (Bragg spots), and this long-range order is lost when the ice assembly becomes at a distance from the substrate (12). On hydrophobic surfaces, the expected picture is that randomly oriented crystallites form with no interfacial long-range order, because of the stronger intermolecular interactions when compared with those of water-substrate.
In the current study, we report the determination of structure and dynamical behavior of water assembly on highly oriented pyrolytic graphite (HOPG), a hydrophobic substrate. Using ultrafast electron crystallography (UEC) (11) that has been described in detail in refs. 12 and 13, provides, through diffraction, the position of atomic planes and the temporal change of the structure. Electron crystallography (14), because of the large electron scattering cross section, is ideal for these surface and interface probings. Here, it is shown that the layered structure of HOPG serves as a substrate and promotes the crystalline order in the ice thin film along the surface normal direction. Upon heating the substrate by an infrared femtosecond pulse, the interfacial ice assembly goes through nonequilibrium phase transformation, into a highly expanded lattice, a dynamical behavior evidenced by the appearance of a “structural isosbestic point” in the diffraction profiles. The ice “melting” time is 10 ps and the new phase grows in 20 ps, whereas the restructuring time is significantly longer, being 75 and 390 ps. From the intense Bragg (spot) diffraction, it is concluded that ice on hydrophobic graphite has a high degree of order on the nanometer scale (and also in the expanded state) similar to that reported on a hydrophilic substrate (12). This finding suggests the important role of surface morphology.
Results and Discussion
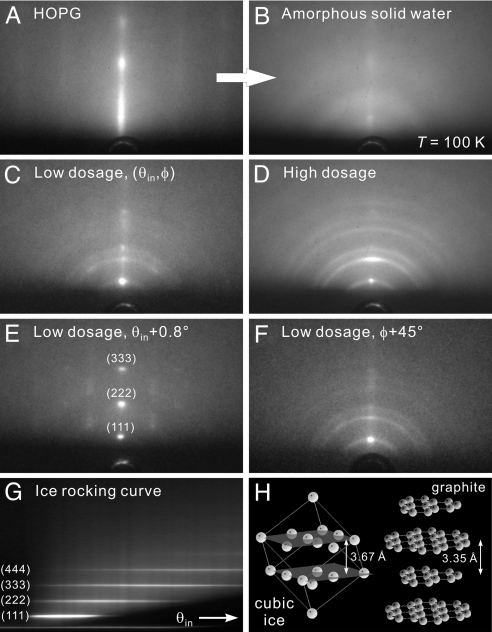
In Fig. 1, we display the diffraction patterns obtained in the absence of the T-jump. The bare substrate shows an intense, intensity-modulated diffraction rod in the center and faint ones on the sides, indicating the regular vertical stacking of graphite sheets and the lack of long-range (micrometer scale) horizontal orientation (Fig. 1A). With water molecules immobilized on the surface at T = 100 K, the graphite pattern becomes weaker and is replaced by diffuse scattering from the initially formed amorphous phase (Fig. 1B); its thickness, depending on dose time, is on the order of 10 nm, which was estimated from the electron penetration depth at 30 keV. Crystallization of the amorphous film begins at ≈135 K, which is close to the reported transition temperature (1, 2). Completion of crystallization occurs at ≈145–150 K, and total sublimation at near 150–160 K, both depending on the film thickness.
Fig. 1.
Diffraction patterns of ice on hydrophobic graphite at various conditions. (A) Diffractio pattern of a freshly cleaved HOPG surface. The grazing incidence and nanometer depth of electron probing give rise to the rod-like pattern. (B) Diffraction pattern at the same probing condition as A after the deposition of water molecules at a surface temperature of T = 100 K. The diffuse scattering without distinct diffraction features indicates that the water assembly is in an amorphous state. (C) Diffraction pattern from a thin interfacial water layer after its crystallization into an ice assembly through thermal annealing. The most distinct diffraction feature is the intense Bragg spot at the center, signifying an ordered structure along the surface normal direction. (D) The pattern from a thicker ice assembly at the same probing condition as C. Although the central Bragg spot is still apparent, a Debye–Scherrer ring pattern becomes clearly evident, indicating that the ice crystallites away from the substrate surface are randomly oriented. (E) The pattern from a thin ice assembly at a larger incidence angle (θin + 0.8°). Higher orders of the original (111) Bragg spot are now apparent. (F) The pattern from a thin ice assembly at a different azimuthal angle (φ + 45°), by rotating the substrate. From such an azimuthal search, the lack of other spots except for the original central one reflects the lack of a horizontal orientation order in the ice structure. (G) Rocking curve for a thin ice assembly obtained by collecting the central rod area of diffraction patterns as a function of θin. The equally spaced streaks are indicative of an ordered vertical stacking of ice. (H) Structures of cubic ice (hydrogen atoms are omitted) and graphite. See Results and Discussion for details.
The crystallized ice layers show intriguing diffraction patterns. For smaller thickness layers, an intense Bragg spot appears at the middle of the first Debye–Scherrer ring, together with a weak ring pattern that indicates the existence of some randomly oriented ice crystallites (Fig. 1C). Higher orders of this intense Bragg spot can be seen in the rocking curve at larger incidence angles, θin (Fig. 1 E and G). No other spots can be found during the azimuthal (φ) rotation of the substrate (Fig. 1F), which reflects the lack of a horizontal orientation order in the ice assembly (13). For a thicker layer structure, the diffraction ring pattern intensifies and the aforementioned Bragg spot on the first ring, although less intense, is still apparent (Fig. 1D). These results are in sharp contrast with the many-spot pattern observed from the ordered crystalline ice on a hydrophilic surface (12), and with the pure ring pattern observed from the randomly oriented polycrystalline ice on other hydrophobic surfaces, such as hydrogen-terminated silicon (work to be published), or when water is away from the surface (12).
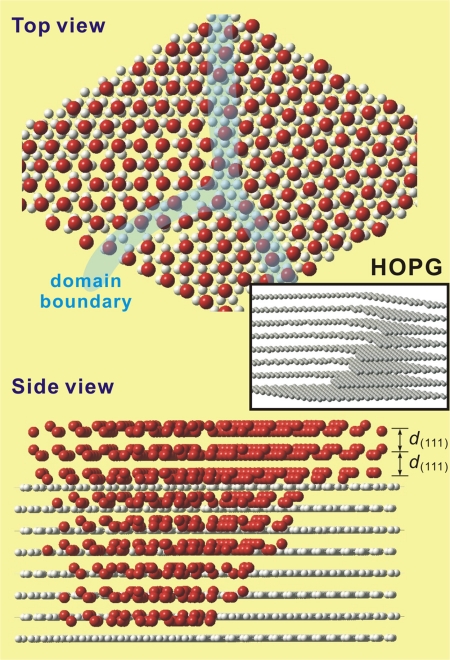
To determine the structure of ice, radial averaging of the diffraction rings was made. The 1-dimensional diffraction intensity profile, with its distinct peaks, matches well with the theoretically derived profile of cubic-ice structure Ic, giving a lattice constant of a = 6.36 Å; the hexagonal structure Ih was excluded because of its different pattern (12). The enhancement of rings in diffraction from a thicker adsorbate indicates that the randomly oriented ice Ic crystallites are in the upper part of the ice assembly, away from the influence of the substrate. However, near the graphite surface water molecules form an ordered structure. A Bragg spot in the center on the (111) ring was observed without other spots on other rings. This uniquely intense spot signifies that the (111) planes of ice are stacked with order in parallel with the substrate planes (001), but without an azimuthal long-range order. In this configuration, for the (111) planes of cubic ice, the out-of-plane O H bonds are perpendicular to the planes (see below).
Such ordered conformation is possible because of structural morphology of graphite. Layered HOPG is known to have a stepped structure and terraces (15). Also, the interplanar distance (a/ = 3.67 Å) between (111) planes of cubic ice and that between the sheets of HOPG (3.35 Å) are comparable within 10% (Fig. 1H). Molecular dynamics simulations have suggested that, even at a higher temperature, water molecules in contact with graphite tend to project some hydrogen atoms toward the surface (16, 17), a preference that is compatible with the stacking of (111) planes of ice Ic. Therefore, the HOPG substrate becomes a confinement template for structural ordering of the interfacial assembly, even though water-graphite interactions are somewhat weaker than those of water-water in the network. Random orientation of ice crystallites resumes when such influence is attenuated at a distance away from the substrate.
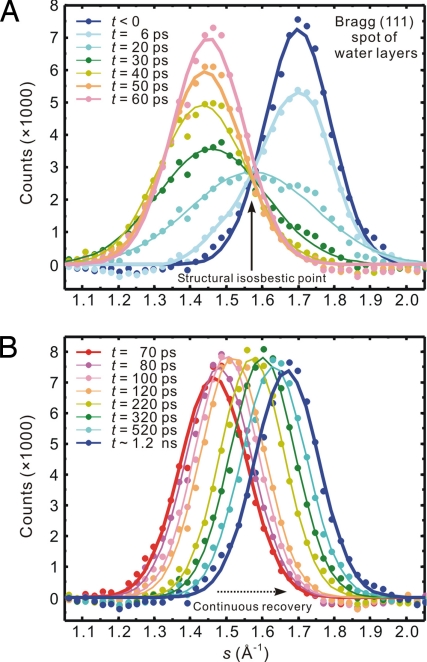
For studies of ice dynamics, we focus on the (111) Bragg spot.* It was found that the spot exhibits a large vertical-only movement with unique intensity change as a function of time. In Fig. 2, vertical profiles of the diffraction spot at different delay times t are displayed. Initially, the diffraction spot is located at s = 1.71 Å−1, where the momentum transfer value s = (4π/λ)sin(θ/2), the de Broglie wavelength λ = 0.07 Å at 30 keV, and θ is the total scattering angle. Immediately after the substrate is heated, the (111) Bragg spot intensity decreases, followed by a profile transformation to a new position at s = 1.45 Å−1. This change in s corresponds to an 18% increase in the (111) water bilayer separation. The huge change was unexpected, but equally surprising was the crossing of all curves at the same point (a structural isosbestic point) in the middle with s = 1.57 Å−1 (Fig. 2A, t = 6 to 50 ps). After the transformation the diffraction intensity recovers and the peak position continuously shifts (not through the isosbestic point) toward the original equilibrium value (Fig. 2B). The clear difference in the evolution of the diffraction curves at early and later times is easy to discern.
Fig. 2.
Diffraction vertical profiles at different times. Shown are the family of curves for the (111) Bragg spot of interfacial ice on graphite, at (A) early times and (B) longer times. The initial peak fluence for graphite T-jump is 24 mJ/cm2. We note that the early-time dynamics displays a “structural isosbestic point,” whereas the longer-time behavior depicts a continuous profile shift toward the initial, ground-state structure.
The appearance of a structural isosbestic point at early times signifies that the initial conversion involves 2 distinct states, the untransformed ground-state ice structure and a transformed, expanded one. In spectroscopic studies, the appearance of an isosbestic point in the spectra as evidence for interconverting chemical or structural species has been called into question (18, 19). However, the main problem there is the presence of inhomogeneous broadenings. In diffraction, the well-defined Bragg spots can only originate from a long-range ordered (homogeneous) structure. Moreover, the clear shift of the diffraction peak during the early-time dynamics, with the existence of only 1 isosbestic point and no overlap in the wings, is in sharp contrast with the results given in ref. 18. In fact, the well-separated peaks before time zero and after 50 ps demarcate the 2 distinct structures involved, each with a well-defined diffraction peak width (see below). Moreover, as suggested in ref. 18, the confirmation of a true chemical or structural conversion must come from time-dependent measurements, as reported here using diffraction.
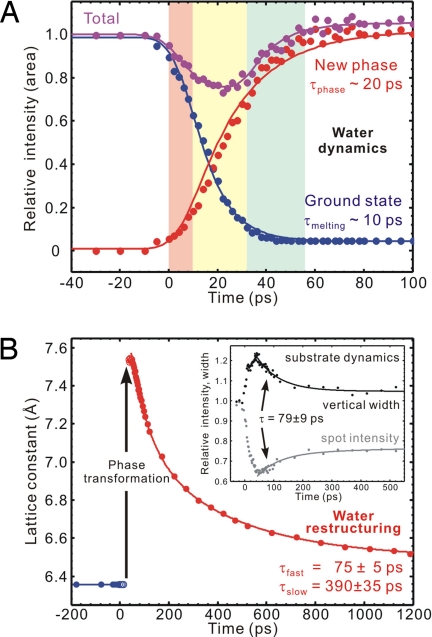
Therefore, it was legitimate to fit the early-time diffraction profile by 2 Gaussian peaks centered at s = 1.71 Å−1 and 1.45 Å−1, with variable intensities but having a width similar to the ground-state value of ≈0.20 Å−1.† The temporal evolution of the intensity of each component and their sum, relative to the unperturbed value at negative times, is shown in Fig. 3A. It follows from the plot that the ground-state structure disappears with a time constant of τmelting ∼ 10 ps, and the new phase grows with a time constant of τphase ∼ 20 ps. The total intensity, as described earlier, shows a relatively small decrease after time zero, but maintains a constant value, which is supportive evidence for structural phase transformation; the initial and final states of the conversion have the same electron diffraction cross section as both contain oxygens and hydrogens.
Fig. 3.
Evolution of the collective phase and its restructuring to the ground state. (A) Depletion of the ground state of ice structure and growth of the new phase, together with the sum of their proportions. Three sequential stages are noted for the dynamics, from left to right in different colors: ultrafast melting, nonequilibrium phase transformation, and structural annealing (see Text). (B) Restructuring of the expanded lattice, at longer times. (Inset) Temporal evolution of the intensity and width of (004) Bragg spot of graphite.
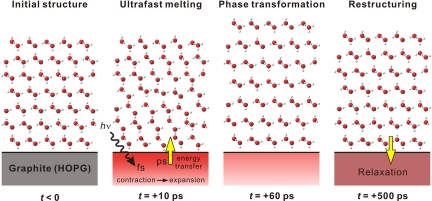
Unlike the structural phase transition observed in charge-induced correlated solids (21), the behavior in the present case of ice-graphite composite is the result of collective structural expansion and across-interface energy transfer. The lattice of graphite has been shown to undergo an interlayer contraction followed by a large expansion with a time constant of ≈7 ps (22). The “old-structure” disappearance time τmelting for ice given here matches well with the convolution of the 7-ps time for graphite with the instrumental response, indicating that the breakage of the original assembly conformation is due to the vibrational coupling of ice with underlying graphite.‡
To accommodate such a large structural perturbation and the undulating substrate, the stack of (111) water bilayers expands collectively, similar to a phase transformation, with a rise time τphase. We note that connectivity in the network of hydrogen bonds prevents the sublimation of ice, even though the large expansion motion§ seems to exceed the equilibrium Lindemann limit for thermal melting, i.e., when the root-mean-square amplitude of thermal vibration exceeds ≈10% of the nearest-neighbor distance. With time, the buildup of amplitudes of substrate atomic motions comes to an end, and this is reached when a plateau in the intensity and vertical width is experimentally realized (Fig. 3B Inset) (13).
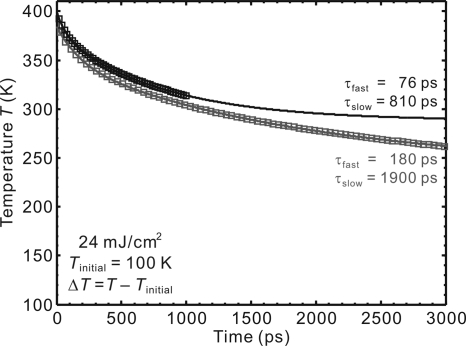
When this state of mature phase formation is reached, the transformed ice structure behaves collectively and begins its recovery as a unit. At these scales of time, the diffraction curves can be fitted by a single Gaussian profile. From the observed shifts at different times we obtained the lattice constants given in Fig. 3B. The expanded ice lattice is seen to restructure continually to the ground-state structure with 2 apparent time constants, τfast = 75 ± 5 ps and τslow = 390 ± 35 ps. In Fig. 4, we present calculations of the temperature versus time using the 1D heat diffusion equation (13), considering the fluence of the laser pulse and the initial temperature of graphite (100 K). The temporal behavior exhibits an apparent biexponential decay, but the time constants extracted depend on the range of time delay during which the data are obtained; in this case our time range is 1.2 ns, and from the simulation τfast and τslow become 76 and 810 ps, respectively. It is interesting to note that such a simple diffusion model reproduces the featured 2 exponentials, and that the fast component observed in ice matches that of graphite (τfast = 79 ± 9 ps in Fig. 3B Inset). Also, the asymptotic temperature at long times in Fig. 4 mirrors the behavior in graphite (Fig. 3B Inset) but for ice the restructuring is close to 85% complete in 1.2 ns (Fig. 3B). These findings suggest that restructuring of ice is determined by heat dissipation in the substrate and that the exchange of energy between ice and the substrate is ultrafast both ways, i.e., there is no bottleneck in the adsorbate-substrate heating and cooling.
Fig. 4.
Substrate (graphite) 1D heat diffusion. Shown is the temperature change as a function of time considering 2 temporal ranges, up to 1 ns and 3 ns. The following values were used in the simulation: the full fluence of 24 mJ/cm2, reflectivity of ∼30%, heat capacity of 1.33 J g−1·K−1 at the substrate initial temperature of 100 K (39), density of 2.266 g/cm3, thermal conductivity of 0.157 W cm−1·K−1 at 100 K (39), and penetration depth of 187 nm at the excitation wavelength of 800 nm (40). We note that the derived time constants are affected by the time range but the profiles are robust; see Text for discussion of the asymptotic value. The top trace is shifted by 10 K for clarity purpose.
Conclusion
The observations reported here, using ultrafast electron crystallography, unravel the unique nature of structure and dynamics of interfacial water assembly on the “hydrophobic” substrate, graphite. In comparing the ordered behavior on graphite with the nonordered (long range) behavior on another hydrophobic surface, hydrogen-terminated silicon (111), it is concluded that surface morphology plays a direct role in stabilizing the ordered network on graphite, as schematically shown in Fig. 5. For ice on Pt (111), both the surface steps and screw dislocations are critical in the formation of metastable cubic structure (and not the hexagonal one) and in the growth (24).
Fig. 5.
Schematic representation of the structure for the water layers on hydrophobic graphite (HOPG). Oxygen atoms are in red, carbon in light gray, and hydrogen atoms are omitted for clarity. (Upper) Top view revealing the hexagonal arrangement of oxygen atoms in the (111) planes of cubic ice. Domains with different azimuthal orientations are depicted. (Lower) Side view showing the water bilayers stacked along the surface normal direction. The steps and terrace of HOPG, and the similarity in distance between water bilayers and graphite layers, lead to the observed vertical structural order. (Inset) Schematic of layered HOPG with an emphasis on its stepped structure. The many steps depicted in a small region are not drawn to scale.
Spectroscopic investigation of interfacial D2O ice, using sum-frequency generation with longer time resolution, suggested the presence of melted regions, but neither the structure nor the order was possible to observe with atomic-scale resolutions (25). Unlike in conventional heating, the lack of sublimation of ice on the time scale reported here is due to ultrafast melting (or softening) in τmelting ∼ 10 ps and restructuring in τfast = 75 ps and τslow = 390 ps (see Fig. 6), with the cooling being determined by substrate heat diffusion characteristic. These time scales are significantly different from those deduced in figure 3b of ref. 23 for ice on CO/Pt (111) but the picture is valid.
Fig. 6.
Schematic representation of the dynamics for the ice layers on graphite. (Middle Left) After the ultrafast heating initiated by an infrared light pulse, the substrate undergoes lattice contraction followed by expansion (22). The transfer of vibrational energy to interfacial ice assembly leads to (partial) structural randomization in the first 10 ps. (Middle Right) A collective structural motion in ice then takes place, which results in a nonequilibrium phase transformation into an expanded ice structure. (Right) On a longer time scale, energy transfer from ice to the substrate together with the relaxation of graphite itself establishes equilibration of the composite system; the ice structure subsequently returns to its original state.
The structural (nonequilibrium) expansion reported here may correlate with the large thermal expansion of confined water when compared with bulk property reflected in an increased density at the interface (ref. 26 and references therein). However, significant hindrance of hydrogen-bond mobility has serious consequences on relaxation in bulk (refs. 27 and 28 and references therein) and especially at interfaces (12, 29). Clearly, studies of hydrophobic/hydrophilic properties at interfaces (30–32), and the contrast with bulk properties (ref. 33 and references therein), are of interest in many fields, and diffraction methods provide the means for elucidating structures and dynamics at the nanometer scale during phase transformations (34–36).
Materials and Experimental Procedures
In the UEC apparatus, the HOPG substrate, which was obtained from Structure Probe, Inc. (grade 1), was cleaved and immediately mounted on the goniometer inside the diffraction chamber; an ultrahigh vacuum of ≈10−10 torr at low temperature was maintained during the experiment. To prepare the interfacial water assembly, the goniometer was first cooled down to T = 100 K by a constant flow of liquid nitrogen, and the flow rate was decreased to achieve a higher temperature when necessary. At 3 cm above the substrate, molecules of water (NANOpure, resistivity >18.0 MΩ·cm) were effused through a micrometer-sized pinhole of a doser system containing only saturated water vapor (≈20 Torr) at room temperature (12). The extent of water-layer deposition was controlled by the dose time. The amorphous solid water initially deposited on HOPG at T = 100 K begins to transform into a polycrystalline assembly of the cubic-ice structure at T ≈ 135 K, with a preference of vertical stacking of (111) bilayers, but with no horizontal orientation order.
The time-resolved experiments were carried out after the deposited interfacial water was thermally crystallized (annealed) and then maintained at T = 100 K. We used 120-fs near-infrared pulses (800 nm) to induce the substrate temperature (T) jump; at this wavelength and adsorbate thickness there is no absorption in the ice layers. The electron diffraction patterns were recorded for different delay times between the optical and electron pulses, with a grazing electron incidence angle of θin ≈ 0.6°. The optical excitation fluence used was up to 39 mJ/cm2 at the peak. We did not employ the scheme of optical-pulse tilting (21, 22, 37, 38), which enables femtosecond resolution, because in the case discussed here the doser system for water deposition is connected on top of the chamber and the temporal resolution (capable of detecting a 2-ps change; 7 ps in total) was sufficient for the dynamics. The ice-substrate composite was fully recovered in <1 ms without noticeable water sublimation, as evidenced by the reproducibility of the diffraction pattern at negative times and for our experimental repetition rate of 1 kHz.
Acknowledgments.
We thank Dr. Nuk Gedik for his participation in the initial phase of this work; the collaborative effort (21) for study of other substrates and materials will be the subjects of other reports. We also thank Professors H. Eugene Stanley, Sven Hovmöller, and Dongping Zhong for critical reading and helpful suggestions. This work was supported by the National Science Foundation and the Air Force Office of Scientific Research in the Gordon and Betty Moore center for physical biology at Caltech.
Footnotes
The authors declare no conflict of interest.
For all studies reported here, we examined the (111) spot under the conditions given in Fig. 1C, at low dosage and small θin of 0.6°. Under such conditions, the (111) specular diffraction is the most prominent. At higher values of θin (Fig. 1E), both the (222) specular and transmission-like (111) and (333) spots are present, and care has to be taken in interpreting the relative amplitude of changes (13).
The width of a diffraction peak is determined by the size of the electron beam (a constant value), the broadening effect described by the Scherrer formula due to the finite size of ordered structure, and electron refraction due to the shape of the crystallites (20). During a nonequilibrium phase transformation the latter 2 factors, in principle, do not change significantly, leading the width for each Gaussian profile to remain similar to that of the ground-state.
At time zero, the energy deposited induces large-amplitude motion, which results in diffraction intensity to decrease by ≈20%. We estimate a vertical vibrational amplitude of 〈δuz2〉1/2 ≈ 0.28 Å for oxygen atoms, using the Debye-Waller factor (13).
We also measured the ice dynamics at different graphite excitation fluences (11, 24 and 39 mJ/cm2), and the measured corresponding lattice expansion of the transient phase, 8.45%, 18.5% and 22.7%, respectively. The absence of a threshold, with a near linear dependence for ice mirrors the linearity found for the graphite substrate (23). However, at very high fluences, saturation of vibrational motions in highly excited HOPG would have to be considered (23).
References
- 1.Debenedetti PG, Stanley HE. Supercooled and glassy water. Phys Today. 2003;56:40–46. [Google Scholar]
- 2.Angell CA. Insights into phases of liquid water from study of its unusual glass-forming properties. Science. 2008;319:582–587. doi: 10.1126/science.1131939. [DOI] [PubMed] [Google Scholar]
- 3.Binggeli M, Mate CM. Influence of capillary condensation of water on nanotribology studied by force microscopy. Appl Phys Lett. 1994;65:415–417. [Google Scholar]
- 4.Henderson MA. The interaction of water with solid surfaces: Fundamental aspects revisited. Surf Sci Rep. 2002;46:5–308. [Google Scholar]
- 5.Brown GE, et al. Metal oxide surfaces and their interactions with aqueous solutions and microbial organisms. Chem Rev. 1999;99:77–174. doi: 10.1021/cr980011z. [DOI] [PubMed] [Google Scholar]
- 6.Brown GE. How minerals react with water. Science. 2001;294:67–69. doi: 10.1126/science.1063544. [DOI] [PubMed] [Google Scholar]
- 7.Gawrisch K, et al. Membrane dipole potentials, hydration forces, and the ordering of water at membrane surfaces. Biophys J. 1992;61:1213–1223. doi: 10.1016/S0006-3495(92)81931-8. [DOI] [PMC free article] [PubMed] [Google Scholar]
- 8.Whitesides GM, Snyder PW, Moustakas DT, Mirica KA. In: Physical Biology: From Atoms to Medicine. Zewail AH, editor. London: Imperial College Press; 2008. pp. 189–215. [Google Scholar]
- 9.Pal SK, Zewail AH. Dynamics of water in biological recognition. Chem Rev. 2004;104:2099–2123. doi: 10.1021/cr020689l. [DOI] [PubMed] [Google Scholar]
- 10.Zhang LY, et al. Mapping hydration dynamics around a protein surface. Proc Natl Acad Sci USA. 2007;104:18461–18466. doi: 10.1073/pnas.0707647104. [DOI] [PMC free article] [PubMed] [Google Scholar]
- 11.Zewail AH. 4D ultrafast electron diffraction, crystallography, and microscopy. Annu Rev Phys Chem. 2006;57:65–103. doi: 10.1146/annurev.physchem.57.032905.104748. [DOI] [PubMed] [Google Scholar]
- 12.Ruan C-Y, Lobastov VA, Vigliotti F, Chen S, Zewail AH. Ultrafast electron crystallography of interfacial water. Science. 2004;304:80–84. doi: 10.1126/science.1094818. [DOI] [PubMed] [Google Scholar]
- 13.Yang D-S, Gedik N, Zewail AH. Ultrafast electron crystallography. 1. Nonequilibrium dynamics of nanometer-scale structures. J Phys Chem C. 2007;111:4889–4919. [Google Scholar]
- 14.Zou X, Hovmöller S. Electron crystallography: Imaging and single-crystal diffraction from powders. Acta Crystallogr A. 2008;64:149–160. doi: 10.1107/S0108767307060084. [DOI] [PubMed] [Google Scholar]
- 15.Francis GM, Kuipers L, Cleaver JRA, Palmer RE. Diffusion controlled growth of metallic nanoclusters at selected surface sites. J Appl Phys. 1996;79:2942–2947. [Google Scholar]
- 16.Gordillo MC, Martí J. Molecular dynamics description of a layer of water molecules on a hydrophobic surface. J Chem Phys. 2002;117:3425–3430. [Google Scholar]
- 17.Argyris D, Tummala NR, Striolo A, Cole DR. Molecular structure and dynamics in thin water films at the silica and graphite surfaces. J Phys Chem C. 2008;112:13587–13599. [Google Scholar]
- 18.Geissler PL. Temperature dependence of inhomogeneous broadening: On the meaning of isosbestic points. J Am Chem Soc. 2005;127:14930–14935. doi: 10.1021/ja0545214. [DOI] [PubMed] [Google Scholar]
- 19.Smith JD, et al. Unified description of temperature-dependent hydrogen-bond rearrangements in liquid water. Proc Natl Acad Sci USA. 2005;102:14171–14174. doi: 10.1073/pnas.0506899102. [DOI] [PMC free article] [PubMed] [Google Scholar]
- 20.Yang D-S, Lao C, Zewail AH. 4D electron diffraction reveals correlated unidirectional behavior in zinc oxide nanowires. Science. 2008;321:1660–1664. doi: 10.1126/science.1162049. [DOI] [PubMed] [Google Scholar]
- 21.Gedik N, Yang D-S, Logvenov G, Bozovic I, Zewail AH. Nonequilibrium phase transitions in cuprates observed by ultrafast electron crystallography. Science. 2007;316:425–429. doi: 10.1126/science.1138834. [DOI] [PubMed] [Google Scholar]
- 22.Carbone F, Baum P, Rudolf P, Zewail AH. Structural preablation dynamics of graphite observed by ultrafast electron crystallography. Phys Rev Lett. 2008;100 doi: 10.1103/PhysRevLett.100.035501. 035501. [DOI] [PubMed] [Google Scholar]
- 23.Raman RK, et al. Direct observation of optically induced transient structures in graphite using ultrafast electron crystallography. Phys Rev Lett. 2008;101 doi: 10.1103/PhysRevLett.101.077401. 077401. [DOI] [PubMed] [Google Scholar]
- 24.Thürmer K, Bartelt NC. Growth of multilayer ice films and the formation of cubic ice imaged with STM. Phys Rev B. 2008;77:195425. [Google Scholar]
- 25.Kubota J, Wada A, Kano SS, Domen K. Time-resolved study of D2O ice crystal on CO/Pt(111) by ultra-short NIR laser pumping: Melting and recrystallization without desorption. Chem Phys Lett. 2003;377:217–222. [Google Scholar]
- 26.Garofalini SH, Mahadevan TS, Xu S, Scherer GW. Molecular mechanisms causing anomalously high thermal expansion of nanoconfined water. ChemPhysChem. 2008;9:1997–2001. doi: 10.1002/cphc.200800455. [DOI] [PubMed] [Google Scholar]
- 27.Rey R, Møller KB, Hynes JT. Ultrafast vibrational population dynamics of water and related systems: A theoretical perspective. Chem Rev. 2004;104:1915–1928. doi: 10.1021/cr020675f. [DOI] [PubMed] [Google Scholar]
- 28.Nibbering ETJ, Elsaesser T. Ultrafast vibrational dynamics of hydrogen bonds in the condensed phase. Chem Rev. 2004;104:1887–1914. doi: 10.1021/cr020694p. [DOI] [PubMed] [Google Scholar]
- 29.Schmeisser M, Iglev H, Laubereau A. Bulk melting of ice at the limit of superheating. J Phys Chem B. 2007;111:11271–11275. doi: 10.1021/jp0736802. [DOI] [PubMed] [Google Scholar]
- 30.Willard AP, Chandler D. The role of solvent fluctuations in hydrophobic assembly. J Phys Chem B. 2008;112:6187–6192. doi: 10.1021/jp077186+. [DOI] [PubMed] [Google Scholar]
- 31.Gertner BJ, Hynes JT. Molecular dynamics simulation of hydrochloric acid ionization at the surface of stratospheric ice. Science. 1996;271:1563–1566. [Google Scholar]
- 32.Ball P. Water as an active constituent in cell biology. Chem Rev. 2008;108:74–108. doi: 10.1021/cr068037a. [DOI] [PubMed] [Google Scholar]
- 33.Buckingham AD, Del Bene JE, McDowell SAC. The hydrogen bond. Chem Phys Lett. 2008;463:1–10. [Google Scholar]
- 34.Jenniskens P, Blake DF. Structural transitions in amorphous water ice and astrophysical implications. Science. 1994;265:753–756. doi: 10.1126/science.11539186. [DOI] [PubMed] [Google Scholar]
- 35.Jenniskens P, Blake DF. Crystallization of amorphous water ice in the solar system. Astrophys J. 1996;473:1104–1113. doi: 10.1086/178220. [DOI] [PubMed] [Google Scholar]
- 36.Delzeit L, Blake DF. A characterization of crystalline ice nanoclusters using transmission electron microscopy. J Geophys Res. 2001;106:33371–33379. [Google Scholar]
- 37.Baum P, Zewail AH. Breaking resolution limits in ultrafast electron diffraction and microscopy. Proc Natl Acad Sci USA. 2006;103:16105–16110. doi: 10.1073/pnas.0607451103. [DOI] [PMC free article] [PubMed] [Google Scholar]
- 38.Baum P, Yang D-S, Zewail AH. 4D visualization of transitional structures in phase transformations by electron diffraction. Science. 2007;318:788–792. doi: 10.1126/science.1147724. [DOI] [PubMed] [Google Scholar]
- 39.Steinbeck J, Braunstein G, Dresselhaus MS, Venkatesan T, Jacobson DC. A model for pulsed laser melting of graphite. J Appl Phys. 1985;58:4374–4382. [Google Scholar]
- 40.Kuzmenko AB, van Heumen E, Carbone F, van der Marel D. Universal optical conductance of graphite. Phys Rev Lett. 2008;100:117401. doi: 10.1103/PhysRevLett.100.117401. [DOI] [PubMed] [Google Scholar]


