Abstract
Purpose: To explore the applicability of subtraction magnetic resonance (MR) images to (a) detect active multiple sclerosis (MS) lesions, (b) directly quantify lesion load change, and (c) detect treatment effects (distinguish treatment arms) in a placebo-controlled multicenter clinical trial by comparing the subtraction scheme with a conventional pair-wise comparison of nonregistered MR images.
Materials and Methods: Forty-six pairs of MR studies in 40 patients (31 women; mean age, 31.9 years) from a multicenter clinical trial were used. The clinical trial was approved by local ethics review boards, and all subjects gave written informed consent. Active MS lesions were scored by two independent raters, and lesion load measurements were conducted by using semiautomated software. Lesion counts were evaluated by using the Wilcoxon signed rank test, interrater agreement was evaluated by using the intraclass correlation coefficient (ICC), and treatment (interferon beta-1b) effect was evaluated by using the Mann-Whitney U test.
Results: When subtraction images were used, there was a 1.7-fold increase in the detection of positive active lesions, as compared with native image pairs, and significantly greater interobserver agreement (ICC = 0.98 vs 0.91, P < .001). Subtraction images also allowed direct quantification of positive disease activity, a measure that provided sufficient power to distinguish treatment arms (P = .012) compared with the standard measurement of total lesion load change on native images (P = .455).
Conclusion: MR image subtraction enabled detection of higher numbers of active MS lesions with greater interobserver agreement and exhibited increased power to distinguish treatment arms, as compared with a conventional pair-wise comparison of nonregistered MR images.
© RSNA, 2008
Magnetic resonance (MR) imaging is a sensitive imaging modality for helping detect and monitor multiple sclerosis (MS) abnormalities in the brain. In clinical trials, MR imaging indexes (active lesions on T2-weighted MR images [hereafter, T2 lesions] and T2 lesion load change) are used as outcome measures to monitor treatment efficacy (1,2). However, the detection of active T2 lesions by using serial conventional MR imaging is complicated by repositioning errors and a background of unaltered nonactive lesions (3). This leads to low intra- (4) and interobserver (5) agreement. Furthermore, the change in T2 lesion load is commonly calculated by measuring whole-brain lesion loads at two consecutive time-points and numerically subtracting them. This is a labor-intensive and imprecise method, as the actual lesion load change is relatively small and is affected by errors emanating from two separate whole-brain lesion load measurements (6). Overall disease activity, especially in a patient with active disease, may be substantially underestimated as the lesion load contributions of positive disease activity (new and enlarged lesions) and of negative disease activity (shrunken and resolved lesions) are expressed as a single value, which could even result in a measurement of zero change when the processes cancel each other out.
Subtraction images (after image registration) provide an alternative in which the effect of repositioning errors is reduced, and the contrast between active lesions and the nonactive background is enhanced as stable lesions cancel out. Furthermore, subtraction images allow direct measurement of lesion load change and quantification of both positive and negative disease activity. A previous single-center study (7) that used subtraction images reported good interobserver agreement for the detection of active lesions. However, most phase III studies are multicenter trials with different MR systems, presenting an additional challenge for image postprocessing methods due to imager-dependant variations in image contrast. Hence, the purpose of our study was (a) to explore the applicability of subtraction images for detection of active T2 lesions, (b) to directly quantify lesion load change, and (c) to assess the ability to detect treatment effects (distinguish treatment arms) in a placebo-controlled multicenter clinical trial by comparing the subtraction scheme with a conventional pair-wise comparison of nonregistered images.
MATERIALS AND METHODS
Three of the authors (C.P., L.B., R.S.) are salaried employees of Bayer Schering Pharma, Berlin, Germany, which is the sponsor of the Betaferon/Betaseron in Newly Emerging MS for Initial Treatment (BENEFIT) trial, and conducted part of the statistical analysis for our study. All other authors maintained complete control of the data and information submitted for publication. The clinical trial protocol was approved by the local ethics review boards of all participating centers, and all subjects gave written informed consent.
Patients and MR Image Acquisition
Serial MR images were selected from a clinical trial (BENEFIT trial [8]) that examined the effects of interferon beta-1b (Betaferon/Betaseron, Bayer Schering Pharma; 250 μg subcutaneously every other day [n = 292] vs placebo [n = 176]) on progression from clinically isolated syndromes suggestive of MS to clinically definite MS. To create a dataset with a representative range of expected changes, 92 MR studies were selected (P.A.P.) on the basis of the number of new T2 and gadolinium-enhanced lesions registered in the trial database. Four (4.3%) of the 92 initially selected MR studies were excluded because images suffered heavily from patient-related movement artifacts. In those four instances, the follow-up image of the first pair was used as the baseline image for the second pair. This resulted in 46 pairs of MR studies from 40 patients (34 patients with one pair, six patients with two pairs). The mean age of the patients was 31.9 years (range, 19.2–45.9 years). There were 31 women (mean age, 32.9 years; range, 19.2–45.9 years) and nine men (mean age, 28.4 years; range, 19.6–44.7 years). Images were obtained with 14 different MR systems (four 1-T, 10 1.5-T), with a median number of three patients per site (range, one to six patients). The median time between successive studies was 96 days (range, 71–364 days).
MR images were acquired between May 2002 and February 2004. The protocol included a dual-echo T2-weighted turbo or fast spin-echo sequence (repetition time msec/echo time msec, 2000–3000/20–40, 60–100). The field of view for all examinations was 25 cm and the matrix was 256 × 256, resulting in a roughly 1-mm2 pixel size. Images were acquired in two interleaved sets with a 3-mm gap, resulting in whole brain coverage with contiguous 3-mm-thick sections.
Postprocessing and Registration
For each study pair, spatial normalization (affine registration) was performed, and images were resectioned to the halfway position by using an automated intensity-based registration algorithm with a mutual information criterion and spline interpolation (9). Intrastudy intensity normalization (bias field correction) was applied by using a nonparametric method (N3) (10). Interimage intensity normalization (imager drift correction) was applied on the basis of the method described by Meier and Guttmann (11). Briefly, the image brightness and contrast of all follow-up studies was matched to that of the baseline study on the basis of the signal intensity of the intracranial cavity (D.S.M., with 15 years experience in digital image analysis).
Image Analysis
The native and subtraction images were each analyzed separately by two independent observers (B.M., P.A.P., with 3 and 5 years experience, respectively, in serial MR image analysis of MS), who used home-developed custom software (developed by D.S.M.) featuring a split-screen modality and window level adjustments (GDC-viewer, Boston, Mass). The order of analyses was randomized to avoid recall bias, with an interval of at least 1 month between successive analyses of the same patient. Both raters were blinded to treatment allocation during all analyses. The native proton density (PD)-weighted images were analyzed alongside their T2-weighted counterparts, according to the consensus rules described by Molyneux et al (5). The subtraction images were analyzed alongside the halfway-registered (postprocessed) baseline and follow-up images, to ensure that change identified on the subtraction images genuinely represented disease activity (rather than artifact).
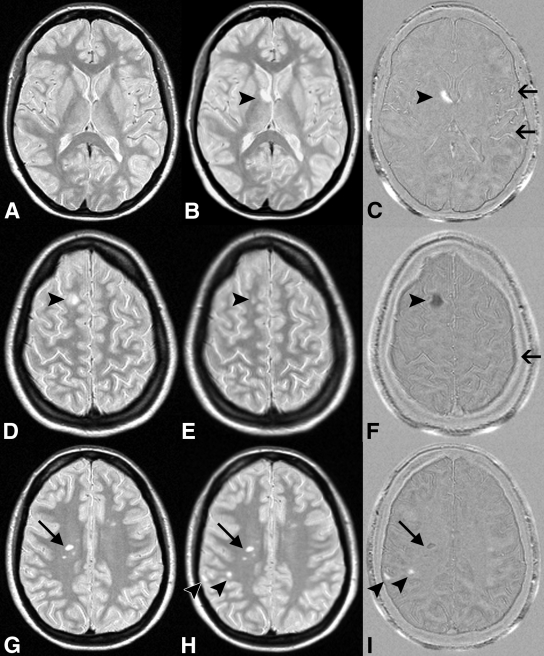
Criteria used to define lesions and to identify artifacts on subtraction images have been previously described (7). Briefly, a lesion had to be a clearly visible nonartifactual area of change (hyper- or hypointense) against the background and have a diameter larger than 3 mm. On the subtraction images, new and enlarged lesions (positive activity) appeared as hyperintense areas, whereas resolved or shrunken lesions (negative activity) appeared as hypointense areas (Fig 1). Three types of artifacts were identified on the subtraction images: residual registration errors (partly due to patient movement during acquisition), flow artifacts on the native images, and lesion signal intensity differences between the baseline and follow-up images that resulted in false-positive “lesions” (Fig 1). All types of artifacts could be readily identified with direct visual reference with the registered (nonsubtraction) images.
Figure 1:
MS activity on, A, D, G, halfway-registered baseline PD-weighted MR images; B, E, H, halfway-registered follow-up PD-weighted images; and C, F, I, subtraction images. B, C, Arrowheads = new lesion (positive activity) shown as hyperintensity on C. Arrows = flow artifacts. D, E, F, Arrowheads = shrunken lesion (negative activity) shown as hypointensity on F. Arrow = residual registration artifact. G, H, I, Arrowheads = new lesions, one of which is juxtacortically located and easily missed on H but is clearly visible on I. Arrows = false-positive negative activity. Lesion was visible on both G and H and did not decrease in size.
Lesions were subclassified according to the following criteria. (a) New: a nonartifactual hyperintense area that was clearly visible against the background. New lesions had to be identifiable on the registered follow-up image but not on the registered baseline image. (b) Enlarged: a lesion that increased in size by at least 50%. (c) Resolved: a nonartifactual hypointense area that was clearly visible against the background. Resolved lesions had to be visible on the registered baseline image but not on the registered follow-up image. (d) Shrunken: a lesion that decreased in size by at least 50%. In addition, two combined lesion classes were defined: positive activity (new or enlarged lesions) and negative activity (resolved or shrunken lesions). Both raters digitally marked all the lesions on both the native and subtraction images, and these markings were used by a single technician (W.M.A.J., with more than 10 years experience with MS trials and subtraction images) who used home-developed custom software with a canny filter to perform lesion load measurements based on local thresholding and edge detection (4).
Treatment Effect
For each study pair, the averages of the independent lesion counts of both readers and the lesion load change data were calculated and subsequently used to test for significant differences in detecting a possible treatment effect (interferon beta-1b vs placebo) between the two analysis strategies. Variables compared were positive active (new or enlarged) lesion counts, positive activity lesion load change, and total lesion load change. These analyses were conducted by the sponsor of the trial (Bayer Schering Pharma) to ensure that both raters remained blinded to the treatment group.
Statistical Analysis
Lesion counts were expressed as means and standard deviations for each analysis method, lesion subtype, and rater and were compared by using the Wilcoxon signed rank test. Lesion loads were expressed as means and standard deviations for each rater. The interrater agreement for each lesion subtype count and lesion load change was expressed as an intraclass correlation coefficient (ICC) for both analysis methods by using a variance component analysis for a two-way random effects model without interaction variance after log transformation of the data (12). To compare differences between ICCs, a Fisher z transformation was applied.
Treatment effect was evaluated by using the Mann-Whitney U test. All statistical calculations were performed with software (SPSS, version 12.0; SPSS, Chicago, Ill), and P values of less than .05 were considered to indicate a significant difference.
RESULTS
Lesion Counts and Loads
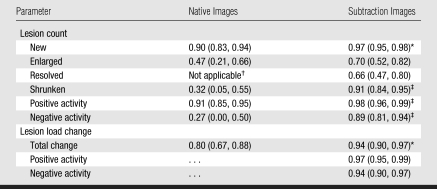
The mean number of positive active lesions identified by both raters was significantly (1.7-fold) higher on the subtraction images than on the native images (4.15 vs 2.40, P < .001). Likewise, the mean number of negative active lesions identified by both raters was significantly (2.9-fold) higher on the subtraction images than on the native images (0.52 vs 0.18, P < .001) (Table 1).
Table 1.
Mean Number of Active Lesions Detected on Native and Subtraction Images by Rater and Lesion Subtype
Note.—Data are mean number of lesions ± standard deviation.
P < .001 compared with native images by using Wilcoxon signed rank test.
P < .05 compared with native images by using Wilcoxon signed rank test.
P < .01 compared with native images by using Wilcoxon signed rank test.
Both raters detected higher lesion counts for all subtypes of active lesions (new, enlarged, resolved, and shrunken) on subtraction images with greater interobserver agreement (Table 2). The ICC for positive activity on subtraction images was significantly higher than that on native images (0.98 vs 0.91, P < .001). Likewise, the ICC for negative activity was significantly higher on subtraction images than on native images (0.89 vs 0.27, P < .001).
Table 2.
ICCs Expressing Interobserver Agreement for Lesion Counts and Lesion Load Change
Note.—Data in parentheses are 95% confidence intervals.
P < .01 compared to native images.
One rater scored no resolved lesions on the native images.
P < .001 compared to native images.
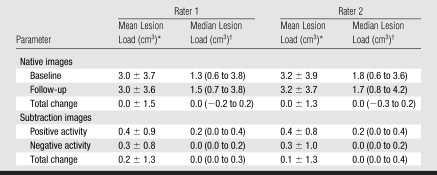
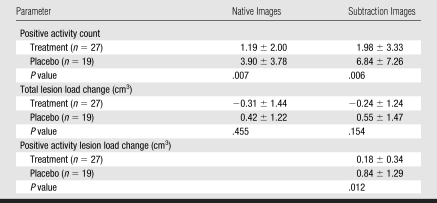
The change in T2 lesion load measured on the native images was small and resulted in a rounded value of zero, which approximately matches the net change measured on the subtraction images (Table 3). However, the direct lesion load measurements on the subtraction images of both positive and negative disease activity represent disease activity that was not recognized by the value of zero change on the native images. The ICCs for total lesion load change (0.94) and for positive lesion load change (0.97) on the subtraction images were both significantly higher (P < .01) than the total lesion load change on native images (0.80) (Table 2, Fig 2).
Table 3.
Lesion Loads Measured on Native and Subtraction Images
Data are means ± standard deviations.
Data in parentheses are interquartile ranges.
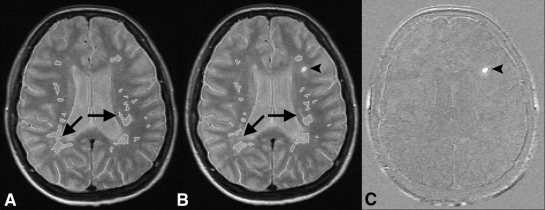
Figure 2:
MR images show example of variability in lesion outlines for lesion load measurements on native images. A, Native baseline PD-weighted image (2000–3000/60–100). B, Native follow-up PD-weighted image. C, Subtraction image. Lesions do not change (except for one new lesion), but lesion outlines (of stable lesions) do show variability (arrows), which decreases precision and, subsequently, power to detect treatment effects on native images. Subtraction images circumvent this problem, as only active lesions (arrowheads) are displayed, allowing direct quantification of change.
Treatment Effect
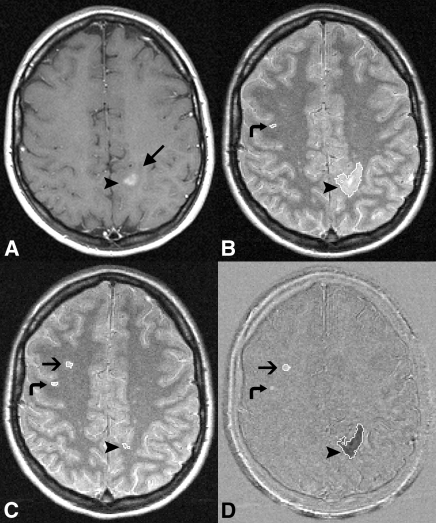
Although the raters detected a higher mean number of active lesions in both the treatment and placebo groups by using subtraction images, as compared with native images, this did not result in increased power to distinguish treatment arms (P = .006 and .007, respectively, Table 4). Neither analysis method showed a significant treatment effect for the total lesion load change measured on either subtraction or native images (P = .154 and .455, respectively). However, by using the advantage of subtraction images to directly quantify positive lesion load change (Fig 3), a significant treatment effect (P = .012) was detected even in this small sample. Significance was maintained when data were corrected for statistical dependencies arising from the use of multiple study pairs in some patients.
Table 4.
Evaluation of Ability to Differentiate Treatment Arms by Using Native versus Subtraction Images
Note.—Treatment was with interferon beta-1b. Unless otherwise noted, data are means ± standard deviations for both raters combined. P values were determined by using the Mann-Whitney U test to compare patients receiving either interferon beta-1b or placebo.
Figure 3:
MR images show a large lesion load of negative activity relative to positive activity, possibly confounding detection of treatment effect. A, Native baseline gadolinium-enhanced T1-weighted image (400–700/5–25). B, Native baseline, C, native follow-up PD-weighted and, D, subtraction images with lesion outlines overlaid. Enhancing lesion (arrowheads) on A and B surrounded by edema (long arrow), which has been resorbed on C. Short arrows = new lesion on C and D. Curved arrows = false-positive positive activity on D, as the lesion was visible on B and C and did not increase in size.
DISCUSSION
By using MR images from a clinical multicenter trial, we found image subtraction enabled detection of higher numbers of active lesions with greater interobserver agreement and had increased power to distinguish treatment arms compared with a conventional pair-wise comparison of nonregistered images.
Previous studies (5,13) examining interobserver agreement for active lesion detection have reported weak to moderate interobserver agreement, expressed as weighted κ values of 0.35–0.46 for new lesions and 0.11–0.21 for enlarging lesions with conventional analyses. The use of image registration alone increased the interobserver agreement to 0.62 for new lesions and 0.20 for enlarged lesions (13). A study (7) that applied image subtraction to detection of active MS lesions, although in a single-center setting, reported moderate to good interobserver agreement, expressed as weighted κ values of 0.71 for positive activity and 0.50 for negative activity. However, the sample size in that study was smaller (30 study pairs vs 46 in our study), and a different registration procedure was used, with follow-up images registered to the baseline images by using trilinear interpolation instead of a halfway registration combined with spline interpolation, as was used in our study. These differences introduce relatively more blurring in the follow-up images than in the baseline images, possibly reducing the sensitivity for active lesion detection and biasing lesion load measurements.
Mean baseline whole-brain lesion loads measured in our study (3.0 cm3 for rater 1 and 3.2 cm3 for rater 2) are similar to those reported for the whole trial (14) and typify lesion loads of patients in the early phase of the disease. The marginal change in T2 lesion load is reflective of the overall robust effect of interferon beta-1b on MR imaging measurements as reported elsewhere (14). By using subtraction images, we found greater interobserver agreement (0.94) for the change in total lesion load compared with conventional analysis (0.80). In part, this is related to the higher ICCs found for the detection of active lesions on the subtraction images and reflects the “real-life” situation in which a technician and rater form a unit of analysis. Also, the registration of the images could have reduced the variance of the lesion load measurements, as even small changes in orientation of unregistered images can result in errors of up to 7% in measured volumes (15,16). Lesion load change measured by using conventional analyses likely underrepresents true disease activity, as it reflects the difference between the lesion loads of positive and negative activity (17,18). Indeed, in previous studies (19,20) that used subtraction images to determine lesion load changes, the total lesion load change was much lower than the lesion load of positive activity, which is in accordance with our findings.
Both counts of active lesions and total lesion load change are used in clinical trials as secondary endpoints to discern treatment efficacy. Increased sensitivity for an outcome measure could lead to sample size reduction while maintaining power, meaning a reduction in the number of patients and/or follow-up examinations needed for clinical trials. Even with a relatively small sample size of 46 study pairs, our results show an increased power for distinguishing treatment arms (interferon beta-1b vs placebo) with the lesion load change of positive activity on subtraction images (P = .012) compared with the standard measurement of total lesion load change on native images (P = .455). This underlines the inherent advantages of subtraction images to directly identify and quantify positive disease activity, circumventing measurement errors emanating from quantifying two individual brain lesion loads and the confounding effect of negative disease activity, besides the aforementioned benefits of increased detection of active lesions with greater interobserver agreement. A future study with a larger sample size should evaluate whether the quantification of positive disease activity alone could be used as a more sensitive outcome measure to determine treatment effect in clinical multicenter trials.
A potential limitation of our study was the introduction of selection bias. MR studies were obtained from a multicenter trial in which all images had been subjected to a routine quality control procedure (14). In addition, four (4.3%) of the 92 initially selected MR studies from the trial database were excluded since both the visual analysis and software postprocessing steps perform suboptimally when images are heavily affected by patient-related movement artifacts. The quality of subtraction images is defined by the quality of the source images and the quality of the registration and intensity correction procedures. Especially, the first echo of the dual-echo T2-weighted turbo or fast spin-echo sequence, the PD-weighted image, may suffer from blood and cerebrospinal fluid flow artifacts in the posterior cranial fossa that are inconsistent over time, leading to artifacts on the subtraction image. Furthermore, the dual-echo T2-weighted turbo or fast spin-echo sequence features an anisotropic voxel size that produces interpolation effects owing to resectioning of data during the registration procedure. An improvement could be the use of single-slab three-dimensional sequences that apply spatially nonselective radiofrequency pulses with variable flip angles to prevent flow artifacts (21,22). Also, three-dimensional sequences have intrinsically higher signal-to-noise ratios, which allow the acquisition of small isotropic voxels, and can easily be combined with image contrast sequences such as fluid-attenuated inversion recovery and double inversion recovery that demonstrate substantially more lesions compared with two-dimensional (fast) spin-echo techniques (23–26). However, the combination of high-resolution datasets and more sensitive contrast sequences means image analysis will demand more time, which could be an additional incentive to use subtraction images that allow faster and direct identification of change.
A second possible limitation of our study was the relatively short time between successive studies (median around 3 months), in which hardly any brain atrophy will have occurred. Brain atrophy can influence the quality of MR image registration and occurs at a higher rate in a brain affected by MS compared with a normally ageing brain (27). In phase III clinical trials, intervals between successive studies could exceed 1 year, resulting in more atrophy between time points.
Third, the registered images should be examined alongside the subtraction images to rule out artifacts, some of which result from focal signal intensity differences between the baseline and follow-up images, which we considered false-positive lesions, but could also be the result of T2 signal variation due to actual changes in histopathologic characteristics.
Furthermore, our study focused on reliability and precision rather than accuracy because of the lack of an independent reference standard. However, in a clinical trial, precision provides greater power to detect treatment effects than does accuracy (28), which can be extrapolated to the results of our study.
Finally, we devoted time and effort to create optimal image postprocessing, but we did not quantify the amount of time taken for these steps. Future studies can easily automate our method by means of an integrated script. All postprocessing steps use open-source software, freely available through the Internet, further facilitating incorporation into an automated pipeline. Although not directly quantified, the computing time spent for the various postprocessing steps was compensated for by a time gain for the quantification of total lesion load change on subtraction images. For example, in a patient with 30 lesions on baseline images and 31 lesions on follow-up images (ie, one new lesion), 61 lesions need to be outlined to determine the change in total lesion load on the native images, whereas only one lesion needs to be outlined on the subtraction images. The apparent increased efficiency of subtraction images could substantially shorten the time (and minimize costs) needed to analyze serial MR data in clinical treatment trials.
To conclude, we found an increased detection of all subtypes of active MS lesions (new, enlarged, resolved, and shrunken) with greater interobserver agreement for the detection of active lesions and total lesion load change. Also, subtraction imaging allowed the direct quantification of positive and negative disease activity, demonstrating that overall disease activity can be severely underestimated on native images. These advantages contributed to an increased power to distinguish treatment arms, translating into a possible reduction in the number of patients and/or follow-up examinations needed for clinical trials.
ADVANCES IN KNOWLEDGE
MR image subtraction depicted higher numbers of active multiple sclerosis (MS) lesions with greater interobserver agreement than did a conventional pair-wise comparison of nonregistered MR images.
Direct quantification of positive disease activity by using subtraction MR images led to increased power to distinguish treatment arms, compared with a standard measurement of total lesion load change by using nonregistered MR images.
IMPLICATION FOR PATIENT CARE
Increased power to distinguish treatment arms in studies of MS could lead to a reduction of the number of patients and/or follow-up examinations needed for clinical trials.
Acknowledgments
We are grateful to Bayer Schering Pharma for providing us with information regarding treatment effect and to the following BENEFIT trial steering committee members for commenting on the manuscript: Chris H. Polman, MD, PhD, David H. Miller, MD, Gilles Edan, MD, Hans-Peter Hartung, MD, Ludwig Kappos, MD, Xavier Montalban, MD, and Mark S. Freedman, MD.
Abbreviations
ICC = intraclass correlation coefficient
MS = multiple sclerosis
PD = proton density
Author contributions: Guarantors of integrity of entire study, B.M., F.B.; study concepts/study design or data acquisition or data analysis/interpretation, all authors; manuscript drafting or manuscript revision for important intellectual content, all authors; approval of final version of submitted manuscript, all authors; literature research, B.M., F.B.; clinical studies, B.M., P.A.P., J.J.G.G., H.V., W.M.A.J., R.A.v.S., P.J.W.P., R.S., F.B.; statistical analysis, B.M., D.L.K., C.P.; and manuscript editing, all authors
See Materials and Methods for pertinent disclosures.
References
- 1.Miller DH, Albert PS, Barkhof F, et al. Guidelines for the use of magnetic resonance techniques in monitoring the treatment of multiple sclerosis: US National MS Society Task Force. Ann Neurol 1996;39:6–16. [DOI] [PubMed] [Google Scholar]
- 2.Filippi M, Horsfield MA, Adèr HJ, et al. Guidelines for using quantitative measures of brain magnetic resonance imaging abnormalities in monitoring the treatment of multiple sclerosis. Ann Neurol 1998;43:499–506. [DOI] [PubMed] [Google Scholar]
- 3.Goodkin DE, Vanderburg-Medendorp S, Ross J. The effect of repositioning error on serial magnetic resonance imaging scans. Arch Neurol 1993;50:569–571. [DOI] [PubMed] [Google Scholar]
- 4.van Walderveen MA, Barkhof F, Hommes OR, et al. Correlating MRI and clinical disease activity in multiple sclerosis: relevance of hypointense lesions on short-TR/short-TE (T1-weighted) spin-echo images. Neurology 1995;45:1684–1690. [DOI] [PubMed] [Google Scholar]
- 5.Molyneux PD, Miller DH, Filippi M, et al. Visual analysis of serial T2-weighted MRI in multiple sclerosis: intra- and interobserver reproducibility. Neuroradiology 1999;41:882–888. [DOI] [PubMed] [Google Scholar]
- 6.Barkhof F, Filippi M, Miller DH, Tofts P, Kappos L, Thompson AJ. Strategies for optimizing MRI techniques aimed at monitoring disease activity in multiple sclerosis treatment trials. J Neurol 1997;244:76–84. [DOI] [PubMed] [Google Scholar]
- 7.Tan IL, van Schijndel RA, Fazekas F, et al. Image registration and subtraction to detect active T(2) lesions in MS: an interobserver study. J Neurol 2002;249:767–773. [DOI] [PubMed] [Google Scholar]
- 8.Kappos L, Polman CH, Freedman MS, et al. Treatment with interferon beta-1b delays conversion to clinically definite and McDonald MS in patients with clinically isolated syndromes. Neurology 2006;67:1242–1249. [DOI] [PubMed] [Google Scholar]
- 9.Maes F, Vandermeulen D, Suetens P. Comparative evaluation of multiresolution optimization strategies for multimodality image registration by maximization of mutual information. Med Image Anal 1999;3:373–386. [DOI] [PubMed] [Google Scholar]
- 10.Sled JG, Zijdenbos AP, Evans AC. A nonparametric method for automatic correction of intensity nonuniformity in MRI data. IEEE Trans Med Imaging 1998;17:87–97. [DOI] [PubMed] [Google Scholar]
- 11.Meier DS, Guttmann CR. Time-series analysis of MRI intensity patterns in multiple sclerosis. Neuroimage 2003;20:1193–1209. [DOI] [PubMed] [Google Scholar]
- 12.Carrasco JL, Jover L. Estimating the generalized concordance correlation coefficient through variance components. Biometrics 2003;59:849–858. [DOI] [PubMed] [Google Scholar]
- 13.Tan IL, van Schijndel RA, Fazekas F, et al. Improved interobserver agreement for visual detection of active T2 lesions on serial MR scans in multiple sclerosis using image registration. J Neurol 2001;248:789–794. [DOI] [PubMed] [Google Scholar]
- 14.Barkhof F, Polman CH, Radue EW, et al. Magnetic resonance imaging effects of interferon beta-1b in the BENEFIT study: integrated 2-year results. Arch Neurol 2007;64:1292–1298. [DOI] [PubMed] [Google Scholar]
- 15.Gawne-Cain ML, Webb S, Tofts P, Miller DH. Lesion volume measurement in multiple sclerosis: how important is accurate repositioning? J Magn Reson Imaging 1996;6:705–713. [DOI] [PubMed] [Google Scholar]
- 16.Filippi M, Marcianò N, Capra R, et al. The effect of imprecise repositioning on lesion volume measurements in patients with multiple sclerosis. Neurology 1997;49:274–276. [DOI] [PubMed] [Google Scholar]
- 17.Willoughby EW, Grochowski E, Li DK, Oger J, Kastrukoff LF, Paty DW. Serial magnetic resonance scanning in multiple sclerosis: a second prospective study in relapsing patients. Ann Neurol 1989;25:43–49. [DOI] [PubMed] [Google Scholar]
- 18.Stone LA, Albert PS, Smith ME, et al. Changes in the amount of diseased white matter over time in patients with relapsing-remitting multiple sclerosis. Neurology 1995;45:1808–1814. [DOI] [PubMed] [Google Scholar]
- 19.Lee MA, Smith S, Palace J, Matthews PM. Defining multiple sclerosis disease activity using MRI T2-weighted difference imaging. Brain 1998;121:2095–2102. [DOI] [PubMed] [Google Scholar]
- 20.Duan Y, Hildenbrand PG, Sampat MP, et al. Segmentation of subtraction images for the measurement of lesion change in multiple sclerosis. AJNR Am J Neuroradiol 2008;29:340–346. [DOI] [PMC free article] [PubMed] [Google Scholar]
- 21.Mugler JP III, Bao S, Mulkern RV, et al. Optimized single-slab three-dimensional spin-echo MR imaging of the brain. Radiology 2000;216:891–899. [DOI] [PubMed] [Google Scholar]
- 22.Kallmes DF, Hui FK, Mugler JP III. Suppression of cerebrospinal fluid and blood flow artifacts in FLAIR MR imaging with a single-slab three-dimensional pulse sequence: initial experience. Radiology 2001;221:251–255. [DOI] [PubMed] [Google Scholar]
- 23.Geurts JJ, Pouwels PJ, Uitdehaag BM, Polman CH, Barkhof F, Castelijns JA. Intracortical lesions in multiple sclerosis: improved detection with 3D double inversion-recovery MR imaging. Radiology 2005;236:254–260. [DOI] [PubMed] [Google Scholar]
- 24.Pouwels PJ, Kuijer JP, Mugler JP III, Guttmann CR, Barkhof F. Human gray matter: feasibility of single-slab 3D double inversion-recovery high-spatial-resolution MR Imaging. Radiology 2006;241:873–879. [DOI] [PubMed] [Google Scholar]
- 25.Bink A, Schmitt M, Gaa J, Mugler JP 3rd, Lanfermann H, Zanella FE. Detection of lesions in multiple sclerosis by 2D FLAIR and single-slab 3D FLAIR sequences at 3.0 T: initial results. Eur Radiol 2006;16:1104–1110. [DOI] [PubMed] [Google Scholar]
- 26.Moraal B, Roosendaal SD, Pouwels PJ, et al. Multi-contrast, isotropic, single-slab 3D MR imaging in multiple sclerosis. Eur Radiol 2008;18:2311–2320. [DOI] [PubMed] [Google Scholar]
- 27.Chard DT, Griffin CM, Parker GJ, Kapoor R, Thompson AJ, Miller DH. Brain atrophy in clinically early relapsing-remitting multiple sclerosis. Brain 2002;125:327–337. [DOI] [PubMed] [Google Scholar]
- 28.Evans AC, Frank JA, Antel J, Miller DH. The role of MRI in clinical trials of multiple sclerosis: comparison of image processing techniques. Ann Neurol 1997;41:125–132. [DOI] [PubMed] [Google Scholar]


