Abstract
Aim
To identify genetic variants underlying biochemical traits – total cholesterol, low-density lipoprotein (LDL) cholesterol, high-density lipoprotein (HDL) cholesterol, triglycerides, uric acid, albumin, and fibrinogen, in a genome-wide association study in an isolated population where rare variants of larger effect may be more easily identified.
Methods
The study included 944 adult inhabitants of the island of Korčula, as a part of a larger DNA-based genetic epidemiological study in 2007. Biochemical measurements were performed in a single laboratory with stringent internal and external quality control procedures. Examinees were genotyped using Human Hap370CNV chip by Illumina, with a genome-wide scan containing 346 027 single nucleotide polymorphisms (SNP).
Results
A total of 31 SNPs were associated with 7 investigated traits at the level of P < 1.00 × 10⁻⁵. Nine of SNPs implicated the role of SLC2A9 in uric acid regulation (P = 4.10 × 10⁻⁶-2.58 × 10⁻¹²), as previously found in other populations. All 22 remaining associations fell into the P = 1.00 × 10⁻⁵-1.00 × 10⁻⁶ significance range. One of them replicated the association between cholesteryl ester transfer protein (CETP) and HDL, and 7 associations were more than 100 kilobases away from the closest known gene. Nearby SNPs, rs4767631 and rs10444502, in gene kinase suppressor of ras 2 (KSR2) on chromosome 12 were associated with LDL cholesterol levels, and rs10444502 in the same gene with total cholesterol levels. Similarly, rs2839619 in gene PBX/knotted 1 homeobox 1 (PKNOX1) on chromosome 21 was associated with total and LDL cholesterol levels. The remaining 9 findings implied possible associations between phosphatidylethanolamine N-methyltransferase (PEMT) gene and total cholesterol; USP46, RAP1GDS1, and ZCCHC16 genes and triglycerides; BCAT1 and SLC14A2 genes and albumin; and NR3C2, GRIK2, and PCSK2 genes and fibrinogen.
Conclusion
Although this study was underpowered for most of the reported associations to reach formal threshold of genome-wide significance under the assumption of independent multiple testing, replications of previous findings and consistency of association between the identified variants and more than one studied trait make such findings interesting for further functional follow-up studies. Changed allele frequencies in isolate population may contribute to identifying variants that would not be easily identified in much larger samples in outbred populations.
It is known that human lipid levels in circulation show considerable heritability (1-3). Recently, genome-wide association studies proved their value as a reliable tool for identifying genetic variants underlying complex human diseases and traits (4,5). The first applications of genome-wide association studies to identify genetic variants underlying human lipid levels yielded a total of 19 loci controlling serum high-density lipoprotein cholesterol (HDL), low-density lipoprotein cholesterol (LDL), and triglycerides (6-10) and implicated a number of potential genes and 3 genetic regions with multiple associated genes. Many of these genes have already been known as very likely candidates for lipid level regulation (11,12). The most recent study also found that ATP-binding cassette gene (ABCG5) predicted triglycerides and LDL; transmembrane protein 57 gene (TMEM57) predicted triglycerides; regulator protein with 11 highly conserved zinc finger-protein arginine methyltransferase 8 regions (CTCF-PRMT8 region) predicted HDL; dynein, axonemal, heavy chain 11 (DNAH11) predicted LDL; fatty acid desaturase 3 – fatty acid desaturase 2 gene (FADS3-FADS2) predicted triglycerides and LDL; and MAP-kinase activating death domain-folate hydrolase 1 gene (MADD-FOLH1 region) predicted HDL (13). However, all these loci combined can still not explain a substantial share of noted heritabilities, leaving room for further findings of genetic and epigenetic factors that control serum lipid levels in humans (14). Those are likely to include structural variants, such as copy number variants, and also very rare genetic variants that may only be identified in special populations (4,5).
Apart from the lipid levels, other clinically relevant biochemical measurements in human serum and/or plasma that are usually studied include uric acid, albumin, and fibrinogen. Recently, several studies have identified and replicated the finding of a novel major uric acid transporter – solute carrier family 2 (facilitated glucose transporter) member 9 – SLC2A9 (GLUT9), which is several times more functionally significant than urate transporter 1 – URAT1, a gene previously thought to play a major role in the regulation of uric acid levels (15-18). A recent study with increased power has identified further 2 genes that also contribute to uric acid regulation: ATP-binding cassette, sub-family G (WHITE) member 2 – ABCG2 and solute carrier family 17 member 3 – SLC17A3 (19). Unlike for uric acid, we could not find any genome-wide association studies that searched specifically for loci influencing the levels of human albumin in plasma. Some genome-wide association studies investigating biochemical traits also included searching for fibrinogen loci, but none of them reached the required threshold for genome-wide significance (20).
We performed a comprehensive genome-wide association studies of total cholesterol, LDL and HDL cholesterol, triglycerides, uric acid, albumin, and fibrinogen in the isolated population of the island of Korčula in Croatia. The study is a part of genetic epidemiology research program in Croatian island isolates, “10,001 Dalmatians.” The genetic epidemiology research program in Croatian island isolates began in 1999 (21), expanded to study human genetic variation and effects of isolation and inbreeding (22-34), and then broadened its focus to include diseases and gene mapping studies (18,35-41). By now, the research project has included more than 3000 examinees from isolated populations, while it aims to eventually reach 10 001 examinees.
Materials and methods
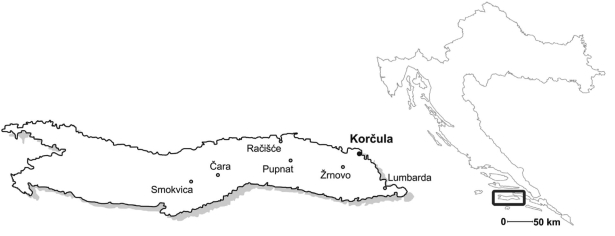
This study was performed in the eastern part of the island of Korčula, Croatia between March and December 2007. Healthy volunteers aged 18 and over from the town of Korčula and villages Lumbarda, Žrnovo, and Račišće (Figure 1) were invited to the study through mail, posters, radio, and personal contacts.
Figure 1.
Settlements on the island of Korčula, Croatia, included in the study
The study was approved by the Ethical Committee of the Medical School, University of Zagreb, and all examinees signed an informed consent. There was a total of 969 examinees included who had a number of quantitative phenotypic traits measured.
Biochemical analyses of 7 traits were performed on blood samples taken from the examinees after overnight fasting (collected between 8:30 and 9:30 am). We collected 9 mL clotted serum-gel sample for serum biochemistry, 2 × 10mL EDTA samples for DNA extraction or liquid nitrogen storage of aliquots for future transformation, and a 10 mL citrate sample for clotting factor analysis (S-Monovette, Sarstedt, Leicester, UK). Plasma and serum were rapidly frozen and stored at -80°C in 500 μL aliquots using standardized sample handling procedures. They were then transported frozen, within a maximum of 3 days, to a single biochemical laboratory (Salzer, Zagreb, Croatia). The laboratory was chosen as it was internationally accredited for performing this type of analysis and included in internal quality assessment by Roche and Olympus, as well as in external monitoring programs by Croatian reference center for biochemical measurements and RIQAS international agency for quality control (42). Methods of biochemical analyses performed to measure the levels of total cholesterol, LDL and HDL cholesterol, triglycerides, uric acid, albumin, and fibrinogen followed standard internationally agreed procedures and they were described in detail in previous articles (43). DNA extraction was performed using Nucleon kits (Tepnel, Manchester, UK), and 944 were genotyped at the GSF Research Center for Environment and Health in Munich, Germany. Genotyping was performed using Illumina HumanHap 370CNV (Illumina, San Diego, CA, USA), with a total of 346 027 SNP markers. Quality control of the genotype data, excluding markers with a call rate <98%, or minor allele frequency <2%, or out of Hardy-Weinberg equilibrium (P < 1E-10) left 316 730 SNPs in the analysis. Removal of individuals with a call rate of <97% left 898 people for inclusion in the analysis. Genome-wide associations between anthropometric phenotypes (adjusted for age and sex) and SNP markers were analyzed by the “mmscore” function of the GenABEL R statistical package (44), using an additive model. This score test for family based association accounts for pedigree structure and allows unbiased estimations of SNP allelic effect (45). No correction for multiple testing was applied. The relationship matrix used in this analysis was generated by the “identity-by-state” function of GenABEL which used identity-by-state (ibs) genotype sharing to determine the realized pair-wise kinship coefficient similarly to the PLINK genome function. All identified SNPs that reached significance or seemed to be suggestive were visualized using Haploview software, which was also used for calculation of linkage disequilibrium measures. The methods of genotyping and statistical genetic analyses necessary to perform a GWAS of a quantitative biological trait in an isolate population where familial relationships need to be taken into account were described in great detail in our previous publications (18). Pearson correlation coefficient was used in the correlation analysis performed in SPSS, version 13 (SPSS Inc, Chicago, IL, USA).
Results
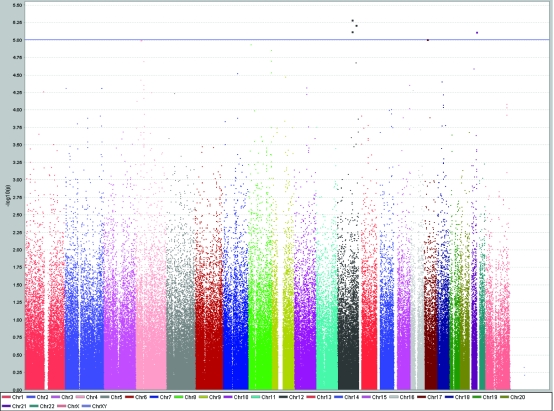
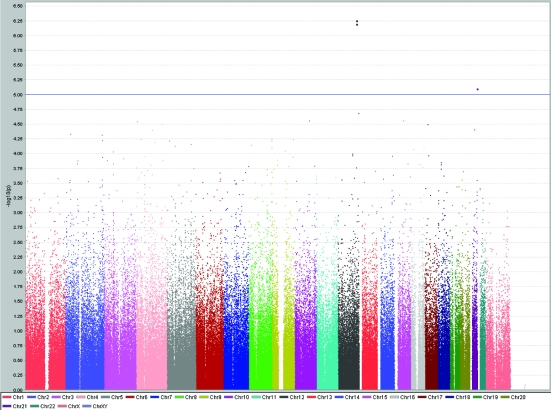
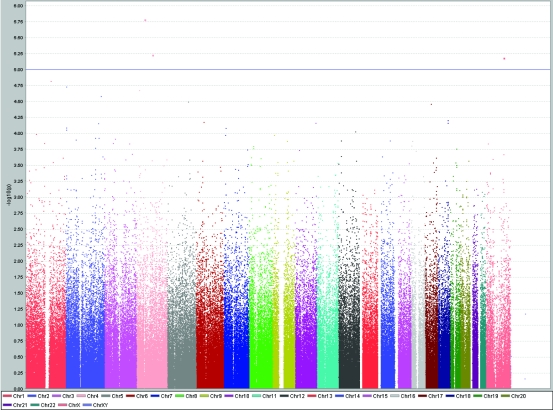
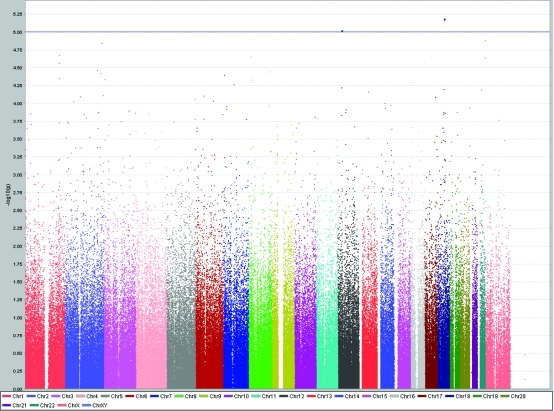
A total of 31 SNPs were associated with the investigated traits at the level of P < 1.0 × 10⁻⁵ (Table 1). SNP rs10444502 in kinase suppressor of ras 2 gene (KSR2) located on chromosome 12 was associated with total cholesterol levels (P = 6.1 × 10⁻⁶), while two nearby SNPs on the chromosome 12 (rs1493762 and rs10777332), each of them slightly more than 100 kilobases from KSR2, showed similar level of significance of association (Table 1, Figure 2). These two SNPs were in complete linkage disequilibrium (r2 = 1, D' = 1). This finding is particularly interesting because two other SNPs (rs4767631 and rs10444502) in the same gene (KSR2), located close to each other on chromosome 12, were associated with LDL cholesterol levels (Table 1, Figure 3). rs4767631 and rs10444502 are in weak linkage disequilibrium (r2 = 0.426, D' = 0.766).
Table 1.
A summary of single-nucleotide polymorphisms (SNP) that showed association with biochemical traits that reached levels of genome-wide significance of P < 10−5*†
| SNP for trait | Chromosome | Position | Effect allele | Effect allele frequency Korčula | Effect allele frequency HapMap | P value | β | Standard error (β) | Gene |
|---|---|---|---|---|---|---|---|---|---|
| Total cholesterol: | |||||||||
| rs7678182 | 4 | 32117038 | A | 0.428 | 0.367 | 9.9 × 10−06 | 0.119 | 0.027 | no genes +/− 200kb |
| rs1493762 | 12 | 90604046 | C | 0.158 | 0,180 | 7.6 × 10−06 | -0.224 | 0.050 | no genes +/− 200kb |
| rs10777332 | 12 | 90688433 | A | 0,113 | 0.161 | 5.1 × 10−06 | -0.235 | 0.051 | no genes +/− 200kb |
| rs10444502 | 12 | 116838254 | C | 0.279 | 0,267 | 6.1 × 10−06 | -0.165 | 0.036 | kinase supressor of ras 2 (KSR2) |
| rs8081810 | 17 | 17463669 | G | 0.1692 | 0.083 | 9.8 × 10−06 | 0.222 | 0.050 | phosphatidylethanolamine N-methyltransferase (PEMT) |
| rs2839619 | 21 | 43309246 | G | 0.396 | 0.525 | 7.6 × 10−06 | 0.127 | 0.028 | PBX/knotted 1 homeobox 1 (PKNOX1) |
| LDL cholesterol: | |||||||||
| rs4767631 | 12 | 116796126 | A | 0.313 | 0.333 | 5.5 × 10−07 | -0.167 | 0.033 | kinase supressor of ras 2 (KSR2) |
| rs10444502 | 12 | 116838254 | C | 0.280 | 0.267 | 6.4 × 10−07 | -0.182 | 0.036 | kinase supressor of ras 2 (KSR2) |
| rs2839619 | 21 | 43309246 | G | 0.395 | 0.525 | 8.0 × 10−06 | 0.127 | 0.028 | PBX/knotted 1 homeobox 1 (PKNOX1) |
| HDL cholesterol: | |||||||||
| rs4599440 | 4 | 61648868 | A | 0.233 | 0.275 | 1.6 × 10−06 | 0.199 | 0.041 | Latrophilin-3 precursor (LPHN3) on 100kb |
| rs871392 | 12 | 40458249 | A | 0.152 | 0,133 | 3.0 × 10−06 | -0.255 | 0.054 | no genes +/− 200kb |
| rs7499892 | 16 | 55564091 | A | 0.164 | 0.175 | 9.0 × 10−06 | -0.235 | 0.053 | cholesteryl ester transfer protein, plasma (CETP) |
| Triglycerides: | |||||||||
| rs346923 | 4 | 53106886 | A | 0.132 | 0.075 | 1.6 × 10−06 | 0.276 | 0.057 | ubiquitin specific protease 46 (USP46) |
| rs10516430 | 4 | 99556904 | A | 0.283 | 0.283 | 5.9 × 10−06 | -0.163 | 0.036 | RAP1, GTP-GDP dissociation stimulator 1 (RAP1GDS1) |
| rs5982533 | X | 111533120 | G | 0.221 | 0.167 | 6.6 × 10−06 | -0.227 | 0.050 | zinc finger CCHC domain containing 16 (ZCCHC16) |
| Uric acid: | |||||||||
| rs10805346 | 4 | 9529445 | G | 0.409 | 0.492 | 8.4 × 10−09 | -0.162 | 0.028 | solute carrier family 2, member 9 (SLC2A9) |
| rs13129697 | 4 | 9536065 | C | 0.249 | 0.350 | 2.5 × 10⁻¹² | -0.287 | 0.041 | solute carrier family 2, member 9 (SLC2A9) |
| rs737267 | 4 | 9543842 | A | 0.203 | 0.308 | 6.1 × 10−09 | -0.273 | 0.046 | solute carrier family 2, member 9 (SLC2A9) |
| rs4505821 | 4 | 9587192 | A | 0.207 | 0.175 | 4.1 × 10−06 | 0.215 | 0.046 | solute carrier family 2, member 9 (SLC2A9) |
| rs13131257 | 4 | 9590987 | A | 0.173 | 0.225 | 8.0 × 10−09 | -0.300 | 0.052 | solute carrier family 2, member 9 (SLC2A9) |
| rs6449213 | 4 | 9603313 | G | 0.163 | 0.242 | 1.2 × 10−09 | -0.330 | 0.054 | solute carrier family 2, member 9 (SLC2A9) |
| rs1014290 | 4 | 9610959 | G | 0.205 | 0.308 | 7.5 × 10⁻¹² | -0.320 | 0.046 | solute carrier family 2, member 9 (SLC2A9) |
| rs733175 | 4 | 9659239 | G | 0.162 | 0.242 | 1.8 × 10−06 | -0.252 | 0.052 | solute carrier family 2, member 9 (SLC2A9) |
| rs6820756 | 4 | 9671947 | A | 0.191 | 0.725 | 1.4 × 10−06 | -0.229 | 0.047 | solute carrier family 2, member 9 (SLC2A9) |
| Albumin: | |||||||||
| rs10505955 | 12 | 24985488 | G | 0.477 | 0.467 | 9.5 × 10−06 | 0.104 | 0.023 | branched chain aminotransferase 1 cytosolic (BCAT1) |
| rs10502868 | 18 | 41407947 | G | 0.075 | 0.092 | 6.5 × 10−06 | -0.359 | 0.079 | solute carrier family 14, member 2 (SLC14A2) |
| Fibrinogen: | |||||||||
| rs1490453 | 4 | 149540796 | A | 0.170 | 0.208 | 3.1 × 10−06 | 0.249 | 0.053 | nuclear receptor subfamily 3, group C, member 2 (NR3C2) |
| rs12207601 | 6 | 102462560 | G | 0.161 | 0.136 | 2.4 × 10−06 | -0.257 | 0.054 | glutamate receptor 6 (GRIK2) |
| rs6044777 | 20 | 17316542 | A | 0.174 | 0.183 | 7.9 × 10−06 | 0.227 | 0.050 | proprotein convertase subtilisin/kexin type 2 (PCSK2) |
| rs1840485 | X | 6229033 | A | 0.239 | 0.208 | 3.2 × 10−06 | -0.231 | 0.049 | X-linked neuroligin 4 on 73kb |
| rs7885458 | X | 6230474 | G | 0.238 | 0.208 | 2.9 × 10−06 | -0.233 | 0.049 | X-linked neuroligin 4 on 74kb |
*Abbreviations: LDL – low-density lipoprotein; HDL – high-density lipoprotein.
†The table summarizes SNPs, their positions on the chromosomes, P values, effect size and direction (expressed as β and standard error of β), effect allele, and implicated gene; the information on each gene was obtained from ref. 46.
Figure 2.
Results of genome-wide association study of total serum cholesterol levels (mmol/L) using Haploview software, showing peaks at chromosomes 4, 12, 17, and 21 reaching genome-wide significance level of P < 10−5.
Figure 3.
Results of genome-wide association study of serum low-density lipoprotein cholesterol levels (mmol/L) using Haploview software, showing peaks at chromosomes 12 and 21 reaching genome-wide significance level of P < 10−5.
Similarly, the SNP rs2839619 in PBX/knotted 1 homeobox 1 gene (PKNOX1) on chromosome 21 was associated with both total and LDL cholesterol levels. This makes KSR2 and PKNOX1 interesting candidates for further replication and follow-up functional studies. The remaining possible associations between genetic variants and the levels of total cholesterol were phosphatidylethanolamine N-methyltransferase gene (PEMT; P = 9.9 × 10⁻⁶) and rs7678182 on chromosome 4 with no known genes in proximity less than 100 kilobases (P = 9.9 × 10⁻⁶).
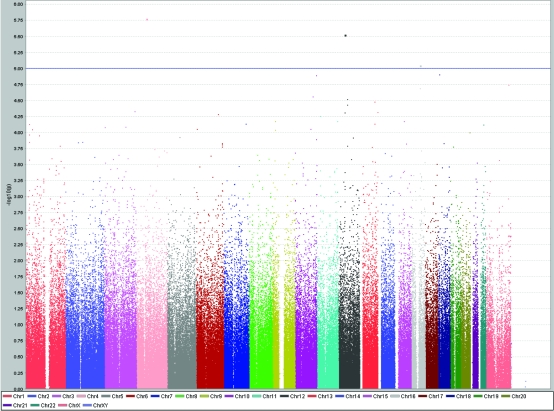
Genetic variants influencing HDL levels are shown in Figure 4. Two loci at chromosomes 4 and 12 showed high level of significance of association, but no known genes were present within 100 kilobases of the two loci. However, the third finding (rs7499892 on chromosome 16; P = 9.9 × 10⁻⁶) replicated an already reported association between cholesteryl ester transfer protein gene (CETP) and HDL, confirming the role of CETP gene in the regulation of plasma HDL levels. The correlation coefficient between LDL and HDL was 0.46 (P < 0.001), LDL and total cholesterol 0.53 (P < 0.001), and HDL and total cholesterol 0.83 (P < 0.001).
Figure 4.
Results of genome-wide association study of serum high-density lipoprotein cholesterol levels (mmol/L) using Haploview software, showing peaks at chromosomes 4, 12, and 16 reaching genome-wide significance level of P < 10−5.
We found 3 variants influencing triglyceride levels in Korčula island population at the level P < 1.0 × 10⁻⁵ (Table 1, Figure 5): SNP rs346923 on chromosome 4 found within ubiquitin specific protease 46 gene (USP46, P = 1.6 × 10⁻⁶); SNP rs10516430 on chromosome 4 within RAP1, GTP-GDP dissociation stimulator 1 gene (RAP1GDS1, P = 5.9 × 10⁻⁶); and SNP rs5982533 on chromosome X, within zinc finger CCHC domain 16 (ZCCHC16, P = 6.6 × 10⁻⁶).
Figure 5.
Results of genome-wide association study of serum triglyceride levels (mmol/L) using Haploview software, showing peaks at chromosomes 4 and X reaching genome-wide significance level of P < 10−5.
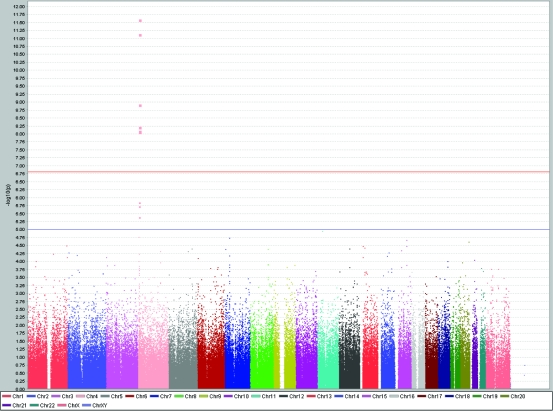
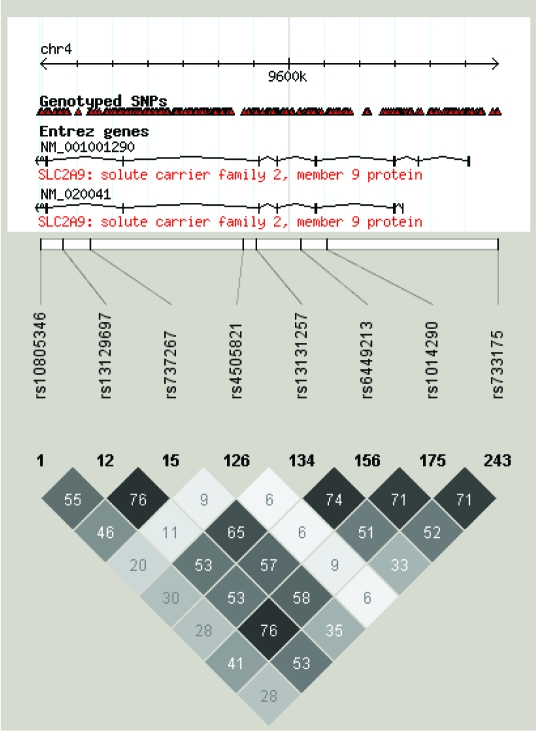
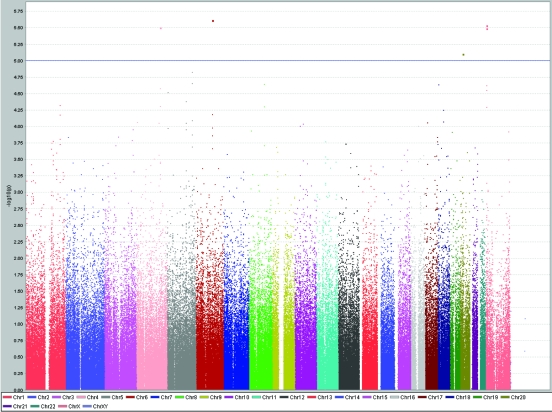
Table 1 shows that nearly one-third of 31 SNP association findings from this study implicated the role of SLC2A9 in uric acid regulation. Significance of this association ranged between P = 4.1 × 10⁻⁶ and 2.58 × 10⁻¹². The highly significant peak at chromosome 4, shown in Figure 6, represents a convincing replication of previous findings in other populations. Linkage disequilibrium pattern of SNPs associated with uric acid regulation for the CEU population (population of western European ancestry) is shown in Figure 7.
Figure 6.
Results of genome-wide association study of uric acid levels (µmol/L) using Haploview software, showing a single, highly significant peak at chromosome 4 reaching genome-wide significance level of P < 10−5.
Figure 7.
P linkage disequilibrium pattern of short nucleotide polymorphisms (SNP) associated with uric acid regulation for the CEU population (of western European ancestry) calculated using Haploview software, showing r2 values.
Genome-wide association study of albumin and fibrinogen conducted at Korčula island represents one of the first attempts to obtain insights into genetic regulation of those two traits. The most significant findings were possible roles of branched chain aminotransferase 1 cytosolic gene (BCAT1) and solute carrier family 14 member 2 gene (SLC14A2) in the regulation of albumin levels (Table 1, Figure 8). Fibrinogen yielded 5 results at the level P < 1.0 × 10⁻⁵ (Table 1, Figure 9). Two of them, located close to each other on chromosome X, were not found within or near to any known genes. Other results highlighted the possible role of the genes nuclear receptor subfamily 3 group C member 2 (NR3C2) on chromosome 4, glutamate receptor 6 (GRIK2) on chromosome 6, and proprotein convertase subtilisin/kexin type 2 (PCSK2) on chromosome 20.
Figure 8.
Results of genome-wide association study of serum albumin levels (g/L) using Haploview software, showing peaks at chromosomes 12 and 18 reaching genome-wide significance level of P < 10−5.
Figure 9.
Results of genome-wide association study of fibrinogen levels (g/L) using Haploview software, showing peaks at chromosomes 4, 6, 20, and X reaching genome-wide significance level of P < 10−5.
Discussion
Our study of nearly 1000 examinees focused on 7 standard biochemical measurements and revealed a total of 31 SNPs associated with the investigated traits at the level of P < 1.00 × 10⁻⁵. Nine of those SNPs (nearly one third) implicated the role of SLC2A9 in uric acid regulation, which is a replication of previous findings in other populations. The remaining 20 associations fell into statistical significance range P = 1.00 × 10⁻⁵-1.00 × 10⁻⁶. One of them replicated the association between CETP and HDL (47,48). Recent 3 GWASs identified nearly 20 new loci affecting total cholesterol, LDL cholesterol, HDL cholesterol, and triglycerides (18,49,50). All 3 studies confirmed the association between CETP gene and HDL cholesterol. However, loci identified in these 3 studies are different than 15 loci for serum lipid levels reported in our study. The replications of SLC2A9 and CETP findings add to reliability of other findings reported in this study and of genome-wide association approach in general.
Two nearby SNPs in KSR2 gene on chromosome 12 were associated with LDL cholesterol levels and another SNP in KSR2 gene with total cholesterol levels. This is an intriguing finding, because very little is known about the function of this gene in humans, but mice in which this gene has been knocked out show a striking phenotype of extreme obesity (51). Similarly, the SNP rs2839619 in PKNOX1 gene on chromosome 21 was associated with both total and LDL cholesterol levels. This is another intriguing finding, because the role of this gene in cancer development has long been hypothesized without ever gathering much strong evidence, but the most recent study found that the deficiency of PKNOX1 gene induced protection from diabetes and increased insulin sensitivity through a p160-mediated mechanism (52). In addition, the third gene implicated in cholesterol regulation, PEMT, is a liver-specific enzyme that converts phosphatidylethanolamine to phosphatidylcholine (53). It has been shown recently that mice that lack PEMT gene have reduced plasma levels of phosphatidylcholine and cholesterol in HDL (53). This makes all 3 genes – KSR2, PKNOX1, and PEMT – interesting candidate genes for the regulation of cholesterol levels. Further replication and functional studies will be needed to reaffirm their role in cholesterol regulation in humans.
Among the other findings, 7 associations were more than 100 kilobases away from the closest known gene and their true importance is yet to be replicated and explained. The remaining 8 findings implied possible associations between the three genes (deubiquitinating enzyme gene - USP46; exchange factor SMG P21 stimulatory GDP/GTP exchange protein gene - RAP1GDS1; and zinc finger CCHC domain 16 - ZCCHC16) and triglycerides; the two genes (branched-chain-amino-acid aminotransferase, cytosolic gene - BCAT1; and solute carrier family 14 (urea transporter) member 2 gene - SLC14A2) and albumin; and the three genes (nuclear receptor subfamily 3 group C member 2 gene - NR3C2; glutamate receptor, ionotropic, kainate 2 gene - GRIK2; and proprotein convertase subtilisin/kexin type 2 gene - PCSK2) and fibrinogen. No information is currently available on the roles and functions of these genes that would help understand their possible role in regulating levels of human biochemical traits. BCAT1 gene has been identified through genome-wide association studies as a gene that confers the risk of diabetes type 2 in several populations (54), while SLC14A2 is only known as a predicted urea transporter (55).
The results presented here suggest that some identified genes were implicated in more than one trait, suggesting that they might be responsible for the genetic action on the common underlying property for these traits. Others, such as PEMT gene, represent promising and biologically plausible functional candidates. The shortcomings of this study primarily include the potential low statistical power, which is a consequence of the limited population size encountered in any genetic isolate. The target for this study was to sample approximately 1000 examinees, which could be supplemented with more in the future, in order to increase the statistical power of the study. Additionally, the studies performed in isolated populations should always seek replication to ensure that the findings are indeed representative of wider general human populations and not limited to specific circumstances of a particular isolate. Finally, variants identified in this study all require functional follow-up and replication in other populations in order to establish their true significance in determination of human biochemical traits.
Acknowledgment
I. R. is the Editor for International Health Issues in the Croatian Medical Journal, and S. J. is the Dean of the University of Split School of Medicine, one of the owners of the journal. To ensure that any possible conflict of interest has been addressed, this article was reviewed according to best practice guidelines of international editorial organizations.
This work was supported by the grant 108-1080315-0302 to IR and several other grants from the Croatian Ministry for Science, Education, and Sport to Croatian co-authors. It was also supported by the grants from the Medical Research Council UK to HC, AFW, and IR; and European Commission FP6 STRP grant number 018947 (LSHG-CT-2006-01947) to HC. The authors collectively thank to very large number of individuals for their individual help in organizing, planning and carrying out the field work related to the project and data management.”
References
- 1.Pilia G, Chen WM, Scuteri A, Orru M, Albai G, Dei M, et al. Heritability of cardiovascular and personality traits in 6,148 Sardinians. PLoS Genet. 2006;2:e132. doi: 10.1371/journal.pgen.0020132. [DOI] [PMC free article] [PubMed] [Google Scholar]
- 2.Friedlander Y, Austin MA, Newman B, Edwards K, Mayer-Davis EI, King MC. Heritability of longitudinal changes in coronary-heart-disease risk factors in women twins. Am J Hum Genet. 1997;60:1502–12. doi: 10.1086/515462. [DOI] [PMC free article] [PubMed] [Google Scholar]
- 3.Kathiresan S, Musunuru K, Orho-Melander M. Defining the spectrum of alleles that contribute to blood lipid concentrations in humans. Curr Opin Lipidol. 2008;19:122–7. doi: 10.1097/MOL.0b013e3282f70296. [DOI] [PubMed] [Google Scholar]
- 4.Altshuler D, Daly MJ, Lander ES. Genetic mapping in human disease. Science. 2008;322:881–8. doi: 10.1126/science.1156409. [DOI] [PMC free article] [PubMed] [Google Scholar]
- 5.McCarthy MI, Hirschhorn JN. Genome-wide association studies: potential next steps on a genetic journey. Hum Mol Genet. 2008;17:R156–65. doi: 10.1093/hmg/ddn289. [DOI] [PMC free article] [PubMed] [Google Scholar]
- 6.Kooner JS, Chambers JC, Aguilar-Salinas CA, Hinds DA, Hyde CL, Warnes GR, et al. Genome-wide scan identifies variation in MLXIPL associated with plasma triglycerides. Nat Genet. 2008;40:149–51. doi: 10.1038/ng.2007.61. [DOI] [PubMed] [Google Scholar]
- 7.Kathiresan S, Melander O, Guiducci C, Surti A, Burtt NP, Rieder MJ, et al. Six new loci associated with blood low-density lipoprotein cholesterol, high-density lipoprotein cholesterol or triglycerides in humans. Nat Genet. 2008;40:189–97. doi: 10.1038/ng.75. [DOI] [PMC free article] [PubMed] [Google Scholar]
- 8.Willer CJ, Sanna S, Jackson AU, Scuteri A, Bonnycastle LL, Clarke R, et al. Newly identified loci that influence lipid concentrations and risk of coronary artery disease. Nat Genet. 2008;40:161–9. doi: 10.1038/ng.76. [DOI] [PMC free article] [PubMed] [Google Scholar]
- 9.Wallace C, Newhouse SJ, Braund P, Zhang F, Tobin M, Falchi M, et al. Genome-wide association study identifies genes for biomarkers of cardiovascular disease: serum urate and dyslipidemia. Am J Hum Genet. 2008;82:139–49. doi: 10.1016/j.ajhg.2007.11.001. [DOI] [PMC free article] [PubMed] [Google Scholar]
- 10.Sandhu MS, Waterworth DM, Debenham SL, Wheeler E, Papadakis K, Zhao JH, et al. LDL-cholesterol concentrations: a genome-wide association study. Lancet. 2008;371:483–91. doi: 10.1016/S0140-6736(08)60208-1. [DOI] [PMC free article] [PubMed] [Google Scholar]
- 11.Sing CF, Davignon J. Role of the apolipoprotein E polymorphism in determining normal plasma lipid and lipoprotein variation. Am J Hum Genet. 1985;37:268–85. [PMC free article] [PubMed] [Google Scholar]
- 12.Law SW, Lackner KJ, Fojo SS, Hospattankar A, Monge JC, Brewer HB., Jr The molecular biology of human apoA-I, apoA-II, apoC-II and apoB. Adv Exp Med Biol. 1986;201:151–62. doi: 10.1007/978-1-4684-1262-8_14. [DOI] [PubMed] [Google Scholar]
- 13.Aulchenko YS, Ripatti S, Lindqvist I, Boomsma D, Heid IM, Pramstaller PP, et al. Loci influencing lipid levels and coronary heart disease risk in 16 European population cohorts. Nat Genet. 2009;41:47–55. doi: 10.1038/ng.269. [DOI] [PMC free article] [PubMed] [Google Scholar]
- 14.Kathiresan S, Melander O, Anevski D, Guiducci C, Burtt NP, Roos C, et al. Polymorphisms associated with cholesterol and risk of cardiovascular events. N Engl J Med. 2008;358:1240–9. doi: 10.1056/NEJMoa0706728. [DOI] [PubMed] [Google Scholar]
- 15.Li S, Sanna S, Maschio A, Busonero F, Usala G, Mulas A, et al. The GLUT9 gene is associated with serum uric acid levels in Sardinia and Chianti cohorts. PLoS Genet. 2007;3:e194. doi: 10.1371/journal.pgen.0030194. [DOI] [PMC free article] [PubMed] [Google Scholar]
- 16.Wallace C, Newhouse SJ, Braund P, Zhang F, Tobin M, Falchi M, et al. Genome-wide association study identifies genes for biomarkers of cardiovascular disease: serum urate and dyslipidemia. Am J Hum Genet. 2008;82:139–49. doi: 10.1016/j.ajhg.2007.11.001. [DOI] [PMC free article] [PubMed] [Google Scholar]
- 17.Doring A, Gieger C, Mehta D, Gohlke H, Prokisch H, Coassin S, et al. SLC2A9 influences uric acid concentrations with pronounced sex-specific effects. Nat Genet. 2008;40:430–6. doi: 10.1038/ng.107. [DOI] [PubMed] [Google Scholar]
- 18.Vitart V, Rudan I, Hayward C, Gray NK, Floyd J, Palmer CN, et al. SLC2A9 is a newly identified urate transporter influencing serum urate concentration, urate excretion and gout. Nat Genet. 2008;40:437–42. doi: 10.1038/ng.106. [DOI] [PubMed] [Google Scholar]
- 19.Dehghan A, Kottgen A, Yang Q, Hwang SJ, Kao WL, Rivadeneira F, et al. Association of three genetic loci with uric acid concentration and risk of gout: a genome-wide association study. Lancet. 2008;372:1953–61. doi: 10.1016/S0140-6736(08)61343-4. [DOI] [PMC free article] [PubMed] [Google Scholar]
- 20.Yang Q, Kathiresan S, Lin JP, Tofler GH, O'Donnell CJ. Genome-wide association and linkage analyses of hemostatic factors and hematological phenotypes in the Framingham Heart Study. BMC Med Genet. 2007;8(Suppl 1):S12. doi: 10.1186/1471-2350-8-S1-S12. [DOI] [PMC free article] [PubMed] [Google Scholar]
- 21.Rudan I, Campbell H, Rudan P. Genetic epidemiological studies of eastern Adriatic Island isolates, Croatia: objective and strategies. Coll Antropol. 1999;23:531–46. [PubMed] [Google Scholar]
- 22.Vitart V, Biloglav Z, Hayward C, Janicijevic B, Smolej-Narancic N, Barac L, et al. 3000 years of solitude: extreme differentiation in the island isolates of Dalmatia, Croatia. Eur J Hum Genet. 2006;14:478–87. doi: 10.1038/sj.ejhg.5201589. [DOI] [PubMed] [Google Scholar]
- 23.Carothers AD, Rudan I, Kolcic I, Polasek O, Hayward C, Wright AF, et al. Estimating human inbreeding coefficients: comparison of genealogical and marker heterozygosity approaches. Ann Hum Genet. 2006;70:666–76. doi: 10.1111/j.1469-1809.2006.00263.x. [DOI] [PubMed] [Google Scholar]
- 24.Rudan I, Campbell H. Five reasons why inbreeding may have considerable effect on post-reproductive human health. Coll Antropol. 2004;28:943–50. [PubMed] [Google Scholar]
- 25.Rudan I, Carothers AD, Polasek O, Hayward C, Vitart V, Biloglav Z, et al. Quantifying the increase in average human heterozygosity due to urbanisation. Eur J Hum Genet. 2008;16:1097–102. doi: 10.1038/ejhg.2008.48. [DOI] [PubMed] [Google Scholar]
- 26.Zgaga L, Hayward C, Vatavuk Z, Bencic G, Zemunik T, Valkovic A, et al. High prevalence of glaucoma in Veli Brgud, Croatia, is caused by dominantly inherited T377M mutation in MYOC gene. Br J Ophthalmol. 2008;92:1567–8. doi: 10.1136/bjo.2008.143552. [DOI] [PubMed] [Google Scholar]
- 27.Rudan I, Biloglav Z, Carothers AD, Wright AF, Campbell H. Strategy for mapping quantitative trait loci (QTL) using human metapopulations. Croat Med J. 2006;47:532–42. [PMC free article] [PubMed] [Google Scholar]
- 28.Knezevic A, Polasek O, Gornik O, Rudan I, Campbell H, Hayward C, et al. Variability, heritability and environmental determinants of human plasma N-glycome. J Proteome Res. 2008;2009;8:694–701. doi: 10.1021/pr800737u. [DOI] [PubMed] [Google Scholar]
- 29.Pulanic D, Polasek O, Petrovecki M, Vorko-Jovic A, Pericic M, Barac Lauc L, et al. Effects of isolation and inbreeding on human quantitative traits: An example of biochemical markers of hemostasis and inflammation. Hum Biol. 2008;80:513–33. doi: 10.3378/1534-6617-80.5.513. [DOI] [PubMed] [Google Scholar]
- 30.McQuillan R, Leutenegger AL, Abdel-Rahman R, Franklin CS, Pericic M, Barac-Lauc L, et al. Runs of homozygosity in European populations. Am J Hum Genet. 2008;83:359–72. doi: 10.1016/j.ajhg.2008.08.007. [DOI] [PMC free article] [PubMed] [Google Scholar]
- 31.Smoljanovic A, Vorko-Jovic A, Kolcic I, Bernat R, Stojanovic D, Polasek O. Micro-scale socioeconomic inequalities and health indicators in a small isolated community of Vis Island, Croatia. Croat Med J. 2007;48:734–40. [PMC free article] [PubMed] [Google Scholar]
- 32.Kolcic I, Polasek O, Rudan I. Gender differences in spousal household material status estimation. J Epidemiol Community Health. 2009;63:175–6. doi: 10.1136/jech.2008.077123. [DOI] [PubMed] [Google Scholar]
- 33.Campbell H, Carothers AD, Rudan I, Hayward C, Biloglav Z, Barac L, et al. Effects of genome-wide heterozygosity on a range of biomedically relevant human quantitative traits. Hum Mol Genet. 2007;16:233–41. doi: 10.1093/hmg/ddl473. [DOI] [PubMed] [Google Scholar]
- 34.Polasek O, Kolcic I, Smoljanovic A, Stojanovic D, Grgic M, Ebling B, et al. Demonstrating reduced environmental and genetic diversity in human isolates by analysis of blood lipid levels. Croat Med J. 2006;47:649–55. [PMC free article] [PubMed] [Google Scholar]
- 35.Kolcic I, Vorko-Jovic A, Salzer B, Smoljanovic M, Kern J, Vuletic S. Metabolic syndrome in a metapopulation of Croatian island isolates. Croat Med J. 2006;47:585–92. [PMC free article] [PubMed] [Google Scholar]
- 36.Barbalic M, Skaric-Juric T, Cambien F, Barbaux S, Poirier O, Turek S, et al. Gene polymorphisms of the renin-angiotensin system and early development of hypertension. Am J Hypertens. 2006;19:837–42. doi: 10.1016/j.amjhyper.2006.01.004. [DOI] [PubMed] [Google Scholar]
- 37.Rudan I, Campbell H, Carothers A, Hastie ND, Wright AF. Contribution of consanguinuity to polygenic and multifactorial diseases. Nat Genet. 2006;38:1224–5. doi: 10.1038/ng1106-1224. [DOI] [PubMed] [Google Scholar]
- 38.Rudan I, Rudan D, Campbell H, Carothers A, Wright A, Smolej-Narancic N, et al. Inbreeding and risk of late-onset complex disease. J Med Genet. 2003;40:925–32. doi: 10.1136/jmg.40.12.925. [DOI] [PMC free article] [PubMed] [Google Scholar]
- 39.Rudan I, Smolej-Narancic N, Campbell H, Carothers A, Wright A, Janicijevic B, et al. Inbreeding and the genetic complexity of human hypertension. Genetics. 2003;163:1011–21. doi: 10.1093/genetics/163.3.1011. [DOI] [PMC free article] [PubMed] [Google Scholar]
- 40.Ivkovic V, Vitart V, Rudan I, Janicijevic B, Smolej-Narancic N, Skaric-Juric T, et al. The Eysenck personality factors: psychometric structure, reliability, heritability and phenotypic and genetic correlations with psychological distress in an isolated Croatian population. Pers Individ Dif. 2007;42:123–33. doi: 10.1016/j.paid.2006.06.025. [DOI] [Google Scholar]
- 41.Johansson A, Marroni F, Hayward C, Franklin CS, Kirichenko AV, Jonasson I, et al. Common variants in the JAZF1 gene associated with height identified by linkage and genome-wide association analysis. Hum Mol Genet. 2009;18:373–80. doi: 10.1093/hmg/ddn350. [DOI] [PMC free article] [PubMed] [Google Scholar]
- 42.Riqas-To-MultiQC. User manual. Available from: http://www.multiqc.com/Riqas2MultiQC.pdf Accessed: June 16, 2006.
- 43.Rudan I, Biloglav Z, Vorko-Jovic A, Kujundzic-Tiljak M, Stevanovic R, Ropac D, et al. Effects of inbreeding, endogamy, genetic admixture, and outbreeding on human health: A “1001 dalmatians” study. Croat Med J. 2006;47:601–10. [PMC free article] [PubMed] [Google Scholar]
- 44.Aulchenko YS, de Koning DJ, Haley C. Genomewide rapid association using mixed model and regression: a fast and simple method for genomewide pedigree-based quantitative trait loci association analysis. Genetics. 2007;177:577–85. doi: 10.1534/genetics.107.075614. [DOI] [PMC free article] [PubMed] [Google Scholar]
- 45.Chen WM, Abecasis GR. Family-based association tests for genomewide association scans. Am J Hum Genet. 2007;81:913–26. doi: 10.1086/521580. [DOI] [PMC free article] [PubMed] [Google Scholar]
- 46.Crown Human Genome Center and Weizmann Institute of Science. Genecards. Available from: http://www.genecards.org/index.shtml Accessed: January 27, 2009. Received: January 2, 2009 Accepted: January 27, 2009.
- 47.Heiba IM, DeMeester CA, Xia YR, Diep A, George VT, Amos CI, et al. Genetic contributions to quantitative lipoprotein traits associated with coronary artery disease: analysis of a large pedigree from the Bogalusa Heart Study. Am J Med Genet. 1993;47:875–83. doi: 10.1002/ajmg.1320470615. [DOI] [PubMed] [Google Scholar]
- 48.Corbex M, Poirier O, Fumeron F, Betoulle D, Evans A, Ruidavets JB, et al. Extensive association analysis between the CETP gene and coronary heart disease phenotypes reveals several putative functional polymorphisms and gene-environment interaction. Genet Epidemiol. 2000;19:64–80. doi: 10.1002/1098-2272(200007)19:1<64::AID-GEPI5>3.0.CO;2-E. [DOI] [PubMed] [Google Scholar]
- 49.Kathiresan S, Willer CJ, Peloso GM, Demissie S, Musunuru K, Schadt EE, et al. Common variants at 30 loci contribute to polygenic dyslipidemia. Nat Genet. 2009;41:56–65. doi: 10.1038/ng.291. [DOI] [PMC free article] [PubMed] [Google Scholar]
- 50.Sabatti C, Service SK, Hartikainen AL, Pouta A, Ripatti S, Brodsky J, et al. Genome-wide association analysis of metabolic traits in a birth cohort from a founder population. Nat Genet. 2009;41:35–46. doi: 10.1038/ng.271. [DOI] [PMC free article] [PubMed] [Google Scholar]
- 51.Brommage R, Desai U, Revelli JP, Donoviel DB, Fontenot GK, Dacosta CM, et al. High-throughput screening of mouse knockout lines identifies true lean and obese phenotypes. Obesity (Silver Spring) 2008;16:2362–7. doi: 10.1038/oby.2008.361. [DOI] [PubMed] [Google Scholar]
- 52.Oriente F, Fernandez Diaz LC, Miele C, Iovino S, Mori S, Diaz VM, et al. Prep1 deficiency induces protection from diabetes and increased insulin sensitivity through a p160-mediated mechanism. Mol Cell Biol. 2008;28:5634–45. doi: 10.1128/MCB.00117-08. [DOI] [PMC free article] [PubMed] [Google Scholar]
- 53.Robichaud JC, Francis GA, Vance DE. A role for hepatic scavenger receptor class B, type I in decreasing high density lipoprotein levels in mice that lack phosphatidylethanolamine N-methyltransferase. J Biol Chem. 2008;283:35496–506. doi: 10.1074/jbc.M807433200. [DOI] [PubMed] [Google Scholar]
- 54.Rampersaud E, Damcott CM, Fu M, Shen H, McArdle P, Shi X, et al. Identification of novel candidate genes for type 2 diabetes from a genome-wide association scan in the Old Order Amish: evidence for replication from diabetes-related quantitative traits and from independent populations. Diabetes. 2007;56:3053–62. doi: 10.2337/db07-0457. [DOI] [PubMed] [Google Scholar]
- 55.Shayakul C, Hediger MA. The SLC14 gene family of urea transporters. Pflugers Arch. 2004;447:603–9. doi: 10.1007/s00424-003-1124-x. [DOI] [PubMed] [Google Scholar]


