

Abstract
Purpose
To evaluate refractive error, axial length, and relative peripheral refractive error before, during the year of, and after the onset of myopia in children who became myopic compared with emmetropes.
Methods
Subjects were 605 children 6 to 14 years of age who became myopic (at least −0.75 D in each meridian) and 374 emmetropic (between −0.25 D and + 1.00 D in each meridian at all visits) children participating between 1995 and 2003 in the Collaborative Longitudinal Evaluation of Ethnicity and Refractive Error (CLEERE) Study. Axial length was measured annually by A-scan ultrasonography. Relative peripheral refractive error (the difference between the spherical equivalent cycloplegic autorefraction 30° in the nasal visual field and in primary gaze) was measured using either of two autorefractors (R-1; Canon, Lake Success, NY [no longer manufactured] or WR 5100-K; Grand Seiko, Hiroshima, Japan). Refractive error was measured with the same autorefractor with the subjects under cycloplegia. Each variable in children who became myopic was compared to age-, gender-, and ethnicity-matched model estimates of emmetrope values for each annual visit from 5 years before through 5 years after the onset of myopia.
Results
In the sample as a whole, children who became myopic had less hyperopia and longer axial lengths than did emmetropes before and after the onset of myopia (4 years before through 5 years after for refractive error and 3 years before through 5 years after for axial length; P < 0.0001 for each year). Children who became myopic had more hyperopic relative peripheral refractive errors than did emmetropes from 2 years before onset through 5 years after onset of myopia (P < 0.002 for each year). The fastest rate of change in refractive error, axial length, and relative peripheral refractive error occurred during the year before onset rather than in any year after onset. Relative peripheral refractive error remained at a consistent level of hyperopia each year after onset, whereas axial length and myopic refractive error continued to elongate and to progress, respectively, although at slower rates compared with the rate at onset.
Conclusions
A more negative refractive error, longer axial length, and more hyperopic relative peripheral refractive error in addition to faster rates of change in these variables may be useful for predicting the onset of myopia, but only within a span of 2 to 4 years before onset. Becoming myopic does not appear to be characterized by a consistent rate of increase in refractive error and expansion of the globe. Acceleration in myopia progression, axial elongation, and peripheral hyperopia in the year prior to onset followed by relatively slower, more stable rates of change after onset suggests that more than one factor may influence ocular expansion during myopia onset and progression.
The optical role played by the ocular components once myopia has occurred is well understood; axial length exceeds the focal length formed by the refractive elements of the eye. Compared with other ocular components such as the cornea and crystalline lens, axial length is typically regarded as the primary determinant of refractive error. The correlation with refractive error is larger for axial length than for any other component (0.76).1 The correlation between change in axial length and progression of myopia, documented in recent bifocal clinical trials, is also quite high, between 0.77 and 0.89.2,3 Despite playing a primary role in prevalent myopia and myopic progression, the changes in axial length before and at the onset of myopia have not been documented extensively. Goss and Jackson4 found no differences 1 year before the onset of myopia between axial length in 24 children who became myopic compared to 56 children who remained emmetropic.4 However, this finding may be due to a small sample size and limited statistical power. In a study with a larger sample, Zadnik et al.5 have reported that children at greater risk for the onset of myopia by virtue of having two myopic parents have longer axial lengths than do other nonmyopic children with one or no myopic parents. A greater axial length in nonmyopic third-grade children was also a risk factor for the onset of myopia by the eighth grade.6 If an excessively long axial length in children is to be used as a predictive factor, the timing of axial elongation before myopia's onset is of particular interest.
The rate of growth in axial length before, during, and after myopia's onset has not been documented in detail. Several patterns are possible for growth. Children at risk for the development of myopia may have an excessively long axial length before onset, but display a similar rate of increase compared with that in children who remain emmetropic. As long as axial growth outpaced the loss of diopters from the cornea and crystalline lens, myopia would be the result of a slow, steady loss of hyperopia. Another possibility is for the axial length in children who become myopic to exhibit a more rapid rate of growth than that in children who remain emmetropic. How consistent this rate may be over time is another open question. The coincidence of any acceleration in growth with respect to environmental exposures such as changing levels of near work or accommodative lag could also shed light on the mechanisms underlying the development of myopia.
In addition to having excessive length, myopic eyes have been reported to have altered shapes relative to emmetropic or hyperopic eyes (i.e., the eye has grown longer axially than equatorially to become either relatively less oblate or prolate in shape). This asymmetry in shape has been detected by x-ray,7,8 interferometry,9 and magnetic resonance scanning.10,11 A recent MRI study found that the myopic eye is typically oblate and only rarely prolate, and that the retinal contour becomes less oblate with increasing myopia.11 Alterations in shape also influence peripheral refractions, with myopic eyes typically having relatively more hyperopic peripheral refractive errors than do emmetropic eyes.12–17 Studies consistently have shown considerable variability and overlap in shape as a function of refractive error group.9,18–20 Of note, there are related meridional differences (i.e., peripheral refractive errors were more hyperopic relative to central errors in the horizontal meridian but were more myopic than central errors in the vertical meridian).21 This corresponds to reports of a greater vertical height than horizontal width of the globe,18 along with more relative oblateness vertically than horizontally, as a function of degree of myopia.11
Despite playing a secondary role to axial length in myopia, there is increased interest in peripheral refractive error as a risk factor for the onset of myopia.9,17,19,20 This interest stems in part from clinical data. A longitudinal study of pilots found that relative peripheral hyperopia in an emmetropic eye was associated with an increased risk of the development of myopia.22 Animal experiments also support a potential role for peripheral hyperopic defocus in myopia development. Ordinarily, the emphasis is on the central retinal defocus from lenses imposing simulated hyperopic refractive errors and the compensatory axial growth response.23–26 If stimuli to the periphery are also effective in altering ocular growth, as recently demonstrated in monkeys,27 then relative hyperopia in the periphery of an emmetropic eye may eventually lead to accelerated overall growth and myopia. An interesting challenge to this model comes from experimental findings that control of the growth of the eye is local to the retina and specific to the region of retina receiving the altered visual input.28–30 An eye would have to ignore the emmetropic foveal signal for foveal refraction to be influenced by peripheral defocus. The spatial extent of this local control is not known, however, and it is possible that the growth triggered by the peripheral zone of hyperopic defocus is sufficient to carry the fovea along despite the lack of defocus at the fovea.19,27
Mechanical factors may also explain the relatively less oblate shape of myopic eyes—factors such as differences in the size of the orbit axially compared with equatorially18 and anisotropy in the choroid.31 The crystalline lens may also be a source of equatorial restriction. The pattern of development from infancy through the age of 9 or 10 years is for the crystalline lens to thin, flatten, and lose power.32,33 Growth curves for these lens characteristics show departures from this pattern after the age of 10 years, close in time to the peak ages for the onset of myopia.32 Equatorial stretch, proposed by van Alphen1 as a factor relating axial growth with decreasing power of the crystalline lens, may be responsible for the thinning and flattening pattern of lens development before the age of 10 years. Restricted growth in the equatorial plane may occur if the ocular size exceeds the ability of the crystalline lens to stretch in response.16
The purpose of the current study was to examine the behavior of axial length and relative peripheral refractive error before, during, and after the onset of myopia in comparison to the pattern of development in children who remain emmetropic. This approach allows for comparison between what occurs during the process of becoming myopic and what is expected during normal development. The analysis may identify predictive factors, but is not suited to evaluate their utility as predictors. Time is arranged relative to the year of myopia onset rather than to age, making use of later information that would not be known at the time it was needed for prediction.
Methods
Subjects were children 6 to 14 years of age participating between 1995 and 2003 in the Collaborative Longitudinal Evaluation of Ethnicity and Refractive Error (CLEERE) Study, a cohort study of ocular component development and risk factors for the onset of myopia in children of various ethnic backgrounds. The CLEERE Study is an extension of the Orinda Longitudinal Study of Myopia (OLSM), begun in 1989 in the predominantly white community of Orinda, California. To improve generalizability with respect to ethnicity, four additional clinic sites were added to recruit predominantly African American children (Eutaw, AL), Asian children (Irvine, CA), and Hispanic children (Houston, TX). Testing of Native American children was also under way in Tucson, Arizona, as of 2000; however, follow-up was not sufficient at the time of the current paper to include these children in any specific comparisons. Each affiliated university's institutional review board (University of Alabama at Birmingham; University of California, Berkeley; University of Houston; The Ohio State University; and the Southern California College of Optometry) approved informed consent documents according to the tenets of the Declaration of Helsinki. Parents provided consent and children assent before the children were examined.
Ethnic group designation was determined after completion of a medical history form by a parent. Parents selected one of the following six ethnic designations: (corresponding to the categories used by the National Institutes of Health as of 1997 when ethnic data were first gathered): American Indian or Alaskan Native; Asian or Pacific Islander; black, not of Hispanic origin; Hispanic; white, not of Hispanic origin; or Other, or unknown. Ethnicity was assigned to the target ethnic group for the given site when parents provided more than one ethnic designation that included the site's targeted ethnicity (2% of subjects). If the parents provided more than one ethnic designation and neither included the site's targeted designation, ethnicity was assigned to the nonwhite of the two (0.6% of subjects). Any missing parent-reported ethnicity was filled in from investigator observation (2% of subjects). Investigator observation shows excellent agreement with parent-reported ethnicity.34 There were 4929 children enrolled in CLEERE between 1989 and 2004. Of these, 374 children met the myopia criterion on the first visit and were not considered further in the study. Of the remaining 4555, there were 569 children with an ethnic designation of Native American or Other who were excluded because of inadequate follow-up for analysis at this time. An additional 368 had no observations after 1995 when peripheral refraction measurements began, leaving 3618 children for analysis (49% female, 16% Asian, 20% black, 28% Hispanic, and 36% white). There were 374 children with refraction between −0.25 and + 1.00 D (exclusive) in each meridian at all study visits by cycloplegic autorefraction and with peripheral refraction observations that could be used to develop emmetropic models. There were 605 children with at least one nonmyopic visit who became myopic by at least −0.75 D in each principal meridian and had peripheral refraction measurements. The remaining children who did not fall into either of these two categories (i.e., children who neither became myopic nor were emmetropic but were either hyperopic, had simple hyperopic or myopic astigmatism, or were mixed astigmats on at least one visit) were not analyzed (n = 2639). Although the number excluded was large, the inclusion criteria were strict so that clearer contrasts might be drawn between two distinct and unambiguous groups. The number of became-myopic children at each study visit is given in Table 1.
Table 1.
Number of Became-Myopic Children at Each Study Visit
| −5 | −4 | −3 | −2 | −1 | 0 | +1 | +2 | +3 | +4 | +5 | |
|---|---|---|---|---|---|---|---|---|---|---|---|
| n | 60 | 169 | 293 | 436 | 523 | 534 | 367 | 255 | 145 | 66 | 27 |
Trained and certified examiners measured central refractive error and peripheral refraction on the right eye of subjects with one refractor (Canon R-1 autorefractor; Canon USA, Lake Success, NY; no longer manufactured) between 1989 and 2000, and another one (WR 5100-K; Grand Seiko Co., Hiroshima, Japan) from 2001 to 2003. Subjects were tested after mydriasis and cycloplegia. When subjects had an iris color of grade 1 or 2,35 testing was performed 30 minutes after 1 drop of proparacaine 0.5% and 2 drops of tropicamide 1%. When subjects had an iris color darker than grade 2, testing was performed 30 minutes after 1 drop of proparacaine 0.5% and 1 drop each of tropicamide 1% and cyclopentolate 1%.36 The protocol for measurement has been described in detail previously.16 Subjects first fixated a reduced Snellen target through a +4.00-D Badal lens in primary gaze. Ten autorefractor measurements were made according to our standard protocol for cycloplegic autorefraction.37 Immediately after measurement in primary gaze, the track holding the Snellen target was rotated 30° and placed before a front surface mirror on the patient's right. Five autorefraction measurements were then taken in peripheral gaze. Relative peripheral refractive error equals the spherical equivalent of the average refraction in primary gaze subtracted from the spherical equivalent of the average refractive error in 30° temporal gaze (i.e., the autorefractor axis directed 30° in the nasal visual field of the subject's right eye). Axial ocular dimensions were measured by A-scan ultrasonography (Model 820; Carl Zeiss Meditec, Inc., Dublin, CA), consisting of five readings with a hand-held probe in semiautomatic mode.
Emmetrope Model
Separate growth curves were constructed for emmetropes for refractive error, axial length, and relative peripheral refractive error as a function of age. The best-fitting models as defined by the Akaike Information Criterion38 were those that incorporated the natural log of age plus the natural log of age squared for all three dependent measures. These methods have been described in detail previously for modeling of emmetropic component development.39 Gender and ethnicity and the interaction between ethnicity and age were subsequently included in the models. The regression coefficients for ln(age) and ln(age)2 for each ocular variable, gender, and ethnic group were derived using mixed ANOVA modeling with repeated measures (SAS ver. 9.1; SAS Institute, Cary, NC).
Age-Matched Myopic Data
To be included in the became-myopic group, a subject had to be nonmyopic on at least one visit before a visit during which myopia was diagnosed. The year the became-myopic subject first met the myopia criterion was defined as year 0, the year of onset. The first study year before onset was −1, 2 years prior was −2, and so forth out to −5 years before onset. The number of children in years 0 and −1 in Table 1 are not the same, because some children missed visits between their last nonmyopic visit and their onset visit. Each study year after onset for a given subject was designated +1, +2, and so forth out to +5. The age of each became-myopic subject at each study visit was applied to the appropriate emmetrope regression equation. This provided an age-, gender-, and ethnicity-matched emmetropic value of each ocular variable for every became-myopic data point. Mixed modeling was then used to compare the mean difference between became-myopic data and the emmetrope model values as a function of study visit for each ocular variable. A significance level of P < 0.01 was used in consideration of the large sample size. This level of adjustment is somewhat arbitrary, but represents a compromise between filtering out spurious findings, while allowing small differences to reach significance. Throughout the rest of the text, became-myopic refers to the data from children in that category and emmetrope refers to the values estimated from the model derived from emmetropic children's data.
Results
Figure 1A displays the average refractive error of became-myopic children compared with emmetropes as a function of years relative to the onset of myopia. Emmetropes had a positive spherical equivalent refractive error of +0.50 D on average that decreased by only ∼0.25 D throughout the study period. This level of stability among emmetropes is maintained in part by definition in this group. Became-myopic children underwent larger decreases in hyperopia to reach −3.80 D of myopia by +5 years after onset. The amount of difference between the two groups by year relative to onset is shown in Figure 1B. Became-myopic and emmetropic children had similar levels of spherical equivalent refractive error −5 years before onset (P = 0.48). Became-myopic children had less hyperopia or more myopia compared with emmetropes from −4 years before onset through +5 years after onset (P < 0.0001 for each year). The difference between groups increased monotonically, reaching a maximum of −4.10 D in year +5. The difference between the two groups in longitudinal change in refractive error is shown in Figure 1C. The change in refractive error was significantly greater for became-myopic children compared with emmetropes starting between visits −5 and −4 and continuing every year thereafter (P = 0.006 between −5 and −4, P < 0.0001 for each subsequent interval). The magnitude of the difference in the rate of change between groups was largest, −0.81 D, between −1 year before onset and the year of onset, i.e., the time of most rapid refractive change was during the year before onset. This result is in contrast to progression rates of −0.39 to −0.52 D per year for the years after onset (Fig. 1C). We explored whether this finding was the product of varying samples of children in each year by analyzing only those children who had data at each visit from years −2 to +2. Results for these 145 children (represented by the open squares between visits −2 and +2 in panel B of Figs. 1,2, 3) were essentially identical with those when the number of children analyzed varied by visit.
Figure 1.
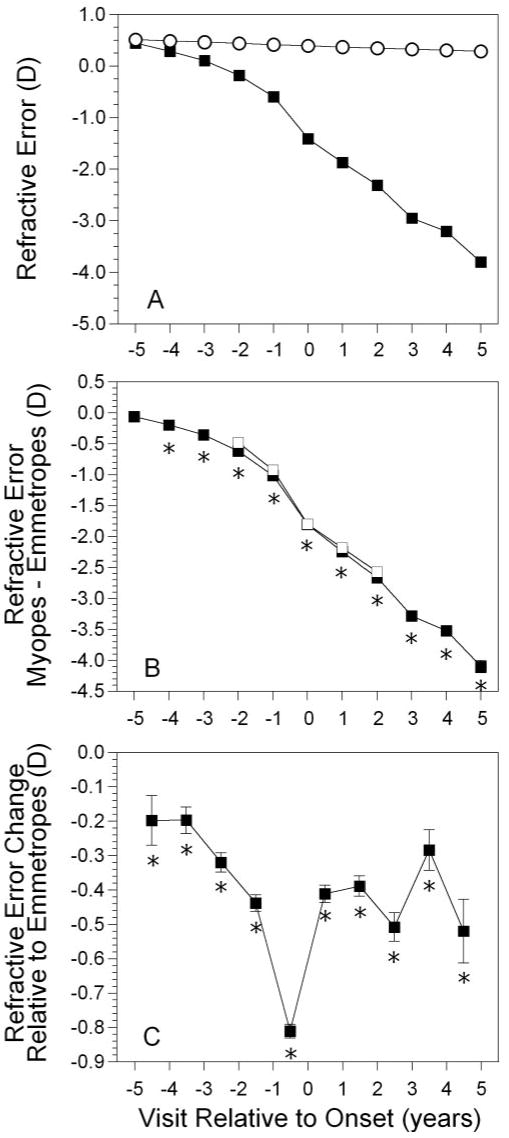
Spherical equivalent refractive error as a function of annual visit relative to the onset of myopia (−5 years before to +5 years after, with onset designated as year 0). (A) Data for (▪) became-myopic children and (○) emmetropes. Error bars, SEM. (B) The difference between became-myopic and emmetrope data (▪). (□) Subset of children with longitudinal data across all five visits from −2 to +2 (n = 145). (C) Longitudinal change in refractive error between visits for became-myopic children (note the points occur between years). *Significant differences between became-myopic and emmetropic children (i.e., the difference in change between groups is significant relative to 0).
Figure 2.
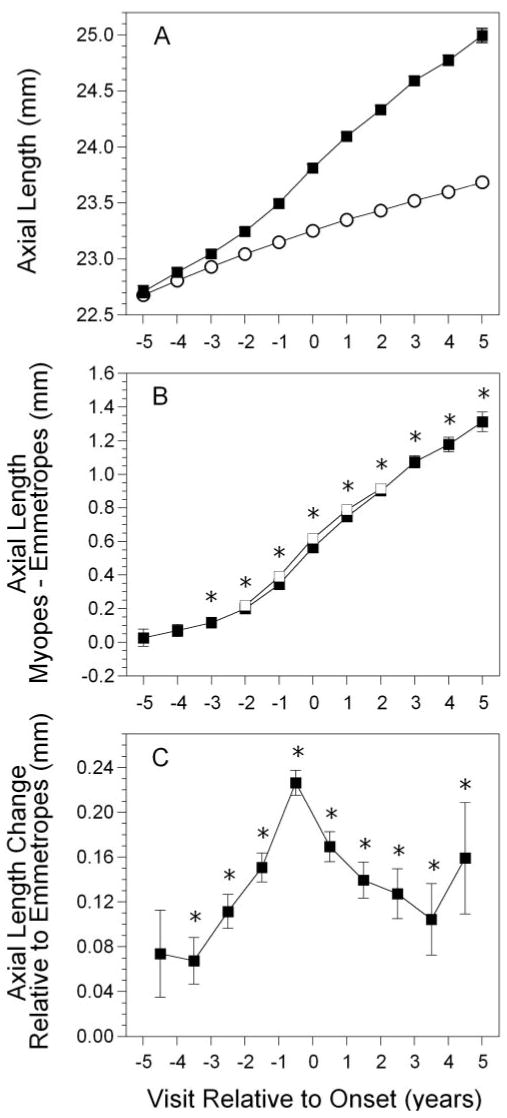
Axial length in the became-myopic group (A); difference in axial length between myopes and emmetropes, with the subset of children described in Figure 1 (B); and change in axial length between visits in the became-myopic group (C), as a function of annual visit relative to the onset of myopia. Symbols are as in Figure 1.
Figure 3.
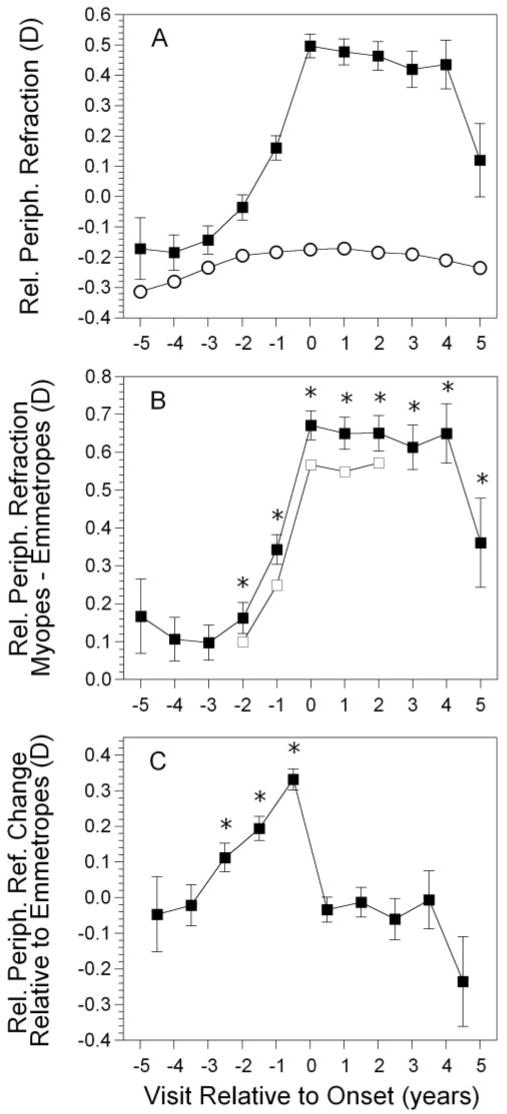
Relative peripheral refractive error in the became-myopic group (A); difference in error between myopes and emmetropes (B); and change in error between visits in the became-myopic group (C), as a function of annual visit relative to the onset of myopia. Symbols are as in Figure 1.
Figure 2A displays the average axial length of became-myopic children compared with emmetropes as a function of years relative to the onset of myopia. The initial axial length in emmetropes was 22.7 mm, increasing at a steady rate of approximately 0.10 mm per year. The axial length of became-myopic children was eventually, but not initially, longer than in emmetropes. The amount of difference between the two groups by year relative to onset is shown in Figure 2B. Became-myopic and emmetropic children had similar axial lengths at −5 and −4 years before onset. Became-myopic children had longer axial lengths compared with emmetropes from −3 years before onset through +5 years after onset (P = 0.0004 for year −3, P ≤ 0.0001 for all subsequent years). This pattern was similar to the time course for refractive error but later in significance by 1 year. The difference between groups increased monotonically, reaching a maximum value of 1.31 mm longer in became-myopic children in year +5. The difference between the two groups in longitudinal change in axial length is shown in Figure 2C. The changes in axial length taking place between −5 and −4 years before onset were not significantly different between the two groups (P = 0.057). The change in axial length was significantly greater in children who became myopic compared with emmetropes, starting between visits −4 and −3 and continuing every year thereafter (P < 0.0014 for each interval). The magnitude of the difference in the rate of change between groups was largest, 0.23 mm, between −1 year before onset and the year of onset. This is in contrast to elongation rates of 0.10 to 0.17 mm per year for the years after onset (Fig. 2C). As with the change in refractive error, the time of most rapid ocular elongation was during the year immediately before onset. Again, children with data between each visit −2 to +2 showed a pattern similar to that of the sample as a whole (Fig. 2B, open squares).
Figure 3A displays the average relative peripheral refractive error of became-myopic children compared with emmetropes, as a function of years relative to the onset of myopia. Emmetropes had a myopic relative peripheral refraction between −0.17 and −0.31 D throughout the study period. The relative peripheral refractive error in became-myopic children was also slightly myopic initially, but then became more hyperopic. The amount of difference between the two groups by year relative to onset is shown in Figure 3B. Became myopic and emmetropic children had similar relative peripheral refractive errors at −5 through −3 years before onset. Became-myopic children had a more hyperopic relative peripheral refraction than did emmetropes from −2 years before onset through +5 years after onset (P < 0.0001 for years −3 through +4; P = 0.002 for year +5). This pattern represents a delay of 1 year compared with axial length and 2 years compared with refractive error.
Unlike refractive error and axial length, the difference in relative peripheral refractive error between groups did not increase monotonically. The difference during the year of onset was 0.67 D, nearly the same as the maximum difference of 0.65 D in year +4. The difference between the two groups in longitudinal change in relative peripheral refraction is shown in Figure 3C. The changes in relative peripheral refraction taking place between −5 and −4 years and between −4 and −3 years before onset were not significantly different between the two groups (P < 0.71 for each interval). The change in relative peripheral refraction was significantly greater in children who became myopic compared with emmetropes starting between visits −3 and −2 (0.11 D; P < 0.006), −2 and −1 (0.19 D; P < 0.0001) and −1 and 0 (0.33 D; P < 0.0001). This represents a 2-year delay compared with refractive error and a 1-year delay compared with axial length. The change in relative peripheral refraction was different from refractive error and axial length, in that no significant change took place between 0 and +1 years, or any subsequent interval (P < 0.93 for all years). Relative peripheral refraction was relatively hyperopic and stable from the year of onset through year +5 (Fig. 3C). Again, children with data between each visit −2 to +2 showed a pattern similar to that of the sample as a whole (Fig. 3B).
Ethnicity
Figure 4 presents the difference between spherical equivalent refractive error in became-myopic children and the corresponding emmetrope values as a function of ethnic group. There were no differences as a function of ethnicity for any year before onset. At and after onset, Asian became-myopic children tended to have a more negative spherical equivalent refractive error than did Hispanic and African-American (visits 0 though +5) and white (visits +1 though +3) became-myopic children. White became-myopic children were more myopic than Hispanic became-myopic children in year +3 only and more myopic than African-American became-myopic children in years +1 through +5. Hispanic and African-American became-myopic children were not significantly different from each other in any year after onset except for more myopia in Hispanic became-myopic children in year + 2.
Figure 4.
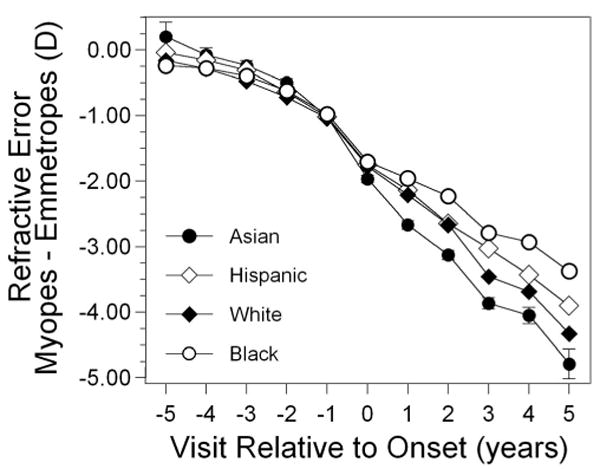
Spherical equivalent refractive error as a function of visit relative to the onset of myopia and to ethnicity. Error was similar between ethnic groups. Representative error bars (±SEM) are included for Asians only, for clarity.
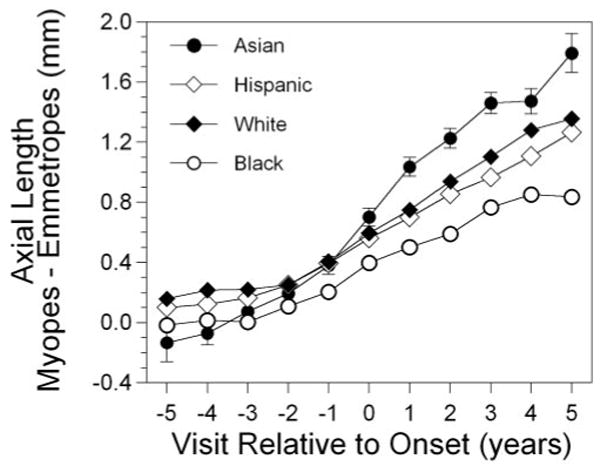
Figure 5 presents the difference in axial length between became-myopic children and the corresponding emmetrope values as a function of ethnic group. There were no differences as a function of ethnicity for any year before onset, with the exception of Asian became-myopic children, who had a shorter axial length than did white became-myopic children in year −1. Consistent with having more myopia at and after onset, Asian became-myopic children had longer axial lengths than did Hispanic became-myopic children in years +1 through +5, compared with African-American became-myopic children in years 0 through +5, and compared with white became-myopic children in years +1 through +3 and year +5. White became-myopic children had longer axial lengths than did African-American became-myopic children in years +1 through +5. White and Hispanic became-myopic children were not significantly different from each other in any year after onset. Hispanic and African-American became-myopic children were not significantly different from each other in any year after onset except for longer axial lengths in Hispanic became-myopic children in year +2.
Figure 5.
Axial length as a function of visit relative to the onset of myopia and to ethnicity.
Figure 6 presents the difference in relative peripheral refractive error between became-myopic children and the corresponding emmetrope data as a function of ethnic group. Asian became-myopic children tended to have more relative peripheral hyperopia and African-American became-myopic children tended to have little relative peripheral hyperopia, both before and after onset (difference significant in years −3 through +5). Asian became-myopic children also tended to have more relative peripheral hyperopia than Hispanic became-myopic children in years −1 through +5 and than white became-myopic children, sporadically, in years −3, −1, and +1. African-American became-myopic children had significantly less relative peripheral hyperopia than did Hispanic became-myopic children in years −3 through +3 and than white became-myopic children in years −2 through +4. White became-myopic children tended to have more relative peripheral hyperopia than Hispanic became-myopic children in years +1, +3, and +4. The rank order for relative peripheral refraction after onset generally followed the opposite of the rank order for refractive error seen in Figure 4. Asian and white became-myopic children maintained a significant level of relative peripheral hyperopia before and after onset, in years −3 through +5 and −1 through +5, respectively, whereas African-American became-myopic children showed a significant level of relative peripheral hyperopia only in years −3 and 0. Of note, Hispanic became-myopic children displayed a significant level of relative peripheral hyperopia before, during, and for several years after onset (years −2 through +4) that decreased to become nonsignificant in year +5.
Figure 6.

Relative peripheral refractive error as a function of visit relative to the onset of myopia and to ethnicity.
We also explored the relationship between wearing an optical correction and relative peripheral refractive error in became-myopic children. As shown in Table 2, refractive correction was uncommon before visit 0 and was worn by most of the became-myopic children by visit +2. Relative peripheral refractive error was not significantly different between became-myopic children wearing or not wearing a refractive correction at any visit (Fig. 7; P = 0.069). This parallel pattern suggests no effect of correction on relative peripheral refractive error.
Table 2.
Number (%) of Became-Myopic Children Wearing a Refractive Correction or No Refractive Correction by Visit
| Visit | With Correction n (%) |
Without Correction n (%) |
|---|---|---|
| −2 | 31 (7.1) | 405 (92.9) |
| −1 | 60 (11.5) | 463 (88.5) |
| 0 | 176 (33.0) | 358 (67.0) |
| +1 | 200 (54.5) | 167 (45.5) |
| +2 | 167 (65.5) | 88 (34.5) |
Figure 7.
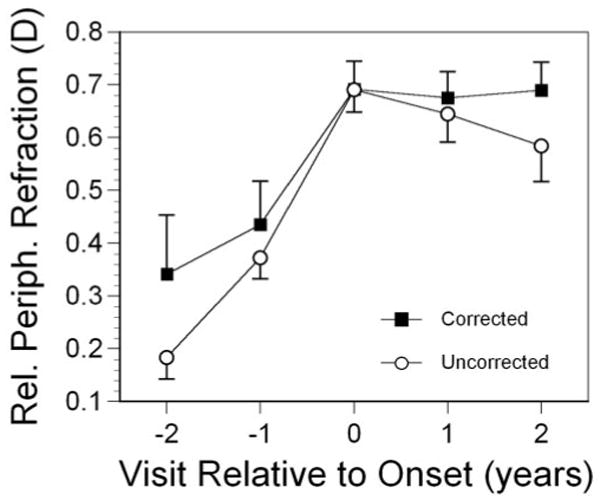
Relative peripheral refractive error as a function of visit and whether became-myopic children wore a refractive correction. Error bars, SEM.
Discussion
Myopic eyes were clearly different from emmetropic eyes before the onset of myopia in terms of refractive error, axial length, relative peripheral refractive error, and growth rates for these variables. Compared with emmetropes, became-myopic children were less hyperopic on average when nonmyopic as long as 4 years before the onset of myopia. This finding is in agreement with previous longitudinal analyses in which early refractive error was used as a predictive factor.6,40 Axial length followed a similar course—namely, longer than in emmetropes, but only as early as −3 years before onset. Peripheral refractive differences were delayed by 1 year, with became-myopic eyes relatively more peripherally hyperopic than emmetropic eyes by −2 years before onset. These results suggest that the window for predicting onset is limited. Under ideal, yet artificial, conditions where the outcome is known, refractive error, axial length, and peripheral refraction as cross-sectional predictors would only be useful between −4 and −2 years before onset. Real-world performance will certainly be worse when age is the only information available instead of visit relative to onset. This small window presents a major challenge to accurate prediction and timely intervention.
In addition to having cross-sectional differences compared with emmetropes −2 to −4 years before onset, eyes of became-myopic children differed in their rate of change between years. One of the striking features of the data was that the fastest interval for change in all three components was during the year before onset of myopia (Figs. 1C, 2C, 3C). The change in refractive error and axial length then slowed the year after onset, although the eye continued to grow and to progress in myopia at an elevated rate compared with emmetropic eyes. The occurrence of the fastest rate in the interval between the year before and the year of onset suggests that there is something special about the onset of myopia beyond reaching a criterion number of diopters. The process of onset does not appear to be a consistent, gradual expansion of the globe and increase in refractive error. There appears to be something of an acceleration over the myopic threshold. This phenomenon has been observed previously.4 Whereas our criterion of −0.75 D in each meridian is more conservative than that used in this previous analysis of components before and after onset of myopia (any minus in each meridian and a spherical equivalent of at least −0.25 D), it is noteworthy that despite this difference in definition, both studies show the fastest rate of change in myopia in the interval between the year before and the year of onset of myopia.4
The choice of criterion level for myopia at onset is somewhat arbitrary. This point may be too late for some children and too soon for others considering 11.5% received a refractive correction 1 year before the 0 visit and 34.5% did not wear a correction even 2 years after. Measurement error is a potential explanation for the faster rate of change before the year 0 visit. The assumption that measurement error is randomly distributed at each visit may not be true between visits −1 and 0. More children may be measured inaccurately as less myopic at visit −1, thereby keeping them from being classified as myopic. These children would then be falsely measured as having a faster rate of progression between visits −1 and 0. This error seems unlikely, however, as this finding of faster change between visits −1 and 0 occurred in independently measured axial length as well as in relative peripheral refraction. Understanding the process underlying this acceleration requires further investigation.
Wearing an optical correction appeared to have no effect on the level of or change in relative peripheral refraction. We have no information on the power of the prescriptions worn by children or the reasons corrections were prescribed. One might reasonably assume that most of the corrections after onset were for myopia rather than for astigmatism, which would be expected to increase the amount of peripheral hyperopia and foveal accommodative lag in children with corrected vision compared with those without correction. Whether this increase was symmetric between periphery and fovea is not known. It may be asked whether correction accelerates myopia progression. Children with corrected vision have shown more lag and more myopia,41 but this result is confounded by the fact that correction is not being randomly applied. More myopic children are more likely to be the ones wearing a correction. Cause and effect of the progression of myopia cannot be distinguished by using these data. The lack of impact of correction on relative peripheral refraction shown in Figure 7 is not expected to be confounded by variation in the strength of refractive corrections needed by children with and those without correction because relative peripheral refraction was largely independent of progression in these early postonset years (with the exception of Hispanics in year +5).
Relative peripheral refractive error displayed a pattern around the time of onset that was similar to refractive error and axial length—namely, more rapid change across visits before onset, with the fastest change occurring at onset. But rather than stabilizing at a moderate rate of change after onset, relative peripheral refractive error showed no change across post-onset visits. This pattern suggests a two-phase process in ocular growth, one leading up to onset and a second after onset, assuming that variation in peripheral refraction is due in large part to variation in local ocular shape.12–17,42 An increasingly prolate shape suggests equatorial restriction, whereas a constant shape suggests an overall, more uniform global expansion.18 The suggestion of two phases for shape change raises the possibility that two mechanisms may be at work. Various mechanisms may be proposed for why ocular shape is prolate or less oblate in myopia. If growth occurs preferentially at the posterior pole, axial expansion will outpace equatorial expansion, to create a relatively more prolate shape. This mechanism would produce a monotonically increasing prolate shape, however. Stability of shape could be achieved by cessation of growth, yet the data clearly show continued axial growth during the time shape was stable after onset. External equatorial restriction from extraocular muscles16 or constraints from orbital size18 have also been mentioned as possible causes of a relatively prolate shape. These external sources of compression most likely would result in a continuously increasing, relatively prolate shape that was not seen after onset, unless some plasticity or adaptation reduced their restrictive force.
Several authors have discussed ocular shape in refractive error as either the source or the consequence of local defocus stimulating eye growth.9,19,20,43 Yet it seems counterintuitive that progress toward myopia should involve an increasingly relatively prolate shape. Local control of eye growth suggests that the eye should maintain a roughly uniform spherical equivalent, as do the most emmetropic eyes.20 Relative peripheral refraction did not even reach an absolute hyperopic state in became-myopic children until visit −1 (Fig. 3A), 2 years after axial length exceeded the average for emmetropes. It could be argued that the increasingly relatively prolate shape before the onset of myopia adds to hyperopic defocus on a relative basis and drives the accelerating axial growth. However, stability in peripheral refraction happens when the eye is at its most hyperopic peripherally. A sudden loss of sensitivity to peripheral defocus would create stability, but seems unlikely. Another possible scenario is that peripheral defocus is less effective in driving eye growth compared with defocus at the posterior pole. This could accentuate posterior growth at the pole leading to an increasingly prolate or less oblate shape. As shape becomes less oblate, peripheral hyperopic defocus would increase until some point where low amounts of central defocus and high central sensitivity are equally effective in driving eye growth as the higher amount of peripheral defocus and low peripheral sensitivity. Spherical expansion may then occur when central and peripheral signals are equally effective.
Although this model of differential peripheral and foveal sensitivity seems plausible, it seems reasonable to assume that once a shape with sufficient peripheral hyperopia to drive eye growth both centrally and peripherally is attained at onset, axial length should continue to elongate at the highest rate. However, axial elongation is most rapid in the year before onset and slower after onset. In addition, the idea that a relatively prolate shape and peripheral hyperopia stimulates axial elongation in the periphery would seem only as valid as the evidence that hyperopic defocus drives central ocular growth. Recent evidence of only small effects from bifocal clinical trials,2,3,44 that accommodative lag is elevated only several years after ocular growth first becomes excessive,41 and that elevated accommodative lag is not always observed before onset of myopia41,45 argues against a major role for the influence of hyperopic defocus on axial growth and refractive error. Alternatively, the amount of lag may mediate the effectiveness of PALs for slowing the progression of myopia. Wearing PALs resulted in a larger treatment effect in children having more than the median amount of lag (by 0.33 D or 21%), although it should also be noted that the amount of lag did not significantly affect the rate of progression in children wearing single-vision lenses.46
Internal sources of restriction may also produce the patterns observed. Connections between the choroid, ciliary body, and crystalline lens are sufficiently strong to transmit deforming forces to the crystalline lens when the ciliary diameter expands. Lens deformation can occur whether the force applied is ordinary, such as during relaxation of accommodation, or when the force is extreme, such as during induced stretching experiments.47 The lens thins and flattens during stretching, because it is the most elastic tissue (i.e., has the lowest modulus of elasticity, of the structures in this chain).47,48 Two phases for equatorial growth, one where uveal tension increases and one when this tension reaches the limit of stretching, may produce two different patterns for change in ocular shape. These two patterns are suggested by van Alphen's experiment,31 which involved inflating globes with exposed choroids with a ring of sclera left in place near the ciliary body. The first phase of inflation is characterized by anteroposterior expansion, a change to a more prolate shape. The suggestion of a second phase occurs as the globe expands further toward a point where the ciliary body becomes what is described as maximumly flat. Expansion of the globe then becomes more spherical in the third panel of van Alphen's Figure 3.31 These phases may be analogous to the increase in relative peripheral hyperopia before onset followed by the more symmetric expansion after onset.
Sampling of relative peripheral refractive error is limited in this study, in that it is only measured at one peripheral point. However, recent evidence shows that both horizontal and vertical dimensions are relatively more prolate, or less oblate, in myopic eyes.11 There is some uncertainty as to whether there is symmetry horizontally and vertically in ocular shape based on MRI data. Although the slope values that have been reported for asphericity as a function of refractive error and plane are numerically different (0.028 horizontal and 0.018 vertical), these slopes were not tested for the significance of the difference between them. Inspection of Figure 4b in Atchison et al.11 shows quite a bit of variation and overlap. Within the range of common refractive errors (−1.00 to −5.00 D), the two lines are nearly superimposed.11 The mean horizontal and vertical asphericities for myopes were not significantly different (overlapping 95% CIs of 0.15–0.21 and 0.17–0.23).11 There is evidence, therefore, that vertical–horizontal asymmetry in shape is either small or not significant. General symmetry offers some justification that measurement of one peripheral point may represent the behavior of other parts of the globe.
Asymmetries in peripheral refraction are more apparent. Horizontal–vertical asymmetries have been reported to be between 0.0 to 1.0 D, with vertical quadrants inconsistently either more myopic or more hyperopic than horizontal quadrants.9,19 Atchison et al.21 report horizontal–vertical asymmetries up to approximately 3.0 D with a more consistent relative vertical myopia. Lower visual field (superior retina) myopia has also been found in adult samples,19,21 although this was not found in a sample of children.9 The limitations of data showing asymmetries are that they are not from children, do not examine incident myopes, and are not longitudinal. Therefore they are not conclusive as to whether the relative changes in each quadrant are symmetric during the development of myopia. The implications of these asymmetries are unclear in either a defocus-based or a restriction-based model. No human investigation has attempted to correlate ocular growth with local defocus. Nasal–temporal asymmetries in ciliary muscle anatomy and lens position are well-known,49 suggesting that restriction-based expansion need not be strictly symmetric. Future studies would be strengthened by longitudinal assessment of multiple quadrants.
Ethnic variation in relative peripheral refraction indicates that neither relative peripheral hyperopia nor an increase in relative peripheral hyperopia are universal features of the myopic eye. African-American became-myopic children in year +3 are nearly as myopic on average as Asian-American became-myopic children in year +1 (Fig. 4), yet the African-American group has no significant average relative peripheral hyperopia and the Asian-American group has the largest amount (Fig. 6). This may indicate ethnic variation in the underlying process that leads to excessive axial elongation or merely variation in degree within the same process.
In summary, the current findings suggest that longer eyes, more negative refractive errors, and increased relative peripheral hyperopia occur 2 to 4 years before the onset of myopia and may therefore be potentially useful as predictors of myopia onset. It is problematic, however, that this window of opportunity is brief. Longitudinal data suggest that faster growth, faster progression, and a more rapid change toward peripheral hyperopia are also predictive of the onset of myopia, but again, only within a narrow window of time. Because time is arranged relative to onset rather than to age, the analysis may be better suited to pointing out potential predictive factors for future analyses and for evaluating what these patterns near the time of onset indicate about the process of becoming myopic rather than for making specific predictions. Even if not optimized for prediction, the current analysis suggests that the process of becoming myopic is not one of gradually accumulating an excessively long axial length. The acceleration in axial growth, myopia progression, and peripheral hyperopia before the onset of myopia followed by no change in relative peripheral refraction after onset suggest a two-stage process that is not consistent with simple external restriction. Differential sensitivity to defocus in the periphery compared with the fovea is plausible, but does not seem consistent with the timing of axial ocular growth. The current findings may be consistent with a process of resistance to stretching by ocular tissues during growth followed by failure to stretch when growth is excessive, but this hypothesis remains speculative at this stage.
Acknowledgments
Supported by National Eye Institute Grants U10-EY08893 and R24-EY014792, the Ohio Lions Eye Research Foundation, and the E. F. Wildermuth Foundation.
Appendix
The CLEERE Study Group (as of March 2007)
Clinical Centers
Franklin Primary Health Center, Inc., Mobile, AL. Sandral Hullett (Principal Investigator, 1997–present), Robert N. Kleinstein (Co-investigator, 1997–present), Janene Sims (Optometrist, 1997–2001 and 2004–present), Raphael Weeks (Optometrist, 1999–present), Sandra Williams (Study Coordinator, 1999–present), LeeAndra Calvin (Study Coordinator, 1997–1999), and Melvin D. Shipp (Co-investigator, 1997–2004). Kleinstein and Sims are affiliated with the University of Alabama at Birmingham School of Optometry.
University of California, Berkeley School of Optometry, Berkeley, CA. Nina E. Friedman (Principal Investigator, 1999–2001), Pamela Qualley (Study Coordinator, 1997–2001), Donald O. Mutti (Principal Investigator, 1996–1999), and Karla Zadnik (Optometrist, 1996–2001).
College of Optometry, University of Houston, Houston, TX. Ruth E. Manny (Principal Investigator, 1997–present), Suzanne M. Wickum (Optometrist, 1999–present), Ailene Kim (Optometrist, 2003–present), Bronwen Mathis (Optometrist, 2002–present), Mamie Batres (Study Coordinator, 2004–present), Sally Henry (Study Coordinator, 1997–1998), Janice M. Wensveen (Optometrist, 1997–2001), Connie J. Crossnoe (Optometrist, 1997–2003), Stephanie L. Tom (Optometrist, 1999–2002), Jennifer A. McLeod (Study Coordinator, 1998–2004), and Julio C. Quiralte (Study Coordinator, 1998–2005).
Southern California College of Optometry, Fullerton, CA. Susan A. Cotter (Principal Investigator, 2004–present; Optometrist, 1997–2004), Julie A. Yu (Principal Investigator, 1997–2004; Optometrist 2005–present), Raymond J. Chu (Optometrist, 2001–present), Carmen N. Barnhardt (Optometrist 2004–present), Jessica Chang (Optometrist, 2005–present), Kristine Huang (Optometrist, 2005–present), Rebecca Bridgeford (Study Coordinator, 2005–present), Connie Chu (Optometrist, 2004–2005), Soonsi Kwon (Optometrist, 1998–2004), Gen Lee (Study Coordinator, 1999–2003), John Lee (Optometrist, 2000–2003), Robert J. Lee (Optometrist, 1997–2001), Raymond Maeda (Optometrist, 1999–2003), Rachael Emerson (Study Coordinator, 1997–1999), and Tracy Leonhardt (Study Coordinator, 2003–2004).
Department of Ophthalmology, University of Arizona, Tucson, AZ. J. Daniel Twelker (Principal Investigator, 2000–present), Dawn Messer (Optometrist, 2000–present), Denise Flores (Study Coordinator, 2000–present), Rita Bhakta (Optometrist, 2000–2005), and Katherine A. Garvey (Optometrist, 2005–present).
Resource Centers and Executive Committee
Chairman's Office, The Ohio State University College of Optometry, Columbus, OH. Karla Zadnik (Chairman, 1997–present) and Jodi M. Malone (Study Coordinator, 1997–present).
Videophakometry Reading Center, The Ohio State University College of Optometry, Columbus, OH. Donald O. Mutti (Director, 1997–present), Huan Sheng (Reader, 2000–2006), Holly Omlor (Reader, 2003–2006), Meliha Rahmani (Reader, 2004–present), Vidhya Subramanian (Reader, 2006–present), Jaclyn Brickman (Reader, 2002–2003), Amy Wang (Reader, 2002–2003), Philip Arner (Reader, 2002–2004), Samuel Taylor (Reader, 2002–2003), Myhanh T. Nguyen (Reader, 1998–2001), and Terry W. Walker (Reader, 1997–2001).
Optometry Coordinating Center, The Ohio State University College of Optometry, Columbus, OH. Lisa A. Jones (Director, 1997–present), Linda Barrett (Data Entry Operator, 1997–present), John Hayes (Biostatistician, 2001–present), G. Lynn Mitchell (Biostatistician, 1998–present), Melvin L. Moeschberger (Consultant, 1997–present), Loraine Sinnott (Biostatistician, 2005–present), Pamela Wessel (Program Coordinator, 2000–present), Julie N. Swartzendruber (Program Coordinator, 1998–2000).
Project Officer, National Eye Institute, Rockville, MD. Donald F. Everett.
Executive Committee. Karla Zadnik (Chairman), Lisa A. Jones, Robert N. Kleinstein, Ruth E. Manny, Donald O. Mutti, J. Daniel Twelker, and Susan A. Cotter.
Footnotes
Disclosure: D.O. Mutti, None; J.R. Hayes, None; G.L. Mitchell, None; L.A. Jones, None; M.L. Moeschberger, None; S.A. Cotter, None; R.N. Kleinstein, None; R.E. Manny, None; J.D. Twelker, None; K. Zadnik, None
References
- 1.van Alphen GWHM. On emmetropia and ametropia. Ophthalmol Suppl. 1961;142:1–92. [PubMed] [Google Scholar]
- 2.Fulk GW, Cyert LA, Parker DE. A randomized trial of the effect of single-vision vs. bifocal lenses on myopia progression in children with esophoria. Optom Vis Sci. 2000;77:395–401. doi: 10.1097/00006324-200008000-00006. [DOI] [PubMed] [Google Scholar]
- 3.Gwiazda J, Hyman L, Hussein M, et al. A randomized clinical trial of progressive addition lenses versus single vision lenses on the progression of myopia in children. Invest Ophthalmol Vis Sci. 2003;44:1492–1500. doi: 10.1167/iovs.02-0816. [DOI] [PubMed] [Google Scholar]
- 4.Goss DA, Jackson TW. Clinical findings before the onset of myopia in youth. I. Ocular optical components. Optom Vis Sci. 1995;72:870–878. doi: 10.1097/00006324-199512000-00005. [DOI] [PubMed] [Google Scholar]
- 5.Zadnik K, Satariano WA, Mutti DO, Sholtz RI, Adams AJ. The effect of parental history of myopia on children's eye size. JAMA. 1994;271:1323–1327. [PubMed] [Google Scholar]
- 6.Zadnik K, Mutti DO, Friedman NE, et al. Ocular predictors of the onset of juvenile myopia. Invest Ophthalmol Vis Sci. 1999;40:1936–1943. [PubMed] [Google Scholar]
- 7.Deller JFP, O'Connor AD, Sorsby A. X-ray measurement of the diameters of the living eye. Proc R Soc Lond B. 1947;134:456–457. doi: 10.1098/rspb.1947.0025. [DOI] [PubMed] [Google Scholar]
- 8.Wang FR, Zhou XD, Zhou SZ. A CT study of the relation between ocular axial biometry and refraction (in Chinese) Chung-Hua Yen Ko Tsa Chih (Chin J Ophthalmol) 1994;30:39–40. [PubMed] [Google Scholar]
- 9.Schmid GF. Variability of retinal steepness at the posterior pole of children. Curr Eye Res. 2003;27:61–68. doi: 10.1076/ceyr.27.2.61.15454. [DOI] [PubMed] [Google Scholar]
- 10.Cheng HM, Singh OS, Kwong KK, et al. Shape of the myopic eye as seen with high-resolution magnetic resonance imaging. Optom Vis Sci. 1992;69:698–701. doi: 10.1097/00006324-199209000-00005. [DOI] [PubMed] [Google Scholar]
- 11.Atchison DA, Pritchard N, Schmid KL, et al. Shape of the retinal surface in emmetropia and myopia. Invest Ophthalmol Vis Sci. 2005;46:2698–2707. doi: 10.1167/iovs.04-1506. [DOI] [PubMed] [Google Scholar]
- 12.Ferree CE, Rand G, Hardy C. Refraction for the peripheral field of vision. Arch Ophthalmol. 1931;5:717–731. [Google Scholar]
- 13.Rempt F, Hoogerheide J, Hoogenboom W. Peripheral retinoscopy and the skiagram. Ophthalmologica. 1971;162:1–10. doi: 10.1159/000306229. [DOI] [PubMed] [Google Scholar]
- 14.Millodot M. Effect of ametropia on peripheral refraction. Am J Optom Physiol Opt. 1981;58:691–695. doi: 10.1097/00006324-198109000-00001. [DOI] [PubMed] [Google Scholar]
- 15.Charman WN, Jennings JAM. Ametropia and peripheral refraction. Am J Optom Physiol Opt. 1982;59:992–993. doi: 10.1097/00006324-198211000-00017. [DOI] [PubMed] [Google Scholar]
- 16.Mutti DO, Sholtz RI, Friedman NE, Zadnik K. Peripheral refraction and ocular shape in children. Invest Ophthalmol Vis Sci. 2000;41:1022–1030. [PubMed] [Google Scholar]
- 17.Logan NS, Gilmartin B, Wildsoet CF, Dunne MCM. Posterior retinal contour in adult human anisomyopia. Invest Ophthalmol Vis Sci. 2004;45:2152–2162. doi: 10.1167/iovs.03-0875. [DOI] [PubMed] [Google Scholar]
- 18.Atchison DA, Jones CE, Schmid KL, et al. Eye shape in emmetropia and myopia. Invest Ophthalmol Vis Sci. 2004;45:3380–3386. doi: 10.1167/iovs.04-0292. [DOI] [PubMed] [Google Scholar]
- 19.Seidemann A, Schaeffel F, Guirao A, Lopez-Gil N, Artal P. Peripheral refractive errors in myopic, emmetropic, and hyperopic young subjects. J Opt Soc Am A. 2002;19:2363–2373. doi: 10.1364/josaa.19.002363. [DOI] [PubMed] [Google Scholar]
- 20.Stone RA, Flitcroft DI. Ocular shape and myopia. Ann Acad Med Singapore. 2004;33:7–15. [PubMed] [Google Scholar]
- 21.Atchison DA, Pritchard N, Schmid KL. Peripheral refraction along the horizontal and vertical visual fields in myopia. Vision Res. 2006;46:1450–1458. doi: 10.1016/j.visres.2005.10.023. [DOI] [PubMed] [Google Scholar]
- 22.Hoogerheide J, Rempt F, Hoogenboom WPH. Acquired myopia in young pilots. Ophthalmologica. 1971;163:209–215. doi: 10.1159/000306646. [DOI] [PubMed] [Google Scholar]
- 23.Schaeffel F, Glasser A, Howland HC. Accommodation, refractive error, and eye growth in chickens. Vision Res. 1988;28:639–657. doi: 10.1016/0042-6989(88)90113-7. [DOI] [PubMed] [Google Scholar]
- 24.Irving EL, Sivak JG, Callender MG. Refractive plasticity of the developing chick eye. Ophthalmic Physiol Opt. 1992;12:448–456. [PubMed] [Google Scholar]
- 25.Wildsoet C, Wallman J. Choroidal and scleral mechanisms of compensation for spectacle lenses in chicks. Vision Res. 1995;35:1175–1194. doi: 10.1016/0042-6989(94)00233-c. [DOI] [PubMed] [Google Scholar]
- 26.Smith EL, 3rd, Hung LF. The role of optical defocus in regulating refractive development in infant monkeys. Vision Res. 1999;39:1415–1435. doi: 10.1016/s0042-6989(98)00229-6. [DOI] [PubMed] [Google Scholar]
- 27.Smith EL, Kee CS, Ramamirtham R, Qiao-Grider Y, Hung LF. Peripheral vision can influence eye growth and refractive development in infant monkeys. Invest Ophthalmol Vis Sci. 2005;46:3965–3972. doi: 10.1167/iovs.05-0445. [DOI] [PMC free article] [PubMed] [Google Scholar]
- 28.Wallman J, Gottlieb MD, Rajaram V, Fugate-Wentzek LA. Local retinal regions control local eye growth and myopia. Science. 1987;237:73–77. doi: 10.1126/science.3603011. [DOI] [PubMed] [Google Scholar]
- 29.Gottlieb MD, Fugate-Wentzek LA, Wallman J. Different visual deprivations produce different ametropias and different eye shapes. Invest Ophthalmol Vis Sci. 1987;28:1225–1235. [PubMed] [Google Scholar]
- 30.Troilo D, Wallman J. The regulation of eye growth and refractive state: an experimental study of emmetropization. Vision Res. 1991;31:1237–1250. doi: 10.1016/0042-6989(91)90048-a. [DOI] [PubMed] [Google Scholar]
- 31.van Alphen GWHM. Choroidal stress and emmetropization. Vision Res. 1986;26:723–734. doi: 10.1016/0042-6989(86)90086-6. [DOI] [PubMed] [Google Scholar]
- 32.Mutti DO, Zadnik K, Fusaro RE, et al. Optical and structural development of the crystalline lens in childhood. Invest Ophthalmol Vis Sci. 1998;39:120–133. [PubMed] [Google Scholar]
- 33.Mutti DO, Mitchell GL, Jones LA, et al. Axial growth and changes in lenticular and corneal power during emmetropization in infants. Invest Ophthalmol Vis Sci. 2005;46:3074–3080. doi: 10.1167/iovs.04-1040. [DOI] [PubMed] [Google Scholar]
- 34.Jones LA, Mitchell GL, Zadnik K The CLEERE Study Group. Agreement between parent-reported and clinician-assessed race in the CLEERE Study. Control Clin Trials. 2001;22:98S. [Google Scholar]
- 35.Seddon JM, Sahagian CR, Glynn RJ, et al. Evaluation of an iris color classification system. Invest Ophthalmol Vis Sci. 1990;31:1592–1598. [PubMed] [Google Scholar]
- 36.Kleinstein RN, Mutti DO, Manny RE, Shin JA, Zadnik K. Cycloplegia in African-American children. Optom Vis Sci. 1999;76:102–107. doi: 10.1097/00006324-199902000-00017. [DOI] [PubMed] [Google Scholar]
- 37.Zadnik K, Mutti DO, Friedman NE, Adams AJ. Initial cross-sectional results from the Orinda Longitudinal Study of Myopia. Optom Vis Sci. 1993;70:750–758. doi: 10.1097/00006324-199309000-00012. [DOI] [PubMed] [Google Scholar]
- 38.Bozdogan H. Model selection and Akaike's Information Criterion (AIC): the general theory and its analytical extensions. Psychometrika. 1987;52:345–370. [Google Scholar]
- 39.Zadnik K, Mutti DO, Mitchell GL, et al. Normal eye growth in emmetropic schoolchildren. Optom Vis Sci. 2004;81:819–828. doi: 10.1097/01.opx.0000145028.53923.67. [DOI] [PubMed] [Google Scholar]
- 40.Hirsch MJ. A longitudinal study of refractive state of children during the first six years of school. Am J Optom Arch Am Acad Optom. 1961;38:564–571. doi: 10.1097/00006324-196110000-00004. [DOI] [PubMed] [Google Scholar]
- 41.Mutti DO, Mitchell GL, Hayes JR, et al. Accommodative lag before and after the onset of myopia. Invest Ophthalmol Vis Sci. 2006;47:837–846. doi: 10.1167/iovs.05-0888. [DOI] [PubMed] [Google Scholar]
- 42.Dunne MCM. A computing scheme for determination of retinal contour from peripheral refraction, keratometry and A-scan ultrasonography. Ophthalmic Physiol Opt. 1995;15:133–143. [PubMed] [Google Scholar]
- 43.Logan NS, Gilmartin B, Dunne MCM. Computation of retinal contour in anisomyopia. Ophthalmic Physiol Opt. 1995;15:363–366. [PubMed] [Google Scholar]
- 44.Edwards MH, Li RW, Lam CS, Lew JK, Yu BS. The Hong Kong progressive lens myopia control study: study design and main findings. Invest Ophthalmol Vis Sci. 2002;43:2852–2858. [PubMed] [Google Scholar]
- 45.Gwiazda J, Thorn F, Held R. Accommodation, accommodative convergence, and response AC/A ratios before and at the onset of myopia in children. Optom Vis Sci. 2005;82:273–278. doi: 10.1097/01.opx.0000159363.07082.7d. [DOI] [PubMed] [Google Scholar]
- 46.Gwiazda JE, Hyman L, Norton TT, et al. Accommodation and related risk factors associated with myopia progression and their interaction with treatment in COMET children. Invest Ophthalmol Vis Sci. 2004;45:2143–2151. doi: 10.1167/iovs.03-1306. [DOI] [PubMed] [Google Scholar]
- 47.van Alphen GWHM, Graebel WP. Elasticity of tissues involved in accommodation. Vision Res. 1991;31:1417–1438. doi: 10.1016/0042-6989(91)90061-9. [DOI] [PubMed] [Google Scholar]
- 48.Friberg TR, Lace JW. A comparison of the elastic properties of human choroid and sclera. Exp Eye Res. 1988;47:429–436. doi: 10.1016/0014-4835(88)90053-x. [DOI] [PubMed] [Google Scholar]
- 49.Hogan MJ, Alvarado JA, Weddell JE. Histology of the Human Eye. Philadelphia: WB Saunders; 1971. pp. 49–50. [Google Scholar]