Abstract
Purpose: To determine effective dose (ED) per unit dose-length product (DLP) conversion factors for computed tomographic (CT) dosimetry.
Materials and Methods: A CT dosimetry spreadsheet was used to compute patient ED values and corresponding DLP values. The ratio of ED to DLP was determined with 16-section CT scanners from four vendors, as well as with five models from one manufacturer that spanned more than 25 years. ED-to-DLP ratios were determined for 2-cm scan lengths along the patient axis, as well as for typical scan lengths encountered at head and body CT examinations. The dependence of the ratio of ED to DLP on x-ray tube voltage (in kilovolts) was investigated, and the values obtained with the spreadsheet were compared with those obtained by using two other commercially available CT dosimetry software packages.
Results: For 2-cm scan lengths, changes in the scan region resulted in differences to ED of a factor of 30, but much lower variation was obtained for typical scan lengths at clinical head and body imaging. Inter- and intramanufacturer differences for ED/DLP were generally small. Representative values of ED/DLP at 120 kV were 2.2 μSv/mGy · cm (head scans), 5.4 μSv/mGy · cm (cervical spine scans), and 18 μSv/mGy · cm (body scans). For head scans, ED/DLP was approximately independent of x-ray tube voltage, but for body scans, the increase from 80 to 140 kV increased the ratio of ED to DLP by approximately 25%. Agreement in ED/DLP data for all three software packages was generally very good, except for cervical spine examinations where one software package determined an ED/DLP ratio that was approximately double that of the other two.
Conclusion: This article describes a method of providing CT users with a practical and reliable estimate of adult patient EDs by using the DLP displayed on the CT console at the end of any given examination.
© RSNA, 2008
Current computed tomographic (CT) scanners generate patient dose indexes of the volume CT dose index (CTDIvol) and the dose-length product (DLP) that are measured in 16- and 32-cm-diameter acrylic phantoms (1,2). CTDIvol is an index that quantifies the relative intensity of the radiation that is incident on the patient (3). CT scanners that have patient size–specific scanning protocols would likely select lower CTDIvol values for pediatric patients but higher ones for oversized patients. The total amount of radiation delivered to the patient at a given examination, however, is also dependent on the CT scan length. The product of CTDIvol and scan length is the DLP, which can be used to quantify the total amount of radiation patients receive during a given scan (4). The DLP is directly related to the patient (stochastic) risk and may be used to set reference values for a given type of CT examination to help ensure patient doses at CT are as low as reasonably achievable (5).
DLP data, however, are not commensurate with dose metrics used with other imaging modalities, such as radiography and fluoroscopy (6). At radiography, the (free in air) entrance skin air kerma (ESK) may be used to characterize the amount of radiation incident on the patient. At fluoroscopic examinations, the kerma-area product (KAP) is used because of the motion of the imaging system during many of these procedures. One convenient way to compare patient doses for different imaging modalities is to utilize the effective dose (ED). Published values of ED/ESK and ED/KAP for use in radiography and fluoroscopy, respectively, make it relatively straightforward to convert measured values of ESK and KAP into ED (7). For CT, however, the scientific literature contains only limited data regarding ED/DLP conversion factors, and many of the factors that could affect the ratio of ED to DLP have not been investigated, to our knowledge (5,8–10). The purpose of this study was to determine ED/DLP conversion factors for CT dosimetry.
MATERIALS AND METHODS
CT Dosimetry Software
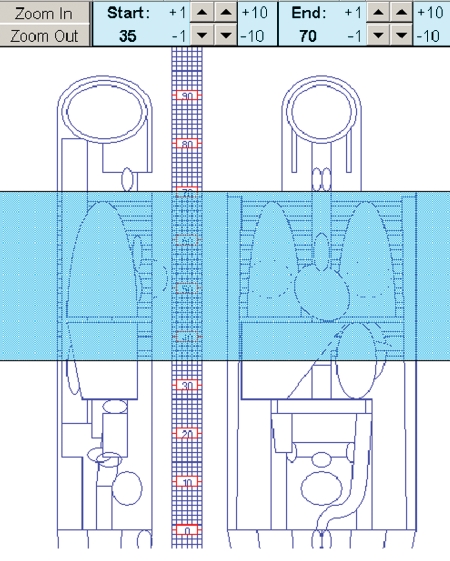
Commercially available CT dosimetry software was used to compute patient ED and DLP. A CT dosimetry spreadsheet (ImPACT CT Patient Dosimetry Calculator, version 0.99x; ImPACT, London, England) was used for all examinations reported in this study (11). This spreadsheet calculates patient organ dose and ED from CT examinations and makes use of the National Radiological Protection Board Monte Carlo published dose data sets (12,13). The Monte Carlo dose data provide normalized organ dose data for irradiation of the mathematical phantom depicted in Figure 1 with a range of CT scanners, which are all normalized to isocenter air dose in the absence of any phantom. Although the ImPACT software allows male and female patients to be specified, this only affects the resultant ED because of differences in gonad doses. Values of ED/DLP obtained with the ImPACT software were compared with corresponding ED/DLP data obtained with two other software packages:
Figure 1:
Mathematical phantom used with ImPACT software to compute patient doses at CT. Superimposed on the phantom is the extent of a chest CT examination, with z ranging from 35 to 70 as indicated on the vertical scale. (Reprinted, with permission, from references 11 and 13.)
1. CT-Expo (version 1.5; Medizinische Hochschule, Hannover, Germany) permits the computation of age- and sex-specific dose values. Dosimetry data, based on Monte Carlo methods, were generated for an adult male (ADAM; 170-cm height and 70-kg weight) and for an adult female (EVA; 160-cm height and 60-kg weight). The accuracy of this program has been experimentally evaluated and shown to provide reasonable patient EDs for normal-sized adults scanned at 120 kV (14,15).
2. ImpactDose (version 1.1; VAMP, Erlangen, Germany) is a personal computer–based program that calculates organ dose and ED values for arbitrary scanning parameters and anatomic ranges. Dosimetry values for primary radiation were derived from measurements or manufacturer specifications, whereas values for scattered radiation were derived from Monte Carlo calculations tabulated for standard anthropomorphic phantoms.
The program permits the determination of sex-specific organ doses and the corresponding EDs but uses only a relatively small number (ie, eight) of scanners, all from a single manufacturer (Siemens, Healthcare Sector, Erlangen, Germany) (16).
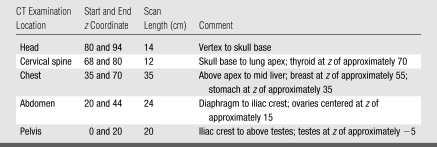
Table 1 defines the scan lengths (z-axis locations) for two head CT and three body CT examinations with the ImPACT software dosimetry package. We used similar locations for CT-Expo and ImpactDose and identical scan lengths for the CT examinations that were investigated.
Table 1.
Anatomic Extent at Standard Head and Body CT Examinations
Note.—z Value relates to patient long axis.
CT Dose Calculation
ED calculations were performed by using an x-ray tube current of 100 mA, scanning time of 1 second (ie, 100 mAs), and contiguous axial scanning (or a pitch of 1). Computations were performed by using the widest available x-ray beam width (eg, 16 detector rows and 1.25-mm section thickness [16 × 1.25 mm] with the Sensation 16 [Siemens, Healthcare Sector]) and by using the maximum available number of detector channels (eg, 16 × 2 mm with the Aquilion 16 [Toshiba America Medical Systems, Tustin, Calif]). All ED values were expressed in milligrays per 100 mAs and were generated by using two significant figures.
Each software package provides values of CT dose index. These include weighted CT dose index, CTDIvol, and the corresponding value of DLP (DLP = CTDIvol × scan length). The head filter was used at head and cervical spine examinations, and the CT dose index data pertained to measurements in a 16-cm-diameter cylindric acrylic phantom. The body filter was used at chest, abdominal, and pelvic examinations, and CT dose index data pertained to measurements in a 32-cm-diameter cylindric acrylic phantom.
Values of ED and DLP obtained for the same technique factors were divided to generate a ratio of ED to DLP for a specified type of examination. Unless otherwise specified, ED/DLP data for the ImPACT software were averaged across male and female patients. In this study, we investigated (a) 16-section CT scanners from four major vendors (LightSpeed 16 [GE Medical Systems, Milwaukee, Wis], Sensation 16 [Siemens, Healthcare Sector], Brilliance 16 [Philips Healthcare, Andover, Mass], and Aquilion 16 [Toshiba America Medical Systems]) for nominal 2-cm scan lengths performed at z values from −10 to 94, as well as for the scans defined in Table 1; (b) five models from one manufacturer that spanned more than 25 years, which ranged from an early version of a single-section scanner to a state-of-the-art 64-section CT scanner (8800, 9800, CT/I, LightSpeed 16, and VCT; GE Medical Systems); and (c) the x-ray tube voltage (in kilovolts).
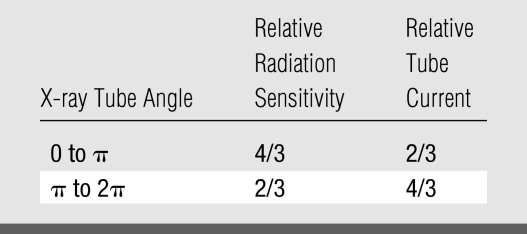
The use of tube current modulation was expected to reduce ED/DLP conversion coefficients in body imaging, because both anteroposterior and posteroanterior projections, which are associated with higher patient doses per unit of tube current, will have lower x-ray tube current values than lateral projections. The effect of tube current modulation on ED/DLP was quantified by considering the example shown in Table 2. Assumptions made in Table 2 were that the achievable tube modulation will result in favorable differences of a factor of two in tube current, as well as a factor of two in the relative radiation sensitivity, as a function of x-ray tube angle.
Table 2.
Theoretical Assessment of Reduction in ED/DLP Conversion Factor Arising from Tube Current Modulation as X-ray Tube Rotates around Patient
RESULTS
Patient Anatomy and ED/DLP
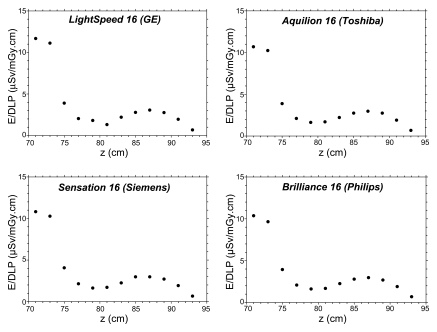
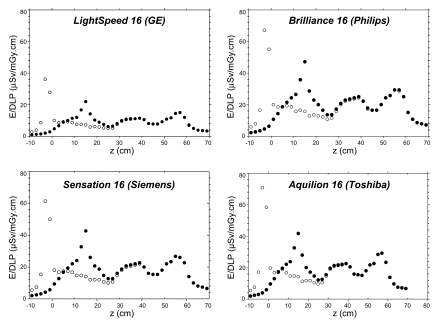
Figure 2 shows values of ED/DLP versus long-axis location (z value) for head CT examinations with four 16-section scanners for a 2-cm scan length centered about the indicated long-axis location (z value), as defined in Figure 1. For head scans, the gonads received negligible radiation exposure, and the ED/DLP values for male and female patients were the same. The ED/DLP value in the brain region, defined by a z range of 80 to 94, was much lower than that in the neck region because the latter contains the relatively radiosensitive thyroid. Figure 3 shows the values of ED/DLP versus long-axis location (z value) for body CT examinations. The differences between the ED/DLP values for male and female patients were entirely because of the doses received by the gonads. The observed peaks in the graphs shown in Figure 3 were because of the presence of radiosensitive organs: breast at z of approximately 55 cm, stomach at z of approximately 35 cm, ovaries at z of approximately 15 cm, and testes at z of approximately −5 cm.
Figure 2:
Graphs of ED/DLP values as a function of z-axis location for head scans (2-cm scan length) obtained with ImPACT software for four commercial 16-section CT scanners. (Male and female ED/DLP values were identical.)
Figure 3:
Graphs of ED/DLP values as a function of z-axis location for body scans (2-cm scan length) obtained with ImPACT software for four commercial 16-section CT scanners. Differences between male ED/DLP (open circles) and female ED/DLP (closed circles) values arise because of differences in dose to the testes and ovaries (see Table 1).
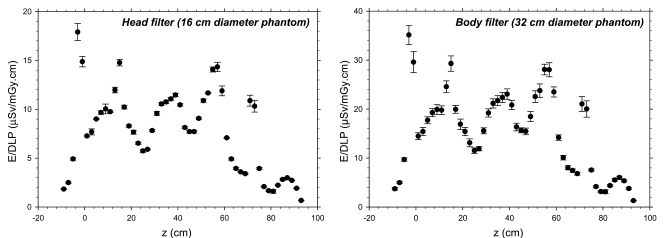
Figure 4 shows average values (± standard deviations) of ED/DLP values versus long-axis location (z value) for 16-section scanners depicted in Figures 2 and 3. Data for the head filter ranged from 0.6 (z = 93) to 17.9 μSv/mGy · cm (z = −3), which differed by about a factor of 30. Similar differences were also observed with the body filter, for which data ranged from 1.3 (z = 93) to 35.1 μSv/mGy · cm (z = −3). Different absolute ED/DLP values are obtained by using head and body filters because body filters have CTDIvol data computed in body phantoms, which are approximately half the CTDIvol doses obtained in the head phantoms used when the head filter is selected. Accordingly, Figure 4 shows that ED/DLP data obtained by using a head filter with DLP data obtained in a 16-cm-diameter phantom were about half those obtained by using a body filter with DLP data obtained in a 32-cm-diameter phantom.
Figure 4:
Graphs of ED/DLP values as a function of z-axis location averaged across four commercial 16-section scanners. Left: Data obtained with head filter and 16-cm-diameter acrylic dosimetry phantom. Right: Data obtained with body filter and 32-cm-diameter acrylic dosimetry phantom. Table 1 lists the locations of radiosensitive organs, which explains the observed peaks. Error bars = standard deviation.
Table 3 shows vendor-specific values of ED/DLP with 16-section CT scanners for standard head and body CT examinations as defined by the scanning characteristics in Table 1. Intermanufacturer differences for ED/DLP for standard scans were very small. Representative values of ED/DLP at 120 kV were 2.2 μSv/mGy · cm for head scans, 5.4 μSv/mGy · cm for cervical spine scans, and 18 μSv/mGy · cm for body scans. Table 4 shows ED/DLP values for standard head and body examinations for five models from one specific vendor (GE Medical Systems). These data show that intravendor variations in ED/DLP coefficient are also very small and comparable to the intervendor variations summarized in Table 3.
Table 3.
ED/DLP Ratios for Standard Head and Body CT Examinations with Four Commercial 16-Section CT Scanners at 120 kV
Note.—Data are microsieverts per milligray-centimeters.
Head filter was used.
Body filter was used.
Table 4.
ED/DLP Values for Standard Head and Body CT Examinations at 120 kV with Different Scanners from One Vendor That Span More than 25 Years
Note.—Data are microsieverts per milligray-centimeters. The vendor was GE Medical Systems.
Head filter (16-cm-diameter acrylic dosimetry phantom).
Body filter (32-cm-diameter acrylic dosimetry phantom).
X-ray Tube Voltage and ED/DLP
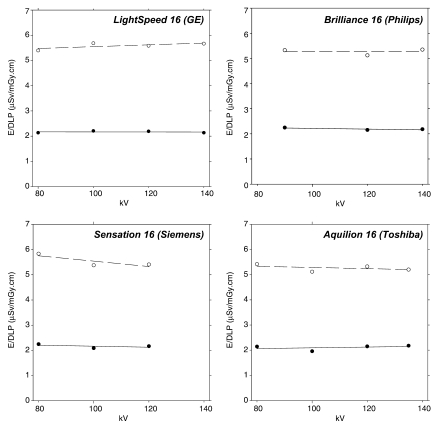
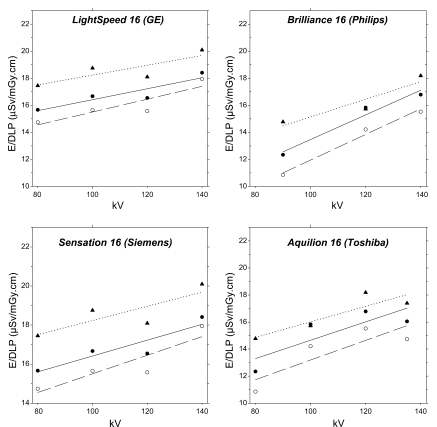
Figure 5 shows ED/DLP for standard head CT examinations as a function of x-ray tube voltage for each of the four vendors (16-section CT scanners). These data showed very little variation in ED/DLP with regard to x-ray tube voltage, and there were no visible trends that were consistent across all four vendors. Figure 6 shows how the corresponding ED/DLP values varied with x-ray tube voltage for body CT examinations. Increasing kilovoltage generally increased the ED/DLP value for all four vendors. Averaging from the 12 fitted straight-line curves in Figure 6 showed that increasing the x-ray tube voltage from 80 to 140 kV resulted in an average increase of the ED/DLP parameter of 4.2% ± 2.1 for each increase in x-ray tube voltage of 10 kV. Increasing the x-ray tube voltage from 80 to 140 kV increased the average ED/DLP coefficient for body scans by approximately 25%.
Figure 5:
Graphs of ED/DLP values as a function of x-ray tube voltage obtained with ImPACT software for four commercial 16-section CT scanners (head filter and 16-cm-diameter acrylic dosimetry phantom). Solid circles (solid lines) are head scans, and open circles (dashed lines) are cervical spine scans, with these scans defined in Table 1. Lines are least-square fits to a second-order polynomial.
Figure 6:
Graphs of ED/DLP values as a function of x-ray tube voltage obtained with ImPACT software for four commercial 16-section CT scanners (body filter and 32-cm-diameter acrylic dosimetry phantom). Solid circles (solid line) are chest scans, open circles (dashed lines) are abdominal scans, and triangles (dotted lines) are pelvic scans, with these scans defined in Table 1. Each line is obtained from a least-square fit.
Dosimetry Software and ED/DLP
Table 5 shows a comparison of ED/DLP values for standard head and body examinations obtained by using three CT dosimetry software packages. With the exception of the cervical spine examination values, typical differences between the ED/DLP values according to each software package and the overall average of all three for ED/DLP values were approximately 5% for head, chest, abdominal, and pelvic CT examinations. The ImpactDose coefficient for cervical spine examinations (11.9 μSv/mGy · cm), however, was more than twice the value obtained by using either ImPACT or CT-Expo (5.4 μSv/mG · cm).
Table 5.
ED/DLP Values Generated for CT Scanner with Three CT Dosimetry Software Packages
Note.—Data are microsieverts per milligray-centimeters. All scans were performed at 120 kV in a male patient by using the scans defined in Table 1. The scanner model was Sensation 16 (Siemens).
Tube Current Modulation and ED/DLP
In the example shown in Table 2, use of tube current modulation would reduce the ED by 11% (ie, 2 for no modulation vs 16/9 with modulation). The assumptions regarding tube current given in Table 2 are clearly more favorable than currently achievable in clinical practice (7,17); accordingly, reductions in ED/DLP conversion coefficient by using current methods of tube current modulation with x-ray tube rotation around the patient will be less than 11%.
DISCUSSION
In comparison to conventional radiography, CT is a high-dose imaging modality, although doses are generally well below the threshold dose for the induction of deterministic effects (18,19). As a result, the risk from CT radiation is that of carcinogenesis and the induction of genetic effects, which is best quantified by the ED (20,21). The recent advent of multidetector CT has resulted in an increasing utilization of this imaging modality, with an estimated 57 million CT examinations performed in the United States in 2000 (22). CT imaging is now the dominant contributor to the population dose from medical x-rays, where the latter is the major source of radiation exposure from man-made sources. Results of one study (23) estimated that although CT accounted for only 10% of diagnostic examinations in US hospitals in 2000, this imaging modality accounted for nearly 70% of the corresponding medical dose.
Computed ED/DLP coefficients may be used to convert values of DLP, as currently provided on most clinical CT scanners, into a corresponding patient ED. A major benefit of generating the ED associated with a CT examination is the ability to directly compare patient doses (ie, risks) at CT with those at other diagnostic procedures that involve ionizing radiation. The ED of a CT scan can be directly compared with corresponding ED values of radiography and fluoroscopy, as well as nuclear medicine (24,25). A chest CT examination, for example, has an ED between 5 and 10 mSv, whereas a standard two-view chest radiographic examination has an ED of approximately 0.05 mSv (25).
Data for the head and cervical spine examinations were not commensurate with those for chest, abdominal, and pelvic examinations. The former have very low ED values, as well as higher CTDIvol because these are obtained in head phantoms (16 cm in diameter). Body EDs are generally five times higher than head EDs, but the CTDIvol values in 32-cm-diameter acrylic cylinders are only about half of those obtained in 16-cm-diameter cylinders. These two factors explain why body ED/DLP coefficients are numerically nearly an order of magnitude higher than ED/DLP values for head CT scans.
Our study results show that a short (2-cm) scan length will result in markedly different values of patient ED, depending on the z-axis position of the x-ray beam. For narrow scans on the order of 2 cm, differences in anatomic location alone can result in differences in ED of up to a factor of 30. These variations in patient ED are directly related to the locations of radiosensitive organs and tissues, which are predominantly located in the body. In practice, however, few clinical scans have such narrow scan lengths.
We found that ED/DLP values were common across similar-generation scanners from different vendors. Similar findings were obtained for scanners that spanned 25 years from one manufacturer. Any differences in ED/DLP value for any scanner operated at a similar x-ray tube voltage are unlikely to be of any practical importance for most patient dosimetry purposes. The likely reason for this finding is that differences in scanner design such as geometry, filtration, and beam-shaping filter, which affect the x-ray tube output, will have similar effects on both ED and CTDIvol.
The choice of x-ray tube voltage did not affect ED/DLP ratios for head CT examinations but was an important factor for body CT. The reason for this difference is that the head does not contain any substantially radiosensitive organs, whereas the body region does (eg, lung, colon, stomach, red bone marrow). Increasing the x-ray tube voltage also increases the x-ray beam penetration and increases the relative doses to the organs that make the largest contribution to the patient ED. Our data show that when body CT scans are performed at values that differ from the standard 120 kV, a correction needs to be made to account for the selected x-ray tube voltage. Reducing the x-ray tube voltage from 120 to 80 kV, for example, would require the use of an ED/DLP ratio of 15 μSv/mGy · cm, or 17% lower than the value used at 120 kV (ie, 18 μSv/mGy · cm).
The consistency achieved by using the three different software packages in generating ED/DLP values was generally very good. This important finding provides confidence in the derived ED/DLP data and suggests that these conversion coefficients are sufficiently robust for use in clinical practice. The one exception to this general conclusion was for cervical spine examinations, where one software package (ImpactDose) gave an ED/DLP value that was more than twice of those generated with the other two software packages (ImPACT and CT-Expo). This discrepancy is most likely related to the dose received by the thyroid gland in cervical spine examinations, because this organ alone contributes nearly 80% to the resultant patient ED for this type of examination.
Variations in the pitch ratio are likely to affect ED and DLP in a similar manner, provided that the CT scan covers a relatively large region. For example, when scan length and technique factors are kept constant at a chest CT scan, doubling the pitch will likely halve the average dose to each irradiated organ, and the ED will be reduced by 50%; doubling the pitch also reduces CTDIvol and the corresponding DLP by half, and ED/DLP factors are therefore unlikely to vary markedly with pitch ratio. Pitch could be important for short scan lengths, however, because the absorbed dose could depend on the location of the x-ray tube relative to the location of any small (radiosensitive) organs.
All patient and phantom doses were obtained by using software and were not independently verified with any radiation dose measurements. All three software packages use idealized mathematical anthropomorphic phantoms, which will differ from any real patient (26). Accordingly, the EDs generated in this work relate to a nominal (reference) patient, with specific sizes and locations of each organ and tissue. Of greater importance is that EDs are only valid for a reference-sized individual who weighs approximately 70 kg. When scanning pediatric patients or adult patients whose size differs from 70 kg, it will be important to use appropriate correction factors if reliable patient EDs are to be obtained (27–29) or to make use of ED/DLP conversion factors that explicitly take into account the size of the patient who is being scanned (5).
This article describes a method of providing CT users with a practical and reliable estimate of adult patient EDs by using the DLP displayed on the CT console at the end of any given examination. Knowledge of patient EDs will allow all stakeholders in CT, including patients, to better understand the amount of radiation a patient receives in a given diagnostic test and will be a valuable tool for minimizing patient doses from this imaging modality (4,22). ED from CT could be compared with a range of benchmark EDs, including natural background radiation (cosmic, terrestrial, and internal) of 1 mSv per year and the average radon exposure in the United States of 2 mSv per year (30). Diagnostic tests may also be compared with regulatory dose limits for occupational exposure (50 mSv per year), as well as for members of the public (1 mSv per year). Converting EDs to radiation risk and detriment estimates would also be possible but must be performed with care (31–33).
ADVANCES IN KNOWLEDGE
Effective dose (ED) to dose-length product (DLP) conversion factors are provided to permit DLP values to be converted into a corresponding value of the adult patient ED.
ED/DLP conversion factors are provided along the long patient axis, as well as for standard head, neck, and body scans (chest, abdomen, and pelvis).
ED/DLP conversion factors show little inter- or intravendor variation.
ED/DLP conversion factors are independent of x-ray tube voltage at head CT but vary with increasing x-ray tube voltage at body CT.
Similar ED/DLP conversion factors were obtained by using all current CT dosimetry software packages.
IMPLICATIONS FOR PATIENT CARE
The data permit operators to convert the DLP value generated by most commercial CT scanners into a corresponding ED, assuming a normal-sized adult patient.
The data also permit operators to compare patient EDs of CT with those of other x-ray based imaging examinations, as well as with benchmark values, including natural background radiation and regulatory dose limits.
Acknowledgments
We thank Paul C. Shrimpton, PhD, Health Protection Agency, United Kingdom, and Sue Edyvean, MSc, ImPACT, United Kingdom, for the use of Figure 1.
Abbreviations
CTDIvol = volume CT dose index
DLP = dose-length product
ED = effective dose
Authors stated no financial relationship to disclose.
Author contributions: Guarantors of integrity of entire study, W.H., K.M.O.; study concepts/study design or data acquisition or data analysis/interpretation, all authors; manuscript drafting or manuscript revision for important intellectual content, all authors; manuscript final version approval, all authors; literature research, W.H., K.M.O.; experimental studies, all authors; statistical analysis, K.M.O., M.R.K.; and manuscript editing, all authors
Funding: This research was supported by the National Institutes of Health (grant R01 EB000460).
References
- 1.Galanski M, Hidajat N, Maier W, Nagel HD, Schmidt T. Radiation exposure in computed tomography. 4th ed. Hamburg, Germany: CTB Publications, 2000.
- 2.McNitt-Gray MF. AAPM/RSNA physics tutorial for residents: topics in CT—radiation dose in CT. RadioGraphics 2002;22:1541–1553. [DOI] [PubMed] [Google Scholar]
- 3.International Electrotechnical Commission. International standard of IEC 60601-2-44 Ed2 Amendment 1: medical electrical equipment, Part 2-44—particular requirements for the safety of x-ray equipment for computed tomography. Geneva, Switzerland: International Electrotechnical Commission, 2003.
- 4.Task Group on Control of Radiation Dose in Computed Tomography. Managing patient dose in computed tomography: a report of the International Commission on Radiological Protection. Ann ICRP 2000;30:7–45. [DOI] [PubMed]
- 5.Shrimpton PC, Hillier MC, Lewis MA, Dunn M. National survey of doses from CT in the UK: 2003. Br J Radiol 2006;79:968–980. [DOI] [PubMed] [Google Scholar]
- 6.Bushberg JT, Seibert JA, Leidholdt EM Jr, Boone JM. Essential physics of medical imaging. 2nd ed. Philadelphia, Pa: Lippincott Williams & Wilkins, 2001.
- 7.Hart D, Jones DG, Wall BF. Estimation of effective dose in diagnostic radiology from entrance surface dose and dose-area product measurements. NRPB Report R262. Didcot, Oxfordshire, England: National Radiological Protection Board, 1994.
- 8.Bongartz G, Golding SJ, Jurik GA, et al. European guidelines on quality criteria for computed tomography. Brussels, Belgium: European Commission, 1999.
- 9.Jessen KA, Shrimpton PC, Geleijns J, Panzer W, Tosi G. Dosimetry for optimisation of patient protection in computed tomography. Appl Radiat Isot 1999;50:165–172. [DOI] [PubMed] [Google Scholar]
- 10.Huda W, McCollough CH. CT of the heart: radiation dose considerations. In: Schoepf UJ, ed. CT of the heart: principles and applications. 2nd ed. Totowa, NJ: Humana (in press).
- 11.ImPACT Web site. http://www.impactscan.org/ctdosimetry.htm. Accessed April 1, 2008.
- 12.Shrimpton PC, Jones DG, Hillier MC, Wall BF, Le Heron JC, Faulkner K. Survey of CT practice in the UK. Part 2: dosimetric aspects. NRPB Report R249. Didcot, Oxfordshire, England: National Radiological Protection Board, 1991.
- 13.Jones DG, Shrimpton PC. Normalised organ doses for x-ray computed tomography calculated using Monte Carlo techniques. NRPB Report SR250. Didcot, Oxfordshire, England: National Radiological Protection Board, 1993.
- 14.Stamm G, Nagel HD. CT-expo: a novel program for dose evaluation in CT [in German]. Rofo 2002;174:1570–1576. [DOI] [PubMed] [Google Scholar]
- 15.Brix G, Lechel U, Veit R, et al. Assessment of a theoretical formalism for dose estimation in CT: an anthropomorphic phantom study. Eur Radiol 2004;14:1275–1284. [DOI] [PubMed] [Google Scholar]
- 16.Kalender WA, Schmidt B, Zankl M, Schmidt M. A PC program for estimating organ dose and effective dose values in computed tomography. Eur Radiol 1999;9:555–562. [DOI] [PubMed] [Google Scholar]
- 17.Iball GR. Brettle DS. Moore AC. Assessment of tube current modulation in pelvic CT. Br J Radiol 2006;79:62–70. [DOI] [PubMed] [Google Scholar]
- 18.1990 recommendations of the International Commission on Radiological Protection. Ann ICRP 1991;21:1–201. [PubMed]
- 19.Wagner LK, Eifel PJ, Geise RA. Potential biological effects following high X-ray dose interventional procedures. J Vasc Interv Radiol 1994;5:71–84. [DOI] [PubMed] [Google Scholar]
- 20.Huda W. Radiation dosimetry in diagnostic radiology. AJR Am J Roentgenol 1997;169:1487–1488. [DOI] [PubMed] [Google Scholar]
- 21.McCollough CH, Schueler BA. Calculation of effective dose. Med Phys 2000;27:828–837. [DOI] [PubMed] [Google Scholar]
- 22.Linton OW, Mettler FA Jr; National Council on Radiation Protection and Measurements. National conference on dose reduction in CT, with an emphasis on pediatric patients. AJR Am J Roentgenol 2003;181:321–329. [DOI] [PubMed] [Google Scholar]
- 23.Mettler FA, Wiest PW, Locken JA, Kelsey CA. CT scanning: patterns of use and dose. J Radiol Prot 2000;20:353–359. [DOI] [PubMed] [Google Scholar]
- 24.National Council on Radiation Protection and Measurements. Exposure of the U.S. population from diagnostic medical radiation. Report 100. Bethesda, Md: National Council on Radiation Protection and Measurements, 1989.
- 25.United Nations Scientific Committee on the Effects of Atomic Radiation. UNSCEAR 2000: sources and effects of ionizing radiation. New York, NY: United Nations Scientific Committee on the Effects of Atomic Radiation, 2000.
- 26.Kramer R, Khoury HJ, Vieira JW, et al. All about FAX: a female adult voxel phantom for Monte Carlo calculation in radiation protection dosimetry. Phys Med Biol 2004;49:5203–5216. [DOI] [PubMed] [Google Scholar]
- 27.Huda W, Atherton JV, Ware DE, Cumming WA. An approach for the estimation of effective radiation dose at CT in pediatric patients. Radiology 1997;203:417–422. [DOI] [PubMed] [Google Scholar]
- 28.Nickoloff EL, Dutta AK, Lu ZF. Influence of phantom diameter, kVp and scan mode upon computed tomography dose index. Med Phys 2003;30:395–402. [DOI] [PubMed] [Google Scholar]
- 29.Theocharopoulos N, Damilakis J, Perisinakis K, Tzedakis A, Karantanas A, Gourtsoyiannis N. Estimation of effective doses to adult and pediatric patients from multislice computed tomography: a method based on energy imparted. Med Phys 2006;33:3846–3856. [DOI] [PubMed] [Google Scholar]
- 30.National Council on Radiation Protection and Measurements. Ionizing radiation exposure of the population of the United States. Report 93. Bethesda, Md: National Council on Radiation Protection and Measurements, 1987.
- 31.Brenner DJ, Doll R, Goodhead DT, et al. Cancer risks attributable to low doses of ionizing radiation: assessing what we really know. Proc Natl Acad Sci U S A 2003;100:13761–13766. [DOI] [PMC free article] [PubMed] [Google Scholar]
- 32.Committee on the Biological Effects of Ionizing Radiation. Biological effects of ionizing radiation (BEIR) report VII: health risks from exposure to low levels of ionizing radiation. Washington, DC: National Academies Press, 2005.
- 33.Einstein AJ, Henzlova MJ, Rajagopalan S. Estimating risk of cancer associated with radiation exposure from 64-slice computed tomography coronary angiography. JAMA 2007;298:317–323. [DOI] [PubMed] [Google Scholar]


