Abstract
Purpose: To investigate if opposed-phase T1-weighted and fat-suppressed T2-weighted liver signal intensity (SI) loss and visceral fat measurement at magnetic resonance (MR) imaging and body mass index (BMI) are correlated with grade of liver steatosis in patients with nonalcoholic fatty liver disease (NAFLD) or hepatitis C virus (HCV) and human immunodeficiency virus (HIV)–related liver disease.
Materials and Methods: Committee on Human Research approval and patient consent were obtained for this HIPAA-compliant study. Fifty-two patients (15 men, 37 women) with NAFLD (n = 29) or HCV and HIV–related liver disease (n = 23) underwent prospective contemporaneous MR imaging and liver biopsy. Liver SI loss was measured on opposed-phase T1-weighted and fat-suppressed T2-weighted MR images. Visceral fat area was measured at three levels on water-suppressed T1-weighted MR images (n = 44). Spearman rank correlation coefficients and recursive partitioning were used to examine correlations.
Results: Histopathologic liver steatosis correlated well with liver SI loss on opposed-phase T1-weighted MR images (ρ = 0.78), fat-suppressed T2-weighted MR images (ρ = 0.75), and average visceral fat area (ρ = 0.77) (all P < .01) but poorly with BMI (ρ = 0.53, P < .01). Liver SI losses on opposed-phase T1-weighted MR imaging of less than 3%, at least 3% but less than 35%, at least 35% but less than 49%, and at least 49% corresponded to histopathologic steatosis grades of 0 (n = 16 of 17), 1 (n = 11 of 16), 2 (n = 7 of 13), and 3 (n = 5 of 6), respectively. A visceral fat area of greater than or equal to 73.8 cm2 was associated with the presence of histopathologic steatosis in 41 of 44 patients.
Conclusion: Liver SI loss on opposed-phase T1-weighted MR images and visceral fat area may be used as biomarkers for the presence of liver steatosis and appear to be superior to BMI.
© RSNA, 2008
Nonalcoholic fatty liver disease (NAFLD) and hepatitis C virus (HCV) infection are the two most common causes of chronic liver disease in North America (1). The prevalence of NAFLD is approximately 20% in the United States, and the most important associated risk factors are obesity, type II diabetes, and hyperlipidemia (1). Steatosis is a characteristic feature of NAFLD and may be the only manifestation of early disease; however, more severe forms of the disease exhibit varying degrees of steatosis, inflammation and fibrosis, including cirrhosis (2,3). HCV-related liver disease affects approximately 2% of the general population in the United States, and 50% of these patients have liver steatosis, particularly those with genotype 1, which predominates in the United States (4). The concomitant presence of HCV infection and NAFLD has several important clinical consequences, including a predisposition to more aggressive liver fibrosis, decreased response rate to antiviral therapy, and an increased risk of hepatocellular carcinoma (4).
The recognition of steatosis as a potential indicator of disease severity and treatment response has resulted in a growing interest in the ability to directly or indirectly determine liver steatosis. Liver steatosis is linked to obesity because, in obese subjects, visceral fat functions as an endocrine organ by producing inflammatory mediators that interfere with hepatic glucose metabolism and cause insulin resistance and liver steatosis (1,5,6). Some studies (7–10) have investigated the ability of magnetic resonance (MR) imaging to help detect liver steatosis in patients with diffuse liver disease. Clinically calculated body mass index (BMI) (patient's body weight divided by the square of his or her height) has often been used as a surrogate anthropometric marker of obesity-related morbidity, even though this measurement does not account for body tissue composition or distribution of body fat. The use of imaging to estimate visceral fat may be more appropriate for assessing the risk of obesity-related diseases such as liver steatosis (1,5,6). However, we are unaware of any large studies comparing the relative utility of MR imaging–derived biomarkers of hepatic steatosis (either direct evaluation of liver signal intensity [SI] loss on opposed-phase T1-weighted or fat-suppressed T2-weighted MR imaging sequences or indirect markers such as visceral fat measurement) and BMI in patients with diffuse liver disease. Therefore, we undertook this study to determine if opposed-phase T1-weighted and fat-suppressed T2-weighted liver SI loss and visceral fat measurement at MR imaging are correlated with the histopathologic grade for liver steatosis in patients with NAFLD or with liver disease related to coinfection with HCV and human immunodeficiency virus (HIV).
MATERIALS AND METHODS
Patients
Patients were recruited from December 2003 through March 2007 as part of two ongoing prospective trials. Approval was obtained from the Committee on Human Research, and the study was in compliance with the Health Insurance Portability and Accountability Act. Informed consent was obtained from all patients specifically for the purpose of this MR imaging study.
The NAFLD patients were part of a study titled “Novel MR imaging and spectroscopy in the non-invasive evaluation of NAFLD.” The specific aims of this study include MR imaging and MR spectroscopic evaluation of NAFLD and examining the correlation between visceral fat and liver fat. All the patients with NAFLD were enrolled through our institution's Nonalcoholic Steatohepatitis Clinic if they had recently had or were willing to have a liver biopsy.
The second trial, the Women's Interagency HIV Study (11,12), was started in 1994 to investigate the progression of HIV in women with or at risk for HIV. It resulted in a substudy to identify noninvasive markers of liver conditions such as liver steatosis on MR imaging and visceral fat measurement. HCV-infected patients were recruited from the northern California site of the Women's Interagency HIV Study if they were considered suitable for and were willing to undergo a liver biopsy.
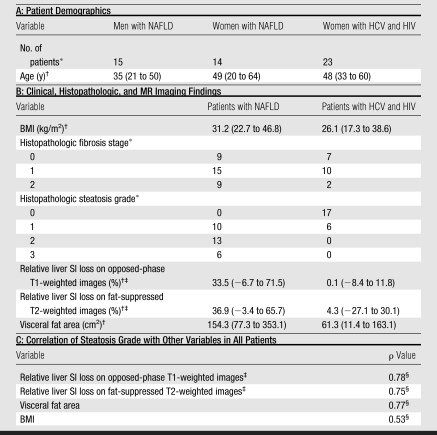
A final population of 52 patients (15 men, 37 women; mean age, 46 years; age range, 12–68 years) formed the study group (Table). There was no significant difference in the patient age distribution between men and women or between the two disease groups. All patients underwent MR imaging within 4 months of liver biopsy. The mean for patients with NAFLD was 2 days (range, 1–30 days), and the mean for patients with HCV and HIV was 40 days (range, 7–122 days). BMI was routinely recorded as part of the clinical assessment for all patients. A BMI greater than 25 is generally accepted as indicative of clinically overweight status, and a BMI greater than 30, of obese status.
Table 1.
Patient Demographics, Histopathologic, and MR Imaging Findings and Correlation of Variables with Histopathologic Results
Data are number of patients.
Data are the mean, with the range in parentheses.
Relative liver SI loss was determined as previously described (10).
P < .01.
MR Imaging Technique
MR imaging was performed with a 1.5-T superconducting magnet (Signa; GE Medical Systems, Milwaukee, Wis) and a torso phased-array coil (GE Medical Systems). The imaging protocol included the following: coronal T1-weighted dual-phase gradient-echo sequence (repetition time msec/echo time msec, 120/2.1 [opposed phase], 120/4.2 [in phase]; flip angle, 70°; section thickness, 8 mm; gap, 1 mm; matrix, 256 × 128–192; field of view, 32–40 cm), axial T2-weighted single-shot fast spin-echo (∞/100 [effective]; section thickness 6mm; gap, 1 mm; matrix, 256 × 160–192; field of view, 32–40 cm), axial breath-hold fast recovery fast spin-echo sequence with and without fat-suppression (2500–3000/100; echo train length, 23; section thickness, 8 mm; gap, 2 mm; matrix, 256/160 × 0.75; number of signals acquired, 1; fat suppression was applied by using manual frequency selection); axial breath-hold T1-weighted fast gradient-echo in-phase sequence with water-suppression by using spectrally selective chemical saturation (90–150/4.2; flip angle, 70°; section thickness, 10 mm; gap, 10 mm; matrix, 256 × 128–192).
Image Interpretation
MR images were reviewed on a picture archiving and communication system workstation (Impax; Agfa, Mortsel, Belgium) by a single reader (A.C.W., with 3 years subspecialty experience in abdominal imaging) who was unaware of histopathologic and clinical results. The methods used to measure SI values from regions of interest (ROIs) in the liver and spleen and to calculate the relative SI losses of the liver were based on previously described methods (10). The SI of the spleen was used to adjust for the lack of an objective SI scale at MR imaging (13). The percentage of relative SI loss on opposed-phase and fat-suppressed MR images was considered to be a reasonable measurement of liver fat on the basis of the known effect of fat on SI values but was not considered to a be a direct measurement of the histopathologically determined percentage of fat.
The SI values of the liver and spleen were recorded on in- and opposed-phase T1-weighted MR images and T2-weighted MR images with and without fat-suppression. The ROIs measured 1–2 cm in diameter and were placed at anatomically matched locations on paired sequences by using a coregistration tool available on the picture archiving and communication system workstation. Locations were selected to exclude major vessels and artifacts. Twelve circular ROIs were obtained in the liver (two in the right lobe and two in the left lobe at each of three levels [above, below, and at the level of the porta hepatis]). The standard deviation of the SI measurements within each ROI was kept to less than 10%. The ROIs were placed at a similar depth from the liver and spleen surfaces on the paired T1- and T2-weighted MR images.
A mean liver SI was obtained for the liver in each patient to account for signal heterogeneity. The SI of the spleen was similarly measured with a circular ROI of 1–2 cm in diameter. A mean spleen SI was calculated from nine ROIs (three ROIs obtained at each of three levels) in the spleen corresponding to the selected liver levels by using the coregistration tool. Liver fat was estimated on opposed-phase MR images as the percentage of relative SI loss of the liver on opposed-phase images with a previously used formula (10): [(SIin − SIout)/SIin] × 100, where SIin is in-phase mean liver SI divided by in-phase mean spleen SI, and SIout is opposed-phase mean liver SI divided by opposed-phase mean spleen SI.
Adequacy of fat suppression was qualitatively assessed and determined to be adequate on the T2-weighted images. Liver fat was quantified on fat-suppressed MR images as the percentage of relative SI loss of the liver on fat-suppressed images with the following formula: [(SInonfat − SIfat)/SInonfat] × 100, where SInonfat is mean liver SI without fat suppression divided by mean spleen SI without fat suppression, and SIfat is mean liver SI with fat suppression divided by mean spleen SI with fat suppression.
Visceral fat area was measured on our picture archiving and communication system workstation at the L2-3, L3-4, and L4-5 intervertebral disk levels on axial water-suppressed T1-weighted images by using a sagittal localizer image to select the required levels (Fig 1). A free-form ROI and manual thresholding were used to select tissue of fat SI (high SI) within the confines of the abdominal wall. A mean visceral fat area was calculated for each patient from the measurements at the three intervertebral disk levels. The time to measure the visceral fat for each patient was 5–10 minutes and was slower at the onset of the study. Although a standardized MR imaging technique was used for all patients, insufficient coverage of the abdomen occurred in eight patients with NAFLD due to insufficient imaging time resulting from a delay in starting the patient's imaging session or the patient being unable to stay in the imager for the duration of the session. Therefore, the visceral fat area could not be measured according to our study protocol in eight of the 52 patients. Liver fat analysis was not affected in these eight patients.
Figure 1a:
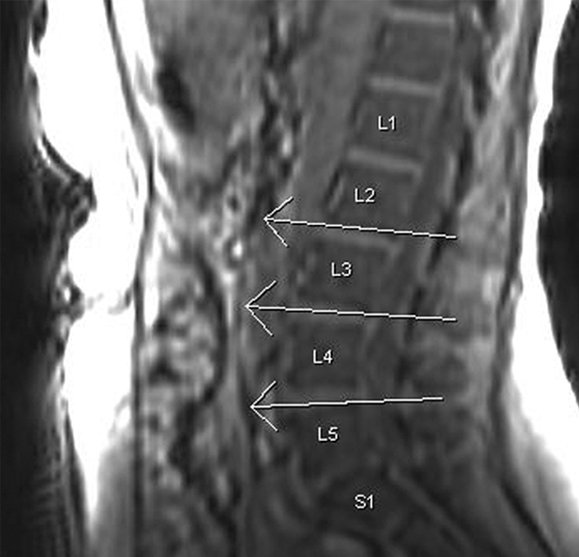
Visceral fat measurement technique. (a) Sagittal T1-weighted localizer MR image used to select levels for analysis (ie, L2-3, L3-4, L4-5). (b) Axial T1-weighted MR image with water suppression at the L2-3 level. Contrast was manually adjusted to select signal from fat (high SI), and ROIs were manually drawn to outline intraperitoneal fat (inside white lines). Area of this fat was calculated by the workstation.
Figure 1b:
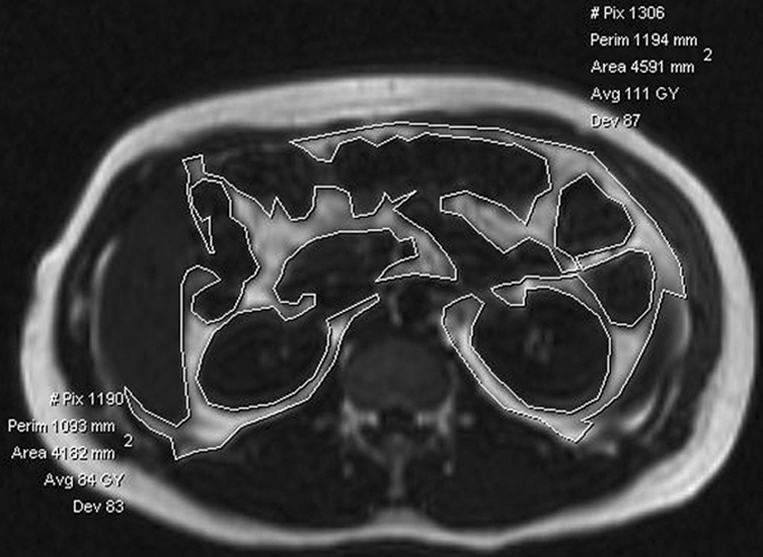
Visceral fat measurement technique. (a) Sagittal T1-weighted localizer MR image used to select levels for analysis (ie, L2-3, L3-4, L4-5). (b) Axial T1-weighted MR image with water suppression at the L2-3 level. Contrast was manually adjusted to select signal from fat (high SI), and ROIs were manually drawn to outline intraperitoneal fat (inside white lines). Area of this fat was calculated by the workstation.
Histopathologic Analysis
Liver tissue was obtained by using percutaneous core biopsy for histopathologic analysis and was reviewed by a single pathologist (L.F., with 26 years faculty experience with liver expertise), who was unaware of imaging findings (14). Liver steatosis grade was determined by estimating the percentage of fat-containing hepatocytes on hematoxylin-eosin–stained specimens (15,16). The grading system for liver steatosis was based on that used in prior studies (15): grade 0 corresponding to less than 5% steatosis; grade 1, 6%–33% steatosis; grade 2, 34%–66% steatosis; and grade 3, greater than 66% steatosis. The grading system incorporates the accepted normal value of histopathologic liver fat, which is less than 5%, and is the standard applied in the clinical assessment of severity of liver steatosis by hepatologists and gastroenterologists. Fibrosis was staged according to the Brunt and Ishak classification (15,17), with stage 0 indicating no fibrosis and subsequent stages indicating increasing fibrosis; stage 3 or greater was indicative of advanced fibrosis.
Statistical Analysis
Statistical analysis was performed by using software (SAS Release, version 8.2; SAS Institute, Cary, NC). The Spearman rank correlation coefficient (ρ) was used to examine the association of histopathologic liver steatosis grade with relative liver SI loss on opposed-phase and fat-suppressed T2-weighted MR imaging, average visceral fat area, and BMI. A P value of less than .05 was considered to indicate a significant difference.
A classification tree analysis (recursive partitioning) (18,19) was used to derive a simple decision algorithm for staging steatosis on the basis of a patient's known covariate values. Recursive partitioning attempts to “split” a sample of observations into increasingly homogeneous subsets in terms of their observed covariate values, which is accomplished through a computer-intensive iterative process that is inherently nonparametric and implicitly examines interactions between the covariates included in the model. Recursive partitioning was performed by using the R add-on package (rpart, version 3.1–3.4) initially developed for use in S-Plus (Insightful, Seattle, Wash) by Terry Therneau and Beth Atkinson of the Mayo Clinic (Rochester, Minn) and subsequently ported to R by Brian Ripley. Recursive partitioning was also used to determine if a threshold average visceral fat area could be used to discriminate between patients without (grade 0) and with liver steatosis (grades 1–3) (n = 44).
RESULTS
Histopathology
The number of patients with different steatosis grades and fibrosis stages are given in the Table. None of the patients had clinical evidence of hemachromatosis.
Markers of Steatosis
The mean percentages of liver SI loss on opposed-phase and fat-suppressed images for patients with NAFLD and liver disease due to HCV and HIV are given in the Table. The mean visceral fat area on MR imaging for all patients was 105.7 cm2 (range, 11.4–353.1 cm2) (n = 44) (Table).
Correlation Analysis
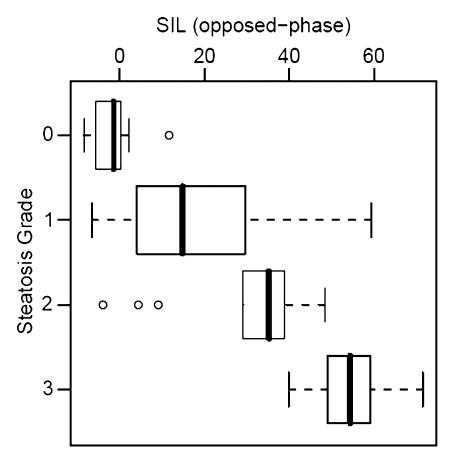
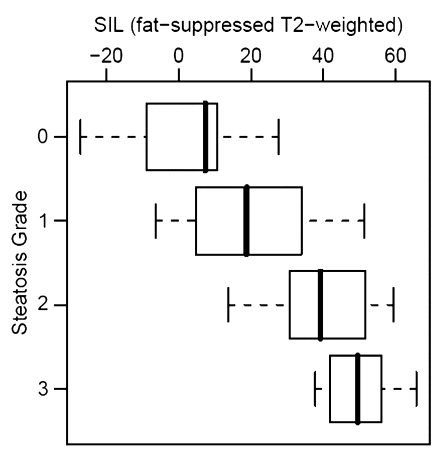
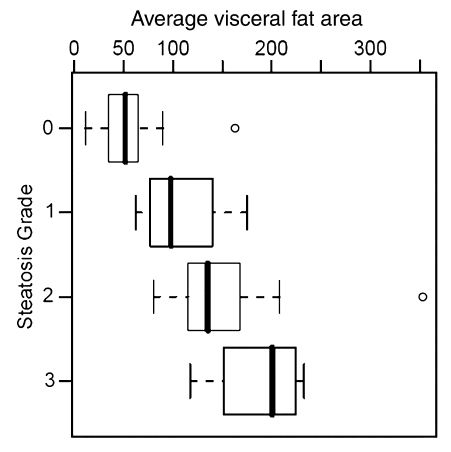
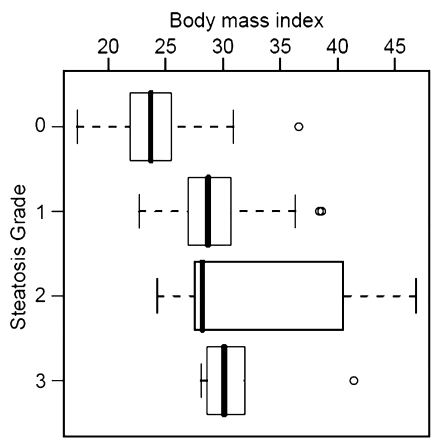
Histopathologic liver steatosis grade correlated well with relative liver SI loss on opposed-phase images (ρ = 0.78), with relative liver SI loss on fat-suppressed images (ρ = 0.75), and with visceral fat area as measured on MR images (ρ = 0.77) (all P < .01) (Table). A weaker correlation was observed between histopathologic liver steatosis grade and BMI (ρ = 0.53) (P < .01) (Fig 2). The correlations of liver SI loss on both opposed-phase and fat-suppressed images and visceral fat area with steatosis were all significantly greater than the correlation of BMI with steatosis (P < .01).
Figure 2a:
Correlation between steatosis grade and (a) relative liver MR SI loss (SIL) on opposed-phase images (ρ = 0.78), (b) relative SI loss on fat-suppressed T2-weighted images (ρ = 0.75), (c) visceral fat area (ρ = 0.77), and (d) BMI (ρ = 0.53). Bold line = median, box = 1st–3rd quartile, dashed line = 95% confidence interval, ○ = outliers.
Figure 2b:
Correlation between steatosis grade and (a) relative liver MR SI loss (SIL) on opposed-phase images (ρ = 0.78), (b) relative SI loss on fat-suppressed T2-weighted images (ρ = 0.75), (c) visceral fat area (ρ = 0.77), and (d) BMI (ρ = 0.53). Bold line = median, box = 1st–3rd quartile, dashed line = 95% confidence interval, ○ = outliers.
Figure 2c:
Correlation between steatosis grade and (a) relative liver MR SI loss (SIL) on opposed-phase images (ρ = 0.78), (b) relative SI loss on fat-suppressed T2-weighted images (ρ = 0.75), (c) visceral fat area (ρ = 0.77), and (d) BMI (ρ = 0.53). Bold line = median, box = 1st–3rd quartile, dashed line = 95% confidence interval, ○ = outliers.
Figure 2d:
Correlation between steatosis grade and (a) relative liver MR SI loss (SIL) on opposed-phase images (ρ = 0.78), (b) relative SI loss on fat-suppressed T2-weighted images (ρ = 0.75), (c) visceral fat area (ρ = 0.77), and (d) BMI (ρ = 0.53). Bold line = median, box = 1st–3rd quartile, dashed line = 95% confidence interval, ○ = outliers.
Recursive partitioning produced a simple decision algorithm for grading steatosis solely on the basis of SI loss on opposed-phase images. The cut-points of relative liver SI loss on opposed-phase images derived from this analysis were at less than 3%, at least 3% but less than 35%, at least 35% but less than 49%, and greater than or equal to 49%, which correspond to histopathologic steatosis grades of 0 (n = 16 of 17), 1 (n = 11 of 16), 2 (n = 7 of 13), and 3 (n = 5 of 6), respectively (Fig 2a). By using the same model, visceral fat area greater than or equal to 73.8 cm2 was found to be predictive of presence of clinical liver steatosis (grades 1, 2, or 3) in 93% (41 of 44) of patients (Fig 2c). A clear separation of patients with grade 2 and those with grade 3 steatosis was demonstrated by an SI loss of greater than 20% on opposed-phase images.
DISCUSSION
Liver biopsy is the current standard of reference for the diagnosis and grading of steatosis, but it is an invasive procedure with recognized morbidity and mortality and is not desirable if repeat investigations are required or when evaluating liver disease in children. Our findings suggest that liver steatosis can be reliably detected by observing relative liver SI loss on opposed-phase T1-weighted and fat-suppressed T2-weighted MR images and that histopathologic liver steatosis is better correlated with the measurement of visceral fat area than with BMI in patients with diffuse liver disease.
In concordance with our findings, Levenson et al (7) also found a good correlation between histopathologically determined liver steatosis and liver-to-spleen SI ratios on opposed-phase gradient-echo MR images in a small cohort of patients with noncirrhotic livers (n = 16, r = 0.86, P < .01). A small number of additional studies (8–10) have also shown the ability to measure liver fat with T1-weighted MR imaging. By using rat models of simple fatty infiltration and fatty liver with hepatocellular injury, Kreft et al (8) found that conventional T1-weighted images and chemical shift images showed good correlation (r = 0.83 and 0.80, respectively) between SI and the degree of steatosis, although only chemical shift imaging was reportedly reliable. Qayyum et al (10) demonstrated that liver fat may be quantified with both opposed-phase gradient-echo and fat-suppressed fast spin-echo MR imaging (r = 0.69 and 0.92, respectively; P < .01) in patients without cirrhosis (n = 11). In this larger study, we observed similar correlations with opposed-phase (ρ = 0.78) and fat-suppressed imaging (ρ = 0.75).
Although ultrasonography (US) and computed tomography (CT) have been used to quantify liver steatosis (20–22), there are several well-established limitations (eg, inability to distinguish between fibrosis and fat with US, masking effect of factors that increase liver attenuation on CT images [iron, copper, glycogen, or amiodarone therapy]) (23).
Fat-suppressed T2-weighted fast spin-echo MR imaging is less commonly used to measure liver fat than the other cross-sectional techniques, and although this technique has been subject to controversy, it may be more robust than T1-weighted gradient-echo imaging in patients with increased amounts of liver iron (7,8,10,24). An additional consideration that may reduce the correlation of liver fat with SI loss on fat-suppressed T2-weighted images is potential inhomogeneity of fat suppression, which was only qualitatively determined to be adequate in our study. Such inhomogeneity may be an explanation for the observed negative correlation between SI loss on fat-suppressed T2-weighted images and grade 0 steatosis in some patients. In patients with diffuse liver disease who do not have hemochromatosis or end-stage liver disease (both associated with increased likelihood of liver iron deposition), there is not necessarily an advantage to using T2-weighted imaging in addition to the more widely used opposed-phase imaging technique for liver fat estimation. However, it may be prudent to repeat the opposed-phase imaging sequence with an additional two echo times to ensure no SI loss occurs with increasing echo time, which would indicate the presence of liver iron in a broader population.
In concordance with our study, several prior publications (25–31) have shown a greater correlation between visceral adiposity and liver steatosis than that between BMI and liver steatosis. More recently, the use of BMI has been superceded by the waist-to-hip ratio as an indirect measure of visceral adiposity. However, the reported correlations with liver steatosis have been low (r = 0.44, n = 83; and r = 0.30, n = 126) (25,30). We are unaware of any studies in which histopathologically determined liver steatosis was compared to MR imaging–determined visceral fat area. The high correlation observed in our study (ρ = 0.77) suggests that imaging is a better surrogate marker of obesity-related morbidity than anthropometric indexes. Our findings support the theory of adipokine (such as visfatin) production by visceral fat (6), since a threshold visceral fat area was found to be associated with liver steatosis.
Some limitations of our study should be noted. First, the 23 HCV-infected patients were all women who also had HIV infection. The independent effect of the latter virus or its treatment was not within the scope of this study, since our aim was to evaluate the relationship between liver steatosis measured at biopsy with MR imaging and anthropometric measurements. Similarly, HIV may affect visceral adiposity; however, despite this potential limitation, a good correlation was observed between visceral fat area and liver steatosis.
Second, the HCV-infected women had steatosis grades of 0 or 1, while higher grades of steatosis occurred in the patients with NAFLD, which may have resulted in additional discriminatory factors influencing the relationship between histopathologic findings and the recorded parameters. However, the inclusion of both HCV and HIV-infected women and patients with NAFLD allowed us to examine the correlation between MR imaging and a wider range of steatosis grades than would have been possible with a single group.
Third, liver biopsy and MR imaging were separated by an interval of up to 4 months in the HCV and HIV-infected patients, and some alteration in the degree of liver fat may have occurred during this time, which may have reduced our observed correlations.
Fourth, our classification analysis represents a relatively small number of patients within each steatosis grade and therefore should be validated with larger studies.
Fifth, the liver biopsies were not stained for iron, since this was not part of the routine clinical assessment and hemochromatosis was not suspected on clinical evaluation. Furthermore, our patient population had early liver disease, and liver iron deposition is generally a feature of advanced liver disease and cirrhosis. Similarly, since none of the patients had advanced fibrosis or hemochromatosis, evaluation of T2*-weighted effects of iron in the spleen was not thought to be necessary.
In conclusion, liver SI loss on opposed-phase T1-weighted images and MR imaging visceral fat measurement may be used as biomarkers for the presence of liver steatosis.
ADVANCES IN KNOWLEDGE
Liver signal intensity (SI) loss on opposed-phase T1-weighted MR images may be used to grade the severity of liver steatosis.
Histopathologic liver steatosis is associated with a threshold visceral fat area.
IMPLICATION FOR PATIENT CARE
Liver SI loss on opposed-phase T1-weighted MR images and MR imaging measurement of visceral fat area may be used as biomarkers for the presence of liver steatosis.
Acknowledgments
This study received funding support from RFA-DK-01, a supplemental grant to the Nonalcoholic Steatohepatitis Clinical Research Network; RO1 DK074718-01, the Women's Interagency Study study, funded by the National Institute of Allergy and Infectious Diseases, with additional supplemental funding from the National Cancer Institute, the National Institute of Child Health and Human Development (NICHD), the National Institute on Drug Abuse, the Agency for Health Care Policy and Research, the National Center for Research Resources, and the Centers for Disease Control and Prevention: U01-AI-35004, U01-AI-31834, U01-AI-34994, U01-AI-34994, U01-AI-34989, U01-HD-32632 (NICHD), U01-AI-34993, U01-AI-42590, M01-RR00079, and M01-RR00083.
Abbreviations
BMI = body mass index
HCV = hepatitis C virus
HIV = human immunodeficiency virus
NAFLD = nonalcoholic fatty liver disease
ROI = region of interest
SI = signal intensity
Author contributions: Guarantors of integrity of entire study, M.B., A.Q., P.W.C.; study concepts/study design or data acquisition or data analysis/interpretation, all authors; manuscript drafting or manuscript revision for important intellectual content, all authors; approval of final version of submitted manuscript, all authors; literature research, M.B., A.Q., A.C.W., S.M.N., P.W.C., P.C.T., R.B.M.; clinical studies, M.B., A.Q., P.W.C., L.F., N.M.B.; statistical analysis, M.B., P.W.C.; and manuscript editing, all authors
Authors stated no financial relationship to disclose.
Funding: This research was supported by the National Institute of Diabetes and Digestive and Kidney Diseases (grant supplement to RFA-DK-01-025); National Institute of Allergy and Infectious Diseases (grant R01 DK074718-01); and National Cancer Institute, National Institute of Child Health and Human Development, National Institute on Drug Abuse, Agency for Health Care Policy and Research, National Center for Research Resources, and Centers for Disease Control and Prevention (grants U01-AI-35004, U01-AI-31834, U01-AI-34994, U01-AI-34989, U01-HD-32632, U01-AI-34993, U01-AI-42590, M01-RR00079, M01-RR00083).
References
- 1.Ramesh S, Sanyal AJ. Hepatitis C and nonalcoholic fatty liver disease. Semin Liver Dis 2004;24:399–413. [DOI] [PubMed] [Google Scholar]
- 2.Ludwig J, Viggiano TR, McGill DB, Oh BJ. Nonalcoholic steatohepatitis: Mayo Clinic experiences with a hitherto unnamed disease. Mayo Clin Proc 1980;55:434–438. [PubMed] [Google Scholar]
- 3.Festi D, Colecchia A, Sacco T, Bondi M, Roda E, Marchesini G. Hepatic steatosis in obese patients: clinical aspects and prognostic significance. Obes Rev 2004;5:27–42. [DOI] [PubMed] [Google Scholar]
- 4.Negro F. Mechanisms and significance of liver steatosis in hepatitis C virus infection. World J Gastroenterol 2006;12:6756–6765. [DOI] [PMC free article] [PubMed] [Google Scholar]
- 5.Luyckx FH, Desaive C, Thiry A, et al. Liver abnormalities in severely obese subjects: effect of drastic weight loss after gastroplasty. Int J Obes Relat Metab Disord 1998;22:222–226. [DOI] [PubMed] [Google Scholar]
- 6.Bonora E. Relationship between regional fat distribution and insulin resistance. Int J Obes Relat Metab Disord 2000;24(suppl 2):S32–S35. [DOI] [PubMed] [Google Scholar]
- 7.Levenson H, Greensite F, Hoefs J, et al. Fatty infiltration of the liver: quantification with phase-contrast MR imaging at 1.5 T vs biopsy. AJR Am J Roentgenol 1991;156:307–312. [DOI] [PubMed] [Google Scholar]
- 8.Kreft BP, Tanimoto A, Baba Y, et al. Diagnosis of fatty liver with MR imaging. J Magn Reson Imaging 1992;2:463–471. [DOI] [PubMed] [Google Scholar]
- 9.Fishbein MH, Gardner KG, Potter CJ, Schmalbrock P, Smith MA. Introduction of fast MR imaging in the assessment of hepatic steatosis. Magn Reson Imaging 1997;15:287–293. [DOI] [PubMed] [Google Scholar]
- 10.Qayyum A, Goh JS, Kakar S, Yeh BM, Merriman RB, Coakley FV. Accuracy of liver fat quantification at MR imaging: comparison of out-of-phase gradient-echo and fat-saturated fast spin-echo techniques—initial experience. Radiology 2005;237:507–511. [DOI] [PubMed] [Google Scholar]
- 11.Barkan SE, Melnick SL, Preston-Martin S, et al. The Women's Interagency HIV Study. Epidemiology 1998;9:117–125. [PubMed] [Google Scholar]
- 12.Bacon MC, von Wyl V, Alden C, et al. The Women's Interagency HIV Study: an observational cohort brings clinical sciences to the bench. Clin Diagn Lab Immunol 2005;12:1013–1019. [DOI] [PMC free article] [PubMed] [Google Scholar]
- 13.Schwartz LH, Panicek DM, Koutcher JA, et al. Adrenal masses in patients with malignancy: prospective comparison of echo-planar, fast spin-echo, and chemical shift MR imaging. Radiology 1995;197:421–425. [DOI] [PubMed] [Google Scholar]
- 14.Kleiner DE, Brunt EM, Van Natta M, et al. Design and validation of a histological scoring system for nonalcoholic fatty liver disease. Hepatology 2005;41:1313–1321. [DOI] [PubMed] [Google Scholar]
- 15.Brunt EM. Nonalcoholic steatohepatitis: definition and pathology. Semin Liver Dis 2001;21:3–16. [DOI] [PubMed] [Google Scholar]
- 16.Duerinckx A, Rosenberg K, Hoefs J, et al. In vivo acoustic attenuation in liver: correlations with blood tests and histology. Ultrasound Med Biol 1988;14:405–413. [DOI] [PubMed] [Google Scholar]
- 17.Lefkowitch JH. Liver biopsy assessment in chronic hepatitis. Arch Med Res 2007;38:634–643. [DOI] [PubMed] [Google Scholar]
- 18.Breiman L, Friedman J, Stone C, Olshen R. Classification and regression trees. Monterey, Calif: Wadsworth, 1984.
- 19.Zhang HP, Singer B. Recursive partitioning in the health sciences. New York, NY: Springer, 1999.
- 20.Ricci C, Longo R, Gioulis E, et al. Non-invasive in vivo quantitative assessment of fat content in human liver. J Hepatol 1997;27:108–113. [DOI] [PubMed] [Google Scholar]
- 21.Saadeh S, Younossi ZM, Remer EM, et al. The utility of radiological imaging in nonalcoholic fatty liver disease. Gastroenterology 2002;123:745–750. [DOI] [PubMed] [Google Scholar]
- 22.Limanond P, Raman SS, Lassman C, et al. Macrovesicular hepatic steatosis in living related liver donors: correlation between CT and histologic findings. Radiology 2004;230:276–280. [DOI] [PubMed] [Google Scholar]
- 23.Siegelman ES, Rosen MA. Imaging of hepatic steatosis. Semin Liver Dis 2001;21:71–80. [DOI] [PubMed] [Google Scholar]
- 24.Westphalen AC, Qayyum A, Yeh BM, et al. Liver fat: effect of hepatic iron deposition on evaluation with opposed-phase MR imaging. Radiology 2007;242:450–455. [DOI] [PubMed] [Google Scholar]
- 25.Kral JG, Schaffner F, Pierson RN Jr, Wang J. Body fat topography as an independent predictor of fatty liver. Metabolism 1993;42:548–551. [DOI] [PubMed] [Google Scholar]
- 26.Asayama K, Hayashibe H, Dobashi K, Uchida N, Kawada Y, Nakazawa S. Relationships between biochemical abnormalities and anthropometric indices of overweight, adiposity, and body fat distribution in Japanese elementary school children. Int J Obes Relat Metab Disord 1995;19:253–259. [PubMed] [Google Scholar]
- 27.Omagari K, Kadokawa Y, Masuda J, et al. Fatty liver in non-alcoholic non-overweight Japanese adults: incidence and clinical characteristics. J Gastroenterol Hepatol 2002;17:1098–1105. [DOI] [PubMed] [Google Scholar]
- 28.Ruhl CE, Everhart JE. Determinants of the association of overweight with elevated serum alanine aminotransferase activity in the United States. Gastroenterology 2003;124:71–79. [DOI] [PubMed] [Google Scholar]
- 29.Eguchi Y, Eguchi T, Mizuta T, et al. Visceral fat accumulation and insulin resistance are important factors in nonalcoholic fatty liver disease. J Gastroenterol 2006;41:462–469. [DOI] [PubMed] [Google Scholar]
- 30.Marceau P, Biron S, Hould FS, et al. Liver pathology and the metabolic syndrome X in severe obesity. J Clin Endocrinol Metab 1999;84:1513–1517. [DOI] [PubMed] [Google Scholar]
- 31.Sabir N, Sermez Y, Kazil S, Zencir M. Correlation of abdominal fat accumulation and liver steatosis: importance of ultrasonographic and anthropometric measurements. Eur J Ultrasound 2001;14:121–128. [DOI] [PubMed] [Google Scholar]


