

Abstract
Purpose: To retrospectively assess the magnetic resonance (MR) imaging predictors of success at reducing uterine leiomyoma volume and achieving patient symptom relief 12 months after MR imaging–guided focused ultrasound surgery.
Materials and Methods: This single-center retrospective analysis of 71 symptomatic fibroids in 66 women was approved by the institutional review board and was HIPAA-compliant. Patients were treated with MR imaging–guided focused ultrasound surgery. The volume of treated fibroid and nonperfused volume (NPV) were calculated with software, while symptom outcome was assessed with a symptom severity score (SSS). Fibroids were classified as hyperintense or hypointense relative to skeletal muscle on pretreatment T2-weighted MR images.
Results: Baseline volume of treated fibroids was 255.5 cm3 ± 201.7 (standard deviation), and baseline SSS was 61.5 ± 14.9. Both pretreatment fibroid signal intensity (SI) and posttreatment NPV predicted 12-month volume reduction independently: Fibroids with an NPV of at least 20% or with low SI both showed significantly larger volume reduction (17.0% ± 13.0 and 17.2% ± 20.1, respectively) than fibroids with an NPV less than 20% or with high SI (10.7% ± 18.2 and no significant change, respectively). Patients whose fibroids demonstrated an NPV of at least 20% also experienced a larger decrease in SSS than did patients with fibroids with an NPV less than 20% (50.1% ± 19.8 vs 32.6% ± 29.9).
Conclusion: Fibroids with low SI on pretreatment T2-weighted MR images were more likely to shrink than were ones with high SI. The larger the NPV immediately after treatment, the greater the volume reduction and symptom relief were. These findings may help both in selecting appropriate patients for MR-guided focused ultrasound surgery and in predicting patient outcome.
© RSNA, 2008
Previous reports (1–6) have indicated that magnetic resonance (MR) imaging–guided focused ultrasound surgery provides a safe and feasible alternative to surgical resection for the treatment of uterine fibroids. The goal of this treatment is to cause thermal coagulation and ablation of the target fibroid by methodically sonicating multiple locations to reduce volume and provide symptom relief. Contrast agent–enhanced pre- and posttreatment MR images are used to determine the newly induced nonperfused volume (NPV) of the fibroid, which is the volume of tissue that was effectively ablated (5,7–8). Initial treatment guidelines were designed to provide safe treatment. Treatments performed according to initial guidelines led to significant improvement in symptoms despite small volumes of tissue ablated and have been shown to be sustained 12 and 24 months after treatment in many patients (5,7). MR-guided focused ultrasound surgery has also been shown to be effective at fibroid volume reduction at 6-month follow-up (3).
In previous clinical studies (3–5,7), both fibroid volume reduction and symptom relief showed a range of variability among patients, even at short-term follow-up: Some patients had significant symptom relief and fibroid shrinkage, while others seemed to be resistant to the therapy. Thus, it is important to examine the data and attempt to define criteria for treatment success. Fennessy et al (5) found that a patient's symptom score change at 6-month follow-up was partly determined by NPV after MR-guided focused ultrasound surgery: Treatment under more restrictive guidelines resulted in a smaller NPV and, thus, less symptom relief than that with the modified less restrictive guidelines. In another study, Funaki et al (9) reported a larger posttreatment NPV and, in line with this finding, greater volume reduction at 6-month follow-up in fibroids with low signal intensity (SI) on T2-weighted MR images. However, it has not been clarified whether the fibroid SI predicts volume changes based on differences in NPV or in an independent manner.
Knowledge of predictors of success is critical in determining how to optimize treatment with MR-guided focused ultrasound surgery. This is particularly important because there are a range of options available for treatment of fibroids, and selection guidance is needed. In this study, we sought to retrospectively assess baseline MR imaging predictors of successful reduction of uterine leiomyoma volume and patient symptom relief 12 months after MR-guided focused ultrasound surgery.
MATERIALS AND METHODS
Several authors have served as consultants for InSightec (E.A.S., F.A.J., C.M.C.T.). Authors who were not consultants for InSightec had control over inclusion of data and information submitted for publication.
Patients
All patients gave written informed consent for MR imaging–guided focused ultrasound surgery and for inclusion in this continued access study. This Health Insurance Portability and Accountability Act–compliant retrospective study had institutional review board approval. Between February 2002 and December 2005, a total of 243 fibroid patients were screened for treatment with MR-guided focused ultrasound surgery as part of a prospective multicenter clinical trial, with overall results previously published (4–5,7). After screening, 135 patients were determined to meet all eligibility criteria and were treated with MR-guided focused ultrasound surgery at Brigham and Women's Hospital. The eligibility criteria for enrollment in the trial of MR-guided focused ultrasound surgery have been previously described (1–5). Patients with calcified fibroids were excluded. Of the 135 treated patients, 69 did not undergo 6- and/or 12-month follow-up: Thirty-one sought alternative treatment, 34 were lost to or were overdue for follow-up, and four left the study for personal reasons.
In this retrospective study, we report on the 66 women who underwent complete follow-up (ie, leiomyoma volume and leiomyoma-related symptom assessment at both 6 and 12 months after treatment). Of the patients included in this study, 13 were from the pivotal trial population (4), 50 were from the continued access study (5), and three were part of a study dedicated to evaluating the response in African American patients. Thirty-five patients had multiple uterine fibroids, and 31 had only one. One fibroid was treated in 61 patients, and two fibroids were sonicated during the same treatment session in the remaining five patients. Two patients had a fibroid treated with MR-guided focused ultrasound surgery twice within a 14-day interval.
MR-guided Focused Ultrasound Surgery Device
The equipment used for MR-guided focused ultrasound surgery in this study has been previously described (1) and is a combination of a 1.5-T magnet (Signa; GE Healthcare, Milwaukee, Wis) and a focused ultrasound device (ExAblate 2000; InSightec, Haifa, Israel). The ExAblate 2000 system consists of a phased-array transducer (208 elements; frequency, 0.96–1.14 MHz), a computer-controlled positioning system, a multichannel radiofrequency amplifier system, and a user interface.
Pretreatment Imaging
Several days before treatment, all patients were evaluated with MR imaging by using a standardized protocol. A 1.5-T MR system (GE Healthcare) with a computer software platform (LX, version 8.3 or higher; GE Healthcare) and a receive-only pelvic coil (USA Instruments, Aurora, Ohio) was used. Three-plane localizer images; axial, sagittal, and coronal T2-weighted fast spin-echo images; T1-weighted spin-echo images; and multiphase fat-suppressed axial T1-weighted spoiled gradient-echo images with fat suppression were obtained. Patients then received an intravenous injection of gadopentetate dimeglumine (0.1 mmol/kg of body weight, Magnevist; Berlex Laboratories, Wayne, NJ), and multiplanar T1-weighted images were obtained. Parameters for the T1- and T2-weighted and spoiled gradient-echo MR images have been previously described (1).
MR images were analyzed to determine the number, size, location, and contrast-enhancement patterns of all uterine leiomyomas and to evaluate the skin surface and any possible obstruction of the ultrasound beam path (eg, bowel loops anterior to the uterus) (1,5). The contrast-enhancement pattern generally showed moderate homogeneous enhancement, similar to the neighboring uterus. Fibroid regions with evident spontaneous nonperfused areas were avoided on treatment day.
Treatment
All patients were treated on an outpatient basis. Pretreatment patient preparation, treatment planning, and sonication have been described in detail in previous publications (1–7). For planning on the day of treatment, standard T2-weighted fast spin-echo images were acquired while the patient was in the prone position on the MR-guided focused ultrasound surgery table. The images were transferred to the ultrasound device user interface, where the desired treatment volume was determined. The ultrasound beam path for each sonication was examined to ensure that the treatment was safe with respect to scars, bladder, bowel, and bone. In addition, the skin was outlined on the treatment planning images by using the ultrasound device software.
After treatment planning, two to five subtherapeutic low-power sonications were performed to ensure accurate targeting. During each sonication, the focused ultrasound system automatically started the temperature-sensitive imaging sequence that was used to guide the procedure (8). Phase-difference fast spoiled gradient-echo MR imaging was used to construct the temperature images (10). The mean number of sonications was 59 ± 23 (standard deviation) (range, 13–113), while mean duration of treatment was 123 minutes ± 28 (range, 75–180 minutes).
The treatment protocol criteria were defined on the basis of the Food and Drug Administration guidelines (5). Originally the maximum treatment volume was 100 cm3 and was limited to 33% of the total fibroid volume, the total “in-bore” treatment time was limited to 3 hours, and a second treatment was not allowed. These guidelines were then relaxed by the Food and Drug Administration: The maximum treatment volume was changed to 150 cm3 and limited to 50% of the total fibroid volume, maximum treatment time remained 3 hours, and a second treatment was allowed. In this study, the 45 patients who were treated prior to April 30, 2004, underwent treatment in accordance with the original guidelines. The remaining 21 patients received treatment under the newer guidelines.
Leiomyoma-related Symptom Assessment
Before treatment and at 6- and 12-month follow-up, patients were asked to complete an eight-item section of a uterine fibroid symptom and quality-of-life questionnaire to determine a symptom severity score (SSS) for leiomyoma-related symptoms (11–14). Components were scored on a five-point Likert scale, with responses ranging from “not at all” to “a very great deal.” A raw SSS score of 21 out of 40 possible points, a reflection of substantial fibroid-related symptoms, was required for entry into the clinical trial (4–6). In this manuscript, the transformed SSS is reported, for which 100 points represents maximal symptom severity.
Posttreatment Follow-up
Immediately following treatment, coronal T1-weighted fast spoiled gradient-echo images were acquired before and after injection of contrast agent. After contrast agent administration, transverse T1-weighted spin-echo images were acquired. This imaging protocol was repeated approximately 6 months (mean, 183 days ± 13) and 12 months (mean, 371 days ± 15) after treatment without any cost to the patient.
Data Analysis
Volume and SI data were analyzed on site by one of the investigators (Z.M.L., with 5 years experience analyzing MR images). The volume of the treated fibroid was calculated on axial T2-weighted fast spin-echo images acquired for treatment planning purposes on the treatment day. The NPV immediately after treatment was calculated on contrast-enhanced coronal T1-weighted spoiled gradient-echo images (Figs 1, 2). The outlines of the leiomyomas and nonperfused treated areas were contoured with electronic calipers to compute the area per section by using volumetric analysis software (3D Slicer, version 2; Brigham and Women's Hospital, Boston, Mass, www.slicer.org). The volume was computed by multiplying the sum of the measured areas by the distance between the centers of two consecutive images. This distance was 7–8 mm for the T2-weighted images (5–6 mm section thickness, 2-mm spacing between sections) and 6–7 mm for the T1-weighted images (5–6 mm section thickness, 1–2-mm spacing between sections). The NPV, as a percentage of volume of treated fibroid, was also calculated. The volume of the treated fibroid and the NPV were calculated prior to, immediately after, and 6 and 12 months after MR-guided focused ultrasound surgery. In the five patients who had two fibroids treated, both of the treated fibroids were assessed.
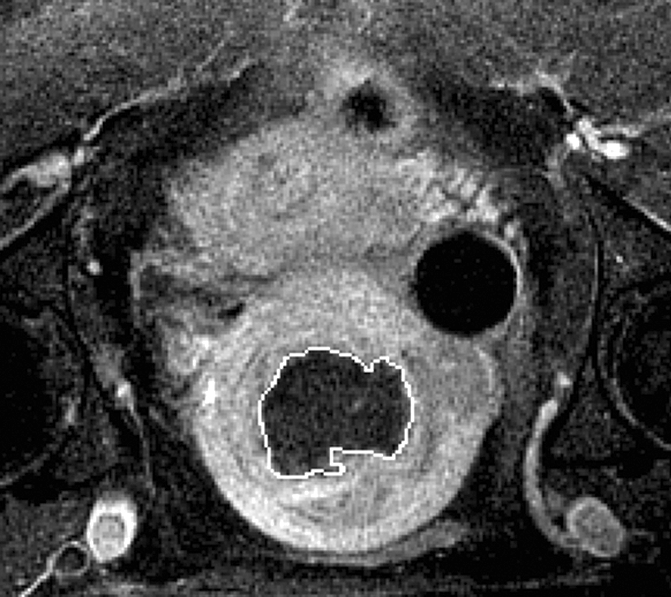
Figure 1a:
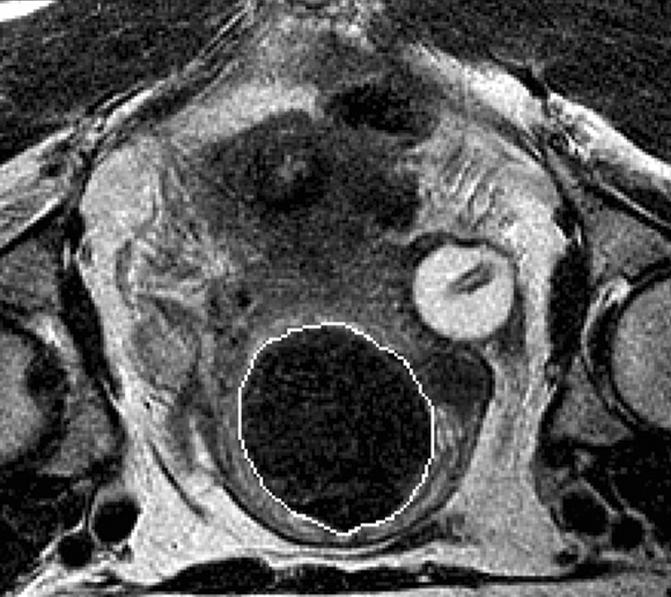
(a) T2-weighted axial MR image of a hypointense fibroid in a 42-year-old patient before MR-guided focused ultrasound surgery. (b) T1-weighted gadolinium-enhanced axial MR image of the same fibroid immediately after treatment. The outlines of treated fibroid and NPV were contoured with electronic calipers to compute the area per section by using volumetric analysis software.
Figure 1b:
(a) T2-weighted axial MR image of a hypointense fibroid in a 42-year-old patient before MR-guided focused ultrasound surgery. (b) T1-weighted gadolinium-enhanced axial MR image of the same fibroid immediately after treatment. The outlines of treated fibroid and NPV were contoured with electronic calipers to compute the area per section by using volumetric analysis software.
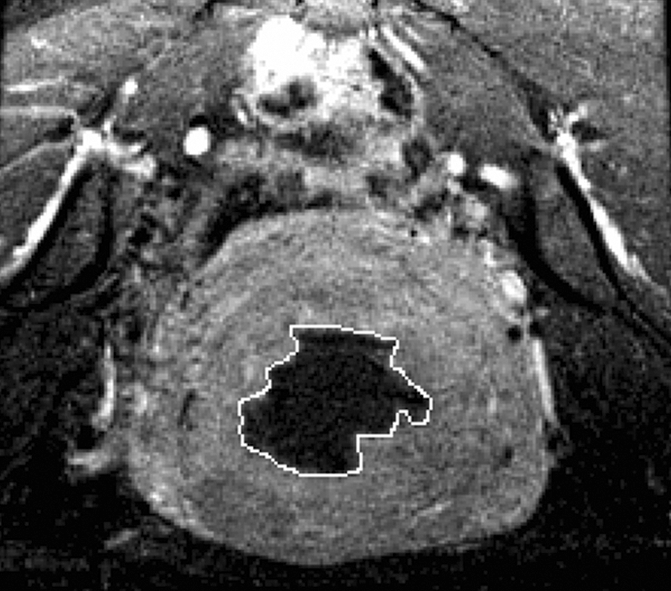
Figure 2a:
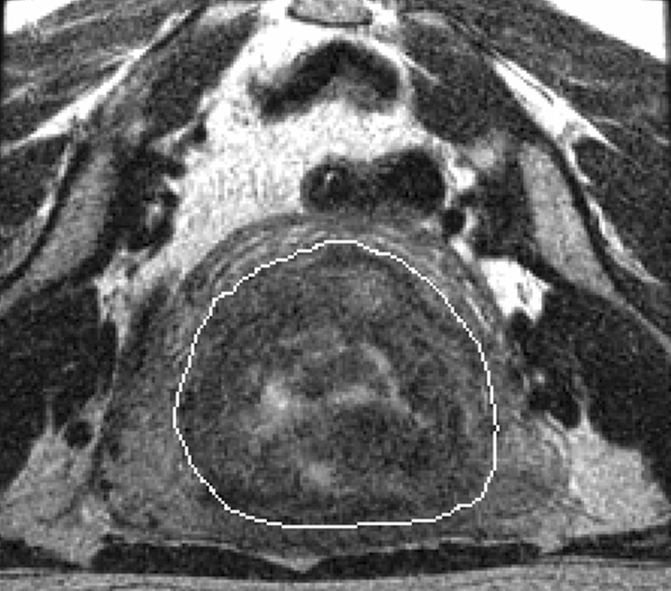
(a) T2-weighted axial MR image of a hypointense fibroid in a 46-year-old patient before MR-guided focused ultrasound surgery. (b) T1-weighted gadolinium-enhanced axial MR image of the same fibroid immediately after treatment. The outlines of treated fibroid and NPV were contoured with electronic calipers to compute the area per section by using volumetric analysis software.
Figure 2b:
(a) T2-weighted axial MR image of a hypointense fibroid in a 46-year-old patient before MR-guided focused ultrasound surgery. (b) T1-weighted gadolinium-enhanced axial MR image of the same fibroid immediately after treatment. The outlines of treated fibroid and NPV were contoured with electronic calipers to compute the area per section by using volumetric analysis software.
Therapeutic treatment sonications were defined as sonications within 10% of the peak power used during the treatment. The temperature of the sonication was the average of 3 × 3 voxel region of interest (ROI) around the hottest value.
Two circular ROIs (approximately 1 cm2) were chosen over areas of skeletal muscle on T2-weighted images, and the mean SIs of these ROIs were averaged to obtain the muscle SI. Also, the largest circular ROI that would encompass the uterine fibroid was used in two representative images, and the mean SIs of these ROIs were averaged to obtain the fibroid SI. As fibroids most often have similar SI over their entire volume on T2-weighted images, these ROIs were considered to be representative of the overall fibroid SI. In fibroids in which hyperintense regions were present within the treated volume, the ROIs were chosen to encompass those areas. Fibroid SI was categorized as hypointense or hyperintense as compared with skeletal muscle SI (15).
Statistical Analysis
Data were statistically analyzed by using a one-way repeated-measures analysis of variance and post hoc Tukey test to detect differences in data as a function of time after MR-guided focused ultrasound surgery. Group comparisons were made by using an unpaired t test and two-way analysis of variance with a post hoc Tukey test. The relationship between variables was determined by simple linear regression analysis. To determine the NPV dependency of changes in fibroid volume and symptom score, different cutoff values of the NPV (ie, 5%, 10%, 15%, 20%, 25%, 30%, 35%, and 40%) were tested to find a value with which the fibroids could be split into two groups that had a statistically significant difference in volume and symptom reduction (χ2 test). To determine whether fibroid SI predicted treatment outcome based on differences in NPV or in an independent manner, we formed four groups of fibroids on the basis of SI (hyperintense or hypointense) and NPV (<20% or ≥20%) and compared the groups with respect to change in fibroid volume and SSS. A P value of less than .05 was considered to indicate a significant difference. Statistical analysis was performed by using software (SigmaStat for Windows, version 2.03; SPSS, Chicago, Ill).
RESULTS
Baseline Patient Characteristics
The 66 women had a mean age of 45.4 years ± 4.4 (Table 1). Mean volume of a treated fibroid before MR imaging–guided focused ultrasound surgery was 255.5 cm3 ± 201.7. Mean NPV immediately after MR imaging–guided focused ultrasound surgery was 43.0 cm3 ± 53.7, which is 16.3% ± 13.3 of the mean baseline volume of a treated fibroid. The women had an SSS of 61.5 ± 14.9 before MR imaging–guided focused ultrasound surgery.
Table 1.
Baseline Characteristics of Patients

Numbers used to calculate percentages are in parentheses.
Values are mean ± standard deviation.
Fibroid Volume and Symptom Changes after Treatment
At 6-month follow-up, the mean volume of treated fibroids was reduced by 12.6% ± 16.9 (mean, −30 cm3 ± 54; range, −266 to 278 cm3) (P < .001), as compared with pretreatment data. Fifty-five (77.5%) of the 71 treated fibroids had decreased in size, two (2.8%) had remained unchanged, and 14 (19.7%) had increased in size at 6-month follow-up. Of the 16 patients whose fibroid did not decrease in size, 14 had symptom improvement at 6-month follow-up.
At 12-month follow-up, the mean volume of treated fibroids was reduced by 9.3% ± 24.8 (mean, −22 cm3 ± 82; range, −334 to 236 cm3) (P < .005). Fifty-three (74.6%) of the 71 treated fibroids had decreased in size, one (1.4%) had remained unchanged, and 17 (23.9%) had increased in size at 12-month follow-up. Of the 18 patients whose fibroid did not decrease in size, 15 had symptom improvement at 12-month follow-up. Residual NPV was 7.1% ± 11.9 (20.2 cm3 ± 39.9) and 4.6% ± 10.9 (13.3 cm3 ± 33.0) of baseline fibroid volume at 6- and 12-month follow-up, respectively.
The reduction in fibroid-related SSS tracked changes in fibroid volume over the 12 months after MR imaging–guided focused ultrasound surgery. At 6- and 12-month follow-up, mean SSS was 34.0 ± 17.2 and 37.6 ± 17.8, respectively (P < .001); 50 (75.8%) and 47 (71.2%) patients, respectively, had at least a 10-point improvement in their SSS compared with baseline SSS; and four (6.1%) and three (4.5%) patients, respectively, had worsening symptoms despite fibroid shrinkage. Symptom relief at 6- and 12-month follow-up was not different between the patients who had one fibroid treated and those who had two treated, most likely because of the small number of patients (n = 5) who had two fibroids treated.
Effect of SI
Thirty-three of the 71 fibroids (46.5%) were hypointense, and 38 (53.5%) were hyperintense on pretreatment T2-weighted MR images. The number of sonications (63.2 ± 24.1 vs 54.8 ± 19.6) and the treatment temperatures (71.5°C ± 6.5 vs 70.4°C ± 6.2) were not different during MR imaging–guided focused ultrasound surgery for hyperintense versus hypointense fibroids. The mean acoustic power was higher for hyperintense fibroids than for those that were hypointense (130.0 W ± 37.0 vs 91.8 W ± 20.9, respectively) (P < .05). Despite of the higher power requirement, the resulting NPV was smaller in hyperintense fibroids than in hypointense ones (13.6% ± 12.7 vs 19.9% ± 13.2, respectively) (P < .05) (Fig 3). At 6-month follow-up, there was a 15.9% ± 15.2 decrease in the volume of hypointense fibroids (P < .05) and a 10.0% ± 17.9 decrease in that of hyperintense fibroids (P < .05) in comparison with pretreatment volumes. At 12-month follow-up, there was a 17.2% ± 20.1 decrease in the volume of hypointense fibroids (P < .05), whereas the volume of hyperintense fibroids showed no difference in comparison with pretreatment volume.
Figure 3:

Bar graph shows volume reduction at 6- and 12-month follow-up in hypointense (teal columns, n = 33) and hyperintense (red columns, n = 38) fibroids. Volume reduction is expressed as a percentage of the initial volume of the treated fibroid. Above each column the fibroid volume change is shown, with the range in parentheses. a = P < .05 versus zero, b = P < .05 versus hypointense fibroids at the same time, MRgFUS = MR-guided focused ultrasound surgery.
At 6-month follow-up, the SSS of the patient groups with hypointense and hyperintense fibroids had decreased by 29.5 points ± 19.0 (45.4% ± 28.4) and 27.7 points ± 17.4 (45.9% ± 25.7), respectively (P < .01). At 12-month follow-up, the SSS of both patient groups again showed decreases of 24.8 points ± 16.4 (38.5% ± 26.7) and 23.5 points ± 19.6 (38.0% ± 30.0), respectively (P < .01).
Effect of NPV
Fibroid volume reduction at 12-month follow-up was significantly correlated to the percentage of the fibroid that was nonperfused immediately after MR imaging–guided focused ultrasound surgery (r = 0.27, P = .014) (Fig 4). When NPV was equal to 0%, the y-intercept was not different from zero (P = .92), meaning there was no change in fibroid volume. When the NPV was correlated with the changes in SSS, the correlation was close to significant at 12-month follow-up (P = .071). We also assessed the data to identify an NPV value to dichotomize the fibroids: Among the numerous NPV cutoff values tested, we found that a threshold of 20% revealed the most significant differences in both fibroid volume and SSS changes (P = .023 and .009, respectively). Fibroids with an NPV of at least 20% showed a volume reduction of 17.0% ± 13.0, while fibroids with an NPV less than 20% showed a volume reduction of 10.7% ± 18.2.
Figure 4:

Graph shows relationship between NPV immediately after MR-guided focused ultrasound surgery and volume changes of treated fibroid at 12-month follow-up. Fibroid volume change = −2.7 − 0.50 × NPV.
Regarding 12-month volume reduction, both SI and NPV had an independent effect (P = .028 and .033, respectively) (Table 2). In fibroids with NPV less than 20%, hypointense fibroids showed a volume reduction of 13.2% ± 21.3 (mean, −37 cm3 ± 70; range, −282 to 260 cm3) (P < .05), while hyperintense fibroids remained unchanged (mean, 11 cm3 ± 88; range, −206 to 236 cm3). In fibroids with NPV of at least 20%, hypointense fibroids showed a volume reduction of 24.3% ± 16.4 (mean, −70 cm3 ± 92; range, −334 to 336 cm3) (P < .05), while hyperintense fibroids showed a volume reduction of 12.8% ± 19.6 (mean, −20 cm3 ± 41; range, −85 to 70 cm3) (P = .05). Regarding change in SSS, NPV (P = .032) had a significant relationship and SI did not (P = .866) (Fig 5).
Table 2.
Treatment Data for Fibroid Groups Formed on the Basis of NPV and SI

Note.—Unless otherwise noted, data are mean ± standard deviation.
P < .05 vs hypointense fibroids within the same NPV group.
P < .05 vs NPV <20% with the same signal intensity.
Figure 5:

Graph shows volume (teal columns) and SSS (red columns) reduction at 12-month follow-up in four fibroid groups formed on the basis of NPV and SI immediately after MR-guided focused ultrasound surgery. b = P < .05 versus hypointense fibroids within the same NPV group.
DISCUSSION
To our knowledge, these results are the first to demonstrate that pretreatment fibroid SI and the NPV immediately after MR imaging–guided focused ultrasound surgery both independently predict fibroid volume reduction at 12-month follow-up. Hypointense fibroids on pretreatment T2-weighted MR images and fibroids with a larger NPV immediately after treatment are predictors of the success of MR-guided focused ultrasound surgery therapy.
In our study, MR-guided focused ultrasound surgery of uterine leiomyomas resulted in modest (about 11%) volume and considerable (about 26 points) SSS reduction at 6- and 12-month follow-up. This finding is in line with the results of Hindley et al (3), which were a 13.5% fibroid volume reduction and a 27.3 point reduction in SSS at 6-month follow-up. Somewhat larger changes were reported in another study (16): Fibroid volume decreased by 21% at 6-month and by 37% at 12-month follow-up, while symptom severity was reduced by 45% at 6-month and 48% at 12-month follow-up. In this latter study, however, patients received a gonadotropin-releasing-hormone–agonist before sonication, which may have facilitated leiomyoma volume reduction by creating a temporary hypoestrogenic state.
The volume of hyperintense fibroids and fibroids with an NPV less than 20% showed no decrease in the year following sonication. However, even in these patients fibroid-related symptoms decreased by 20%–25%. The explanation for this phenomenon is unknown, but it is clear that it is not only the absolute fibroid volume that determines the severity of patients' symptoms. There are other factors (eg, fibroid vascularity, intratumoral pressure, density of the lesion, hormone levels) that may contribute to the symptom severity and that could be altered by sonication. Increased tolerance over time and the placebo effect are also potential reasons for this phenomenon. This pattern of symptom reduction greater than the magnitude of volume reduction has also been seen following embolization of leiomyomas (17).
The extent of change in fibroid volume (range, −52.8% to 22.4%) varied substantially among the patients at 12-month follow-up. We found that this variation in the treatment efficacy could be partly predicted by fibroid SI as seen on pretreatment T2-weighted MR images: Low fibroid SI was predictive of a good response to MR-guided focused ultrasound surgery. It has previously been established that low or hypointense SI on T2-weighted MR images reflects low cellularity and/or vascularity (18), while high SI represents vascularization, fluid-rich tissues, or degeneration (19). In hyperintense fibroids, it is difficult to obtain adequate temperature elevation with sonication because high perfusion decreases heat accumulation through the vascular cooling effect (20). Although we did not systematically investigate this issue, our impression was that these fibroids were often more heterogeneous on T2-weighted MR images. It would be interesting in future work to systematically test whether such heterogeneity on anatomic images is correlated with a more variable temperature elevation. These observations might explain why a higher number of and higher power for sonications were necessary for hyperintense fibroids to reach the same NPV in our study. This finding is in line with a recent observation (9) and extends it by demonstrating that, even if the NPV is equal in a hypointense fibroid and in a hyperintense fibroid, the volume reduction is greater in the former. The exact cause of this finding is unknown but might be explained by the higher proliferative activity and growth rate of hyperintense fibroids (21).
The NPV immediately after MR-guided focused ultrasound surgery was a determinant of both volume and symptom reduction, and this finding suggests that there is a strong link between the success of therapy and devascularization and/or necrosis, as has been suggested in uterine fibroid embolization (22). Therefore, we believe that an important goal of this procedure is to treat as large a volume as safely possible. However, in previous clinical trials and also in our study, the sonicated volume of the fibroid was limited by treatment guidelines defined on the basis of consultation with the Food and Drug Administration (5). Originally, the maximum treatment volume of a fibroid was 100 cm3 and was limited to 33% of the total fibroid volume, the total in-bore time was limited to 3 hours, and a second treatment was not allowed. These guidelines have since been relaxed by the Food and Drug Administration, but the majority of our patients were treated under the more restrictive guidelines. Recently, Fennessy et al (5) reported significantly greater symptom score reduction in patients treated with the use of the modified treatment guidelines compared with those treated with the use of the more restrictive guidelines. This difference can be explained by the larger NPV with the use of modified guidelines, and, as proposed by Fennessy et al, there may also be factors (eg, experience, familiarity with the device, better patient preparation and education) that play a role in better outcome in those treated at a later date. Note that since these relaxed guidelines only served to increase the targetable fibroid regions and were not inherently biased toward any of the predictors we tested, we assume that it did not influence our outcome.
The ExAblate 2000 system was upgraded after the treatments described in our study, with new features that can greatly reduce treatment time. These improvements include reducing the intersonication cooling time for sonications that are a large distance apart and enlarged focal regions through enhanced beam steering during sonication. The use of inertial cavitation, or “enhanced sonications,” to increase the lesion volume per sonication is also being studied and may be available for future treatments (23). We believe that these changes in technique and protocol will help to produce larger NPVs and therefore reliably achieve greater extent of volume shrinkage and consequent symptom relief in the future. With such improvement, and perhaps a relaxation of the maximum treatment time guidelines, a larger population of patients with fibroids, including those hyperintense on T2-weighted MR images, may be able to be effectively treated.
An important limitation of this retrospective study was the small number of patients evaluated at 12 months and the reporting of predictors of fibroid volume reduction and symptom relief on the basis of data in the evaluable population. More than half of the patients who left the study were seeking alternative treatment, and we might presume that these patients had neutral or actual worsening of symptoms, though we do not have data to determine this accurately. Therefore, the overall volume reduction and symptom relief at 12 months would probably be smaller if all treated patients had been evaluated.
In summary, careful patient selection and use of pretreatment imaging are important components for predicting the success of MR-guided focused ultrasound surgery of uterine leiomyomas, and our findings may help to establish criteria for patient selection and for predicting outcomes in future MR-guided focused ultrasound surgery treatments.
ADVANCES IN KNOWLEDGE
The signal intensity of fibroids on pretreatment T2-weighted MR images can be used to predict treatment response; diffuse hypointensity relative to skeletal muscle is a predictor for volume reduction after MR-guided focused ultrasound surgery.
The larger the nonperfused volume (NPV) is immediately after treatment, the greater the leiomyoma volume reduction is at 12-month follow-up.
IMPLICATIONS FOR PATIENT CARE
Patients with hypointense fibroids on pretreatment T2-weighted MR images have more successful results with MR-guided focused ultrasound surgery treatment than do patients with hyperintense fibroids.
The NPV immediately after MR-guided focused ultrasound surgery is useful in predicting patient outcome.
Abbreviations
NPV = nonperfused volume
SI = signal intensity
SSS = symptom severity score
Author contributions: Guarantors of integrity of entire study, N.J.M., F.A.J., C.M.C.T.; study concepts/study design or data acquisition or data analysis/interpretation, all authors; manuscript drafting or manuscript revision for important intellectual content, all authors; approval of final version of submitted manuscript, all authors; literature research, Z.M.L., F.A.J., K.H.; clinical studies, Z.M.L., N.J.M., F.M.F., E.A.S., K.H., C.M.C.T.; statistical analysis, Z.M.L.; and manuscript editing, all authors
See Materials and Methods for pertinent disclosures.
Funding: This research supported by the National Institutes of Health (grants U41 RR019703, P01CA067165).
References
- 1.Tempany CM, Stewart EA, McDannold N, Quade BJ, Jolesz FA, Hynynen K. MR imaging–guided focused ultrasound surgery of uterine leiomyomas: a feasibility study. Radiology 2003;226(3):897–905. [DOI] [PubMed] [Google Scholar]
- 2.Stewart EA, Gedroyc WMW, Tempany CM, et al. Focused ultrasound treatment of uterine fibroid tumors: safety and feasibility of a noninvasive thermoablative technique. Am J Obstet Gynecol 2003;189(1):48–54. [DOI] [PubMed] [Google Scholar]
- 3.Hindley J, Gedroyc WM, Regan L, et al. MRI-guidance of focused ultrasound therapy of uterine fibroids: early results. AJR Am J Roentgenol 2004;183(6):1713–1719. [DOI] [PubMed] [Google Scholar]
- 4.Stewart EA, Rabinovici J, Tempany CM, et al. Clinical outcomes of focused ultrasound surgery for the treatment of uterine fibroids. Fertil Steril 2006;85(1):22–29. [DOI] [PubMed] [Google Scholar]
- 5.Fennessy FM, Tempany CM, McDannold NJ, et al. Uterine leiomyomas: MR imaging–guided focused ultrasound surgery—results of different treatment protocols. Radiology 2007;243(3):885–893. [DOI] [PubMed] [Google Scholar]
- 6.Leslie TA, Kennedy JE. High intensity focused ultrasound in the treatment of abdominal and gynaecological diseases. Int J Hyperthermia 2007;23(2):173–182. [DOI] [PubMed] [Google Scholar]
- 7.Stewart EA, Gostout B, Rabinovici J, Kim HS, Regan L, Tempany CM. Sustained relief of leiomyoma symptoms by using focused ultrasound surgery. Obstet Gynecol 2007;110(2 pt 1):279–287. [DOI] [PubMed] [Google Scholar]
- 8.McDannold N, Tempany CM, Fennessy FM, et al. Uterine leiomyomas: MR imaging-based thermometry and thermal dosimetry during focused ultrasound thermal ablation. Radiology 2006;240(1):263–272. [DOI] [PMC free article] [PubMed] [Google Scholar]
- 9.Funaki K, Fukunishi H, Funaki T, Sawada K, Kaji Y, Maruo T. Magnetic resonance-guided focused ultrasound surgery for uterine fibroids: relationship between the therapeutic effects and signal intensity of preexisting T2-weighted magnetic resonance images. Am J Obstet Gynecol 2007;196(2):184.e1–184.e6. [DOI] [PubMed] [Google Scholar]
- 10.Ishihara Y, Calderon A, Watanabe H, Okamoto K, Suzuki Y, Kuroda K. A precise and fast temperature mapping using water proton chemical shift. Magn Reson Med 1995;34(6):814–823. [DOI] [PubMed] [Google Scholar]
- 11.Spies JB, Coyne K, Guaou N, Boyle D, Skyrnarz-Murphy K, Gonzalves SM. The UFS-QOL, a new disease-specific symptom and health-related quality of life questionnaire for leiomyomata. Obstet Gynecol 2002;99(2):290–300. [DOI] [PubMed] [Google Scholar]
- 12.Fiscella K, Eisinger SH, Meldrum S, Feng C, Fisher SG, Guzick DS. Effect of mifepristone for symptomatic leiomyomata on quality of life and uterine size. Obstet Gynecol 2006;108(6):1381–1387. [DOI] [PubMed] [Google Scholar]
- 13.Smith WJ, Upton E, Shuster EJ, Klein AJ, Schwartz ML. Patient satisfaction and disease specific quality of life after uterine artery embolization. Am J Obstet Gynecol 2004;190(6):1697–1703. [DOI] [PubMed] [Google Scholar]
- 14.Spies JB, Allison S, Flick P, et al. Polyvinyl alcohol particles and tris-acryl gelatin microspheres for uterine artery embolization for leiomyomas: results of a randomized comparative study. J Vasc Interv Radiol 2004;15(8):793–800. [DOI] [PubMed] [Google Scholar]
- 15.Burn PR, McCall JM, Chinn RJ, Vashisht A, Smith JR, Healy JC. Uterine fibroleiomyoma: MR imaging appearances before and after embolization of uterine arteries. Radiology 2000;214(3):729–734. [DOI] [PubMed] [Google Scholar]
- 16.Smart OC, Hindley JT, Regan L, Gedroyc WG. Gonadotropin-releasing hormone and magnetic resonance-guided ultrasound surgery for uterine leiomyomata. Obstet Gynecol 2006;108(1):49–54. [DOI] [PubMed] [Google Scholar]
- 17.deSouza NM, Williams AD. Uterine arterial embolization for leiomyomas: perfusion and volume changes at MR imaging and relation to clinical outcome. Radiology 2002;222(2):367–374. [DOI] [PubMed] [Google Scholar]
- 18.Yamashita Y, Torashima M, Takahashi M, et al. Hyperintense uterine leiomyoma at T2-weighted MR imaging: differentiation with dynamic enhanced MR imaging and clinical implications. Radiology 1993;189(3):721–725. [DOI] [PubMed] [Google Scholar]
- 19.Swe TT, Onitsuka H, Kawamoto K, et al. Uterine leiomyoma: correlation between signal intensity on magnetic resonance imaging and pathologic characteristics. Radiat Med 1992;10(6):235–242. [PubMed] [Google Scholar]
- 20.Huang J, Holt RG, Cleveland RO, Roy RA. Experimental validation of a tractable numerical model for focused ultrasound heating in flow-through tissue phantoms. J Acoust Soc Am 2004;116(4 pt 1):2451–2458. [DOI] [PubMed] [Google Scholar]
- 21.Oguchi O, Mori A, Kobayashi Y, et al. Prediction of histopathologic features and proliferative activity of uterine leiomyoma by magnetic resonance imaging prior to GnRH analogue therapy: correlation between T2-weighted images and effect of GnRH analogue. J Obstet Gynaecol 1995;21(2):107–117. [DOI] [PubMed] [Google Scholar]
- 22.Pelage JP, Guaou NG, Jha RC, Ascher SM, Spies JB. Uterine fibroid tumors: long-term MR imaging outcome after embolization. Radiology 2004;230(3):803–809. [DOI] [PubMed] [Google Scholar]
- 23.Holland GA, Hananel A, Briggs RW, Dick AB, Bruno R. Magnetic resonance guided focused ultrasound surgery (MR imaging–guided focused ultrasound surgery) with interleaved technique: initial experience for a more rapid treatment of uterine fibroids [abstr]. In: Proceedings of the 14th Meeting of the International Society for Magnetic Resonance in Medicine. Berkeley, Calif: International Society for Magnetic Resonance in Medicine, 2006;193.