Abstract
Purpose: To assess the diagnostic performance of various Doppler ultrasonographic (US) vascularity measures in conjunction with grayscale (GS) criteria in differentiating benign from malignant breast masses, by using histologic findings as the reference standard.
Materials and Methods: Institutional Review Board and HIPAA standards were followed. Seventy-eight women (average age, 49 years; range, 26–70 years) scheduled for breast biopsy were included. Thirty-eight patient scans were partially analyzed and published previously, and 40 additional scans were used as a test set to evaluate previously determined classification indexes. In each patient, a series of color Doppler images was acquired and reconstructed into a volume encompassing a suspicious mass, identified by a radiologist-defined ellipsoid, in which six Doppler vascularity measures were calculated. Radiologist GS ratings and patient age were also recorded. Multivariable discrimination indexes derived from the learning set were applied blindly to the test set. Overall performance was also confirmed by using a fourfold cross-validation scheme on the entire population.
Results: By using all cases (46 benign, 32 malignant), the area under the receiver operating characteristic curve (Az) values confirmed results of previous analyses: Speed-weighted pixel density (SWPD) performed the best as a diagnostic index, although statistical significance (P = .01) was demonstrated only with respect to the normalized power-weighted pixel density. In both learning and test sets, the three-variable index (SWPD-age-GS) displayed significantly better diagnostic performance (Az = 0.97) than did any single index or the one two-variable index (age-GS) that could be obtained without the data from the Doppler scan. Results of the cross validation confirmed the trends in the two data sets.
Conclusion: Quantitative Doppler US vascularity measurements considerably contribute to malignant breast tissue identification beyond subjective GS evaluation alone. The SWPD-age-GS index has high performance (Az = 0.97), regardless of incidental performance variations in its single variable components.
© RSNA, 2008
Characteristics of vasculature associated with malignant breast masses include thin-walled blood vessels, increased microvessel density, disordered neovascularization penetrating the mass, arteriovenous shunting, and a variety of characteristic Doppler ultrasonographic (US) and histologic findings (1–4). Throughout these investigations, there have been less than definitive conclusions as to whether or not Doppler measurements reflect microvasculature, and conclusions are mixed regarding the utility of Doppler US in enabling differentiation between benign and malignant breast lesions. There is, however, a general consensus that Doppler measures can be used in assessing overall tumor vascularity. Further, some studies strongly support the hypothesis that flow velocities correlate with tumor size (5) and that parameters such as vessel count and flow velocity reveal differences between malignant and benign lesions (6). Most of these studies, however, have used two-dimensional rather than three-dimensional (3D) images in assessing overall vascular morphology, density, and velocity distributions.
Previous investigations have assessed Doppler US for the discrimination of benign from malignant masses by using a variety of measures (eg, Doppler flow parameters, spectral analysis, mean and maximum flow velocities, peak systolic and end diastolic Doppler frequency shifts [7–9], other qualitative and quantitative measures [10–13]). For example, in a study with 210 patients by Cosgrove et al (14), vessels were detected in 98% of the malignant masses scanned, and average vascular density was lower in some fibroadenomas than in malignant masses. In the same study, 96% of the scans that were deemed to show “benign breast changes” (representing roughly half of the patient population) displayed no Doppler signal at all.
We have previously investigated the utility of 3D breast US imaging for enabling differentiation of benign versus malignant breast masses (15–18). We found that the Doppler vascularity measure speed-weighted pixel density (SWPD) is comparable in accuracy to US grayscale (GS) evaluation for distinguishing benign from malignant masses. Our more recent work (17), in a pool of 38 patients, with a new handheld 3D scanning technique and US scanner suggests that multivariable indexes (which include both SWPD and GS features) enable better discrimination of benign versus malignant breast masses than does GS evaluation alone. The purpose of our current study was to assess the diagnostic performance of various Doppler US vascularity measures in conjunction with GS criteria for enabling differentiation of benign from malignant breast masses, with histologic findings as the reference standard.
MATERIALS AND METHODS
Patient Group
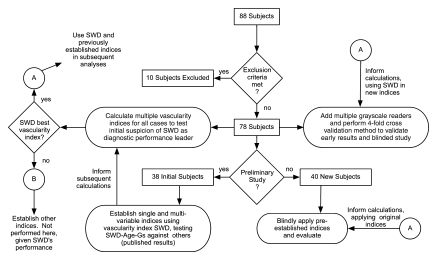
Eighty-eight women with palpable or mammographic abnormalities who were scheduled for excisional or core biopsy (August 1998–February 2000) were screened for inclusion in the study. Four patients who had undergone prior invasive procedures were excluded (two had undergone lumpectomy; one, core biopsy; and one, transverse rectus abdominus myocutaneous reconstruction). A US mass could not be localized for six patients, who were also excluded. In the remaining 78 women (average age, 49 years; range, 26–70 years), six vascularity indexes were evaluated. Thirty-eight patient scans had been previously analyzed (17) for individual vascularity indexes (learning set), and 40 new patient examinations provided a “test set” to evaluate combined indexes (described below) established by using the learning set. Institutional Review Board approval and written informed consent were obtained, and the study was Health Insurance Portability and Accountability Act compliant for all recruitment and research procedures. A flow diagram of the patient pool appears in Figure 1.
Figure 1:
Flow diagram of entire patient group. SWD = SWPD.
Data Acquisition
US evaluation was performed (N.J.T., 19 years US experience) with a GE Logiq 700 scanner (GE Medical Systems, Milwaukee, Wis) by using an M12 linear-matrix-array transducer (6-MHz Doppler setting, 9-MHz GS setting). In an effort to maximize Doppler signal, each patient's electrocardiogram was acquired by using a computer interface to a clinical electrocardiographic monitor and was used to trigger the footswitch of the scanner to capture images during systole. A handheld linear position–encoding apparatus interfaced to the same computer system was used to obtain parallel images and record image plane positions, which were nominally spaced 0.5 mm apart (18,19). The US scanner was set to display a region 3.8-cm wide by 4-cm deep, and 60–90 images were obtained over a length of approximately 3–4 cm, which encompassed the mass, for each of three scan sets: frequency-shift color Doppler imaging, power-mode color Doppler imaging, and GS. Image data were stored in the cine buffer of the scanner, saved to disk, and then transferred to a workstation (DEC Alpha; Digital Equipment, Maynard, Mass), where 3D image volumes were reconstructed from the two-dimensional image data and the recorded section positions.
Quantitative Measures
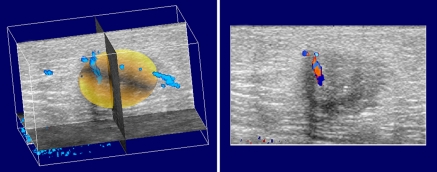
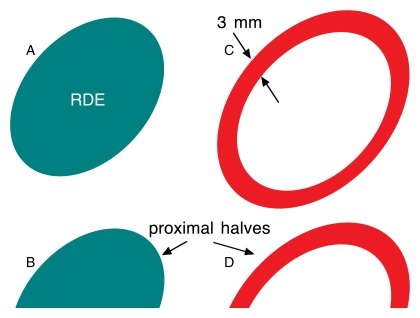
Each 3D volume was displayed as a series of three intersecting orthogonal planes by using data visualization software (AVS/Express; Advanced Visualization Systems, Waltham, Mass) (Fig 2). A radiologist (M.A.R., 13 years experience) reviewed the sections to determine the margins of the mass, using the high-resolution GS volume as necessary, and was instructed to estimate the volume of the mass by selecting an ellipsoid region of interest as consistently as possible. Within each overall reconstructed color Doppler imaging volume, the radiologist dynamically positioned and shaped an ellipsoidal volume, which served to approximate the borders of the mass and delineate it from the surrounding tissue (Fig 2). The ellipsoid included the farthest extent of the margin of each lesion in any plane, including all edges of irregular shapes and the visible edges of all spiculations or margins. By using this radiologist-defined ellipsoid, four regions were designated in which vascularity was measured. These regions were: region 0, the upper (proximal) half of the radiologist-defined ellipsoid; region 1, the upper (proximal) half of the 3-mm shell; region 2, the lower (distal) half of the radiologist-defined ellipsoid; and region 3, the lower (distal) half of the 3-mm shell (Fig 3).
Figure 2:
Three-dimensional color Doppler scan volume with region of interest selected in a 57-year-old woman with invasive ductal carcinoma in left breast. Each section (right) represents an original image in the z-plane. Approximately 90 of these are stacked to form the overall 3D reconstructed volume. A yellow 3D surface delineating the volume for calculation of tumor vascularity is shown at left, along with vascularity in 3D space (blue).
Figure 3:
Schematic of z-plane cross sections of vascularity quantification regions: A, Complete radiologist-defined ellipsoid (RDE; regions 0 and 2). B, Upper (proximal) half of radiologist-defined ellipsoid (region 0). C, 3-mm shell surrounding radiologist-defined ellipsoid (regions 1 and 3). D, Upper half of 3-mm shell (region 1).
Within each of the four regions, the vascularity information was quantified by six Doppler measures: (a) frequency-shift color pixel density (PD), which is the number of colored pixels in the frequency-shift color Doppler imaging volume of interest normalized by the total number of pixels in the region; (b) average velocity, which is the average velocity calculated from all colored pixels in the frequency-shift color Doppler imaging regions of interest (as determined by the frequency-shift color Doppler imaging color map); (c) SWPD, which is the product of frequency-shift color PD and the average velocity; (d) power-mode color PD, which is the power-mode equivalent of frequency-shift color PD; (e) normalized power-weighted PD, which is the sum of each color pixel weighted by its power (as determined by the power-mode color Doppler imaging color map) and normalized to the power representing 100% blood, as described by Rubin et al in 1997 (20); and (f) the product of the average velocity and normalized power-weighted PD. In calculating absolute velocities, the distribution of flow directions was assumed to be isotropic. Previously published results (17) of the initial 38 breast mass scans included only SWPD measures. Two indexes for each measure in each case were obtained by calculating the maximum value (among four regions) in two ways: method 1 delineated proximal regions by calculating a maximum value among regions 0, 0 and 2, 1, and 1 and 3, and method 2 calculated the maximum value of each index among regions 0, 1, 2, and 3.
GS characteristics of the mass were based on those used by other investigators (21) (margin smoothness, margin visibility, shape, height, echogenicity, attenuation, homogeneity, and overall suspicion) and were each ranked independently by three radiologists (M.A.R., C.P., K.A.H., with 13, 28, and 6 years experience, respectively) on a scale of one to five (low to high suspicion for malignancy), as shown in Table 1. These measures were used to produce three GS ratings for each case for each reader: the average of all GS measures, the average GS value excluding overall suspicion score, and the overall suspicion score alone. Readers were blinded to histologic and mammographic results.
Table 1.
GS Characteristic Scale
Note.—Ratings spanned 5 to 1, most suspicious to least suspicious for malignancy.
Height is orientation of the mass in the anteroposterior plane.
Statistical Analysis and Reference Standard
By using histologic findings as the reference standard, receiver operating characteristic (ROC) curve analyses were initially applied to all Doppler measures and GS ratings for the 78 cases. These analyses employed ROC software (ROCKIT, version 0.9; C. E. Metz, http://xray.bsd.uchicago.edu/krl/), which calculates maximum likelihood estimates for binormal models of the input indexes. Statistical differences between diagnostic performances of relevant pairs of indexes were determined by using a univariate z-score test of the difference between the areas under any given two ROC curves (Azs). Examples of relevant pair comparisons include: (a) maximum value indexes calculated with methods 1 and 2, (b) weighted versus unweighted Doppler indexes, (c) frequency-shift versus power Doppler indexes, and (d) any given combined index (described below) with and without the inclusion of Doppler information. Other t test comparisons (described below) were performed by using statistical software (JMP, version 5; SAS Institute, Cary, NC), and P values less than or equal to .05 were considered to indicate a significant difference.
In our previously published analysis (17), SWPD, age, and GS data were initially assessed with a bayesian discriminator (22,23) that was applied to each possible pair of variables to produce the combined indexes SWPD-age, SWPD-GS, and age-GS. The three-variable index SWPD-age-GS was also calculated from a bayesian discriminator in three dimensions. For all of these calculations, the logarithm of SWPDmax (hereafter referred to simply as SWPD) was used to reduce the range of the variable and avoid dominance by a few cases in the determination of discriminant classifiers. These same classifiers were blindly applied to the test set of 40 scans, with the same conditions as the learning set, and ROC analysis was again performed.
Reader bias in GS ratings was evaluated before applying the fourfold cross-validation test described below. Pair-wise comparisons (t tests with Bonferroni adjustment for multiple comparisons) were performed to detect statistically significant differences among GS calculation methods and reader ratings in terms of both absolute value and diagnostic performance as described by ROC curves (Az comparisons).
Finally, the 78 cases were divided randomly into four subgroups (A, B, C, and D) for a fourfold cross-validation test of the indexes. In this analysis, three subgroups (eg, A, B, and C) are used to determine multivariable classifiers and are compared with the fourth subgroup, D. The four possible sets were evaluated by using the aforementioned ROC analysis. Mean Az values for the four sets were compared with the learning and test sets.
RESULTS
Vascularity Measures
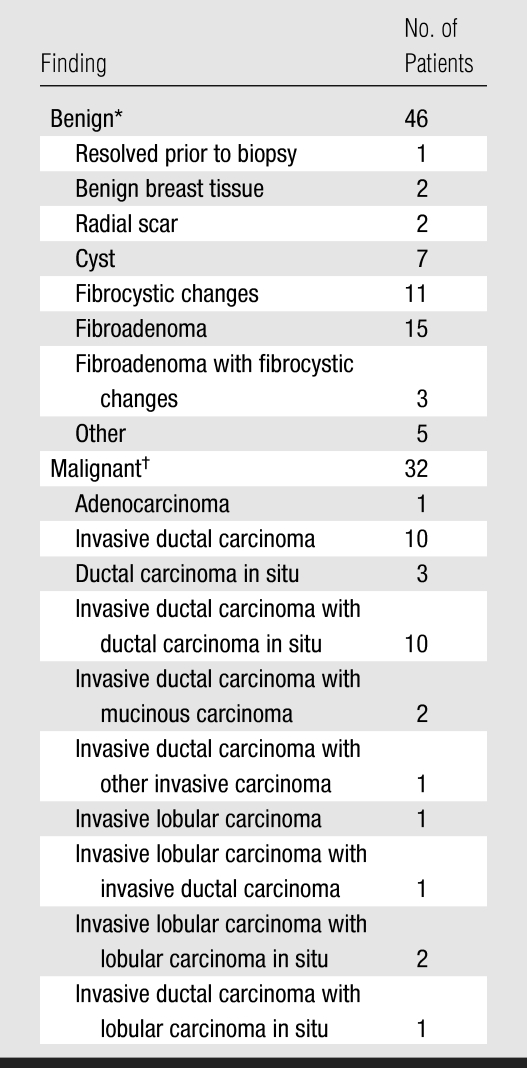
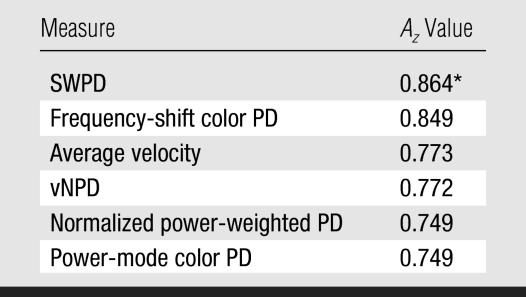
All 78 patients underwent core or excisional biopsy, and the histologic results are presented in Table 2. Minor differences in the magnitudes of Az were calculated for the different methods of computing the maximum values among the four regions; however, there were no significant differences for a given method of computing the index. The performances of SWPD and frequency-shift color PD (SWPD's unweighted equivalent) were statistically equivalent and had the highest Az values (Table 3). SWPD exhibited significantly better diagnostic performance (P = .01) than its power-weighted Doppler equivalent (normalized power-weighted PD) by using both method 1 (Az, 0.86 vs 0.75) and method 2 (Az, 0.85 vs 0.75). As such, further analyses were limited to the method 1 calculations, as was done in our previous study (17). No other relevant pairs (as described in Materials and Methods) displayed a statistically significant difference.
Table 2.
Pathologic Distribution of the US Visible Masses
In benign masses, average equivalent diameter (diameter of sphere whose volume is equivalent to estimated volume of the mass) was 1.0 cm. Patients with benign masses had an average age of 49 years (range, 26–70 years).
In malignant masses, average equivalent diameter was 1.5 cm. Patients with benign masses had an average age of 56 years (range, 36–87 years).
Table 3.
Diagnostic Performance of Doppler Vascularity Measures in 78 Patients by Using Method 1
Note.—vNPD = product of normalized power-weighted PD and average velocity.
SWPD demonstrated better performance than normalized power-weighted PD (P = .01).
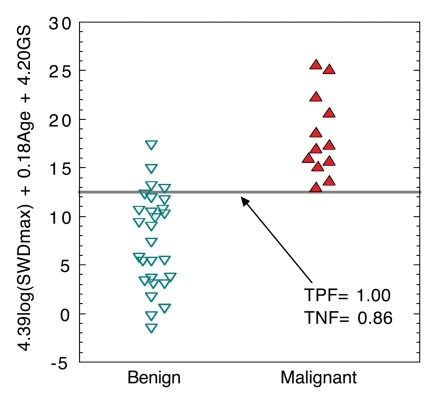
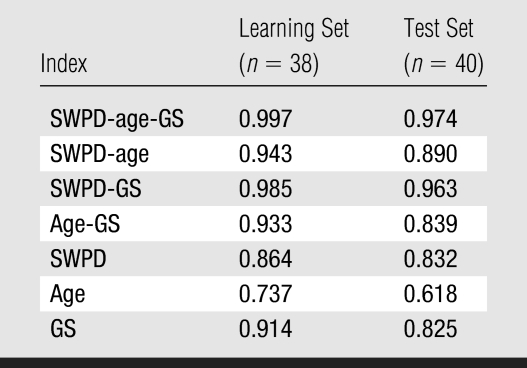
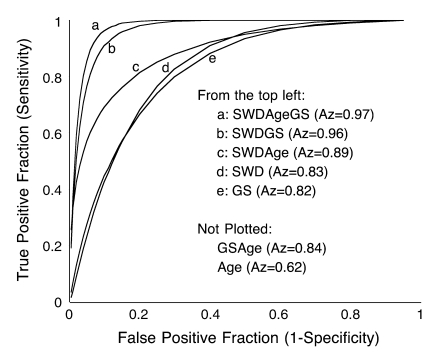
A comparison (Fig 4) of the three-variable index for benign versus malignant cases for the 40-patient test set showed that setting the SWPD-age-GS index discrimination threshold to its maximum value yields 100% sensitivity and 86% specificity. If the threshold is set to a conservative value of half of the maximum, 13 of 28 (46%) of the masses are still correctly identified as benign when the originally determined index is blindly applied to the test set. Diagnostic performance (Table 4) of the multivariable indexes in both the 38-patient learning set and 40-patient test set (in which classifiers were blindly applied), as measured with Az, showed that performance was similar in the test set compared with the learning set. Index performance improvement occurred with the addition of vascularity information (SWPD) (Table 5). The pairs of indexes that display statistically significant differences are identical for the learning and test sets. In both population samples, the three-variable index (SWPD-age-GS) displayed significantly better diagnostic performance (Az = 0.97) than any single index or the one two-variable index (age-GS) that could be obtained without the Doppler scan. Further, the addition of SWPD improved the performance of GS ratings alone in both populations (Fig 5).
Figure 4:
Scatterplot of three-variable index (SWPD-age-GS) applied to test set (n = 40). The linear combination of these three variables (4.39 · log[SWPDmax] + 0.18 · age + 4.2 · GS) was determined as best three-variable classifier for the learning set (n = 38) and was then blindly applied to test set. Points have been slightly spread horizontally for ease of visualization. Gray line = threshold for 0% false-negatives, SWD = SWPD, TNF = true negative fraction, TPF = true positive fraction.
Table 4.
Diagnostic Performance of Indexes in the Learning and Test Sets
Note.—Data are Az values. Original single reader scoring is presented.
Table 5.
Statistical Significance of Az Comparisons between Indexes
Figure 5:
Performance of discrimination indexes derived from the test set (n = 40), as demonstrated by maximum likelihood binormal estimates of ROC curves. SWPD, GS, and patient age were blindly applied to multivariable classifiers derived from the learning set (n = 38). The high performance (Az = 0.97) of the SWPD-age-GS index exceeded all other indexes and demonstrated significant improvement over all single variable indexes. SWD = SWPD.
GS and Cross-Validation Evaluation
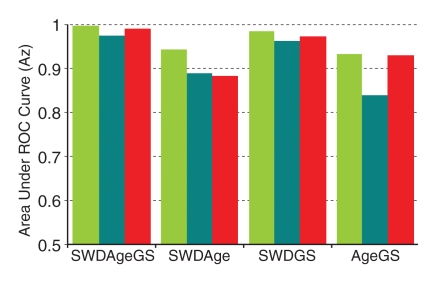
For the fourfold cross-validation scheme involving all 78 patients, GS evaluations by three readers contributed to the overall indexes. On the basis of average GS rating, there was an apparent difference in performance between readers 1 and 2 (Az, 0.88 vs 0.95); however, this difference was not statistically significant. In fact, variations among readers' diagnostic performance and their absolute ratings, and among the different GS indexes exhibited no statistically significant differences. Given these results, the GS measure averaged over all readers was not significantly different from the overall suspicion score alone or the average GS value excluding overall suspicion score, and it was used as the GS index in the cross validation.
In the cross validation, three subgroups were used to determine linear multivariable classifiers (by using a bayesian discrimination scheme), and the coefficients were then applied to their corresponding fourth subgroup (Table 6). The average performance assessed by using the fourfold cross validation fell between that of the learning set (in which the classifier was learned and tested on itself) and that of the test set (in which the previously determined classifier was applied blindly to an independent set) (Fig 6).
Table 6.
Cross Validation of Discrimination Indices
Note.—Data are Az values.
Figure 6:
Bar graph of average performance (as assessed by average Az values) of discrimination indexes in learning set (green), test set (teal), and all 78 subjects by using the fourfold cross-validation method (red). Overall performance of the SWPD-age-GS index (Az = 0.992) fell between the learning set (Az = 0.997) and the test set (Az = 0.974). SWD = SWPD.
DISCUSSION
Recent results by other researchers (24), particularly those involving 3D scans, promise greater accuracy due to more consistent sampling over the entire tumor (15,17) and substantiate the idea that certain Doppler indexes may be useful in the evaluation of US-detectable breast masses.
This study confirms our previous observation (15) that the SWPD index has the best diagnostic performance among our single vascularity measures, as indicated by Az. This may be because the speed-weighted characteristic of SWPD emphasizes high flow speeds, which may exemplify the low resistance flow often associated with the vascular morphology of malignant masses. It may also be the case that the wall filter of the US scanner we used performs a function similar to speed weighting itself. That is, the only vessels detected are those with flow speeds that correspond to frequency shifts exceeding the wall filter. Thus, higher flow velocities in the tumor-feeding arterioles may be detected, whereas vessels with slower flow velocities (surrounding benign masses) may go unidentified. This theory is supported by the fact that the performance of frequency-shift color PD (the unweighted equivalent of SWPD) was statistically indistinguishable from SWPD.
The different methods of calculating the “maximum” of each Doppler measure proved to be inconsequential but were included in the present study to confirm and compare with our previous analyses. It had been thought that since shadowing by the mass is highly variable, the proximal region might be more indicative of the vascularity associated with the mass. This was not demonstrated, but future work might include an analysis of vascularity as a function of various spatial relationships, such as distance from the mass center or outer border.
There are some limitations to our study. For example, only one reader drew the regions of interest that were used in all cases. Given the overall size of the regions of interest and the type of Doppler indexes calculated, we would expect the “user impact” to be minimal. As for a particular reader's ability to assess GS characteristics, some will rank very highly and achieve high diagnostic accuracy. It is difficult to assess how such readers' performances might be improved by the current scheme without large numbers of patients. Nonetheless, none of our readers achieved the diagnostic accuracy of the final derived three-variable index.
Performance was similar between the 38-patient learning set and the 40-patient test set for all single and multivariable indexes. It was, nonetheless, slightly lower in each case for the test set, as expected, since any model tested on itself performs better than on subsequent populations. Still, the trend of the single and multivariable indexes was identical for all three analysis groups: the learning set, the test set, and the average of the fourfold cross-validation results for all 78 patients. As such, it appears that the results in the learning set do not reflect a mere bias of a test index determined and applied to the same population.
Of particular note is the consistently high performance of the three-variable index (SWPD-age-GS) regardless of the performance of the individual indexes. For example, the three single variables performed worse in the test set than in the learning set (SWPD: Az, 0.83 vs 0.86; age: Az, 0.74 vs 0.62; GS ratings: Az, 0.82 vs 0.91). Although these single variable results are incidental, they suggest that the SWPD-age-GS index is particularly robust, displaying an Az value of 0.97 in the test set. That is, when applied to a test set, a multivariable discriminator is expected to perform better than any subset of the variables; however, once the coefficients are set by analysis of the learning set, the multivariable discriminator has no inherent advantage over any single or subset of variables unless all variables are contributing some independent information. Our results suggest that SWPD contributes significant independent information. The overall performance of the multivariable indexes remained consistent, particularly for the SWPD-age-GS index, which continues to display promising results.
ADVANCES IN KNOWLEDGE
Speed-weighted Doppler flow measurement in conjunction with patient age information and US grayscale information (a three-variable index), has consistently high performance in differentiating benign from malignant breast masses (area under the receiver operating characteristic curve, 0.97).
Flow velocity–weighted color Doppler pixel measurements appear to be the most effective for mass characterization as compared with Doppler power measurements and mean velocities.
IMPLICATION FOR PATIENT CARE
The enhanced diagnostic performance of three-dimensional Doppler-based multivariable indexes over grayscale US evaluation alone may eventually lead to the elimination of some biopsies.
Abbreviations
Az = area under ROC curve
GS = gray scale
PD = pixel density
ROC = receiver operating characteristic
SWPD = speed-weighted PD
3D = three-dimensional
Author contributions: Guarantors of integrity of entire study, G.L.L., P.L.C.; study concepts/study design or data acquisition or data analysis/interpretation, all authors; manuscript drafting or manuscript revision for important intellectual content, all authors; approval of final version of submitted manuscript, all authors; literature research, G.L.L.; clinical studies, G.L.L., M.A.R., J.B.F., J.F.K., K.A.H., C.P., N.J.T., K.D.E.; statistical analysis, G.L.L., T.D.J., P.L.C.; and manuscript editing, G.L.L., M.A.R., J.B.F., K.A.H., C.P., T.D.J., N.J.T., P.L.C.
Authors stated no financial relationship to disclose.
Funding: This research was funded by the National Cancer Institute (grants R01CA55076, R01CA091713, P01CA87634).
References
- 1.Lee WJ, Chu JS, Huang CS, Chang MF, Chang KJ, Chen KM. Breast cancer vascularity: color Doppler sonography and histopathology study. Breast Cancer Res Treat 1996;37:291–298. [DOI] [PubMed] [Google Scholar]
- 2.Folkman J, Shing J. Angiogenesis. J Biol Chem 1992;267:10931–10934. [PubMed] [Google Scholar]
- 3.Peters-Engl C, Medl M, Leodolter S. The use of colour-coded and spectral Doppler ultrasound in the differentiation of benign and malignant breast lesions. Br J Cancer 1995;71:137–139. [DOI] [PMC free article] [PubMed] [Google Scholar]
- 4.Buadu LD, Murakami J, Murayama S, et al. Colour Doppler sonography of breast masses: a multiparameter analysis. Clin Radiol 1997;52:917–923. [DOI] [PubMed] [Google Scholar]
- 5.Peters-Engl C, Medl M, Mirau M, et al. Color-coded and spectral Doppler flow in breast carcinomas: relationship with the tumor microvasculature. Breast Cancer Res Treat 1998;47:83–89. [DOI] [PubMed] [Google Scholar]
- 6.Madjar H, Prompeler HJ, Sauerbrei W, Wolfarth R, Pfleiderer A. Color Doppler flow criteria of breast lesions. Ultrasound Med Biol 1994;20:849–858. [DOI] [PubMed] [Google Scholar]
- 7.Minasian H, Bamber J. A preliminary assessment of an ultrasonic Doppler method for the study of blood flow in human breast cancer. Ultrasound Med Biol 1982;8:357–364. [DOI] [PubMed] [Google Scholar]
- 8.Kedar RP, Cosgrove DO, Bamber JC, Bell DS. Automated quantification of color Doppler signals: a preliminary study in breast tumors. Radiology 1995;197:39–43. [DOI] [PubMed] [Google Scholar]
- 9.Lee WJ, Chu JS, Chung MF, Chen KM. The use of color Doppler in the diagnosis of occult breast cancer. J Clin Ultrasound 1995;23:192–194. [DOI] [PubMed] [Google Scholar]
- 10.Lee SK, Lee T, Lee KR, Su YG, Liu TJ. Evaluation of breast tumors with color Doppler imaging: a comparison with image-directed Doppler ultrasound. J Clin Ultrasound 1995;23:367–373. [DOI] [PubMed] [Google Scholar]
- 11.Bell DS, Bamber JC, Eckersley RJ. Segmentation and analysis of colour Doppler images of tumour vasculature. Ultrasound Med Biol 1995;21:635–647. [DOI] [PubMed] [Google Scholar]
- 12.Huber S, Delorme S, Knopp MV, et al. Breast tumors: computer-assisted quantitative assessment with color Doppler US. Radiology 1994;192:797–801. [DOI] [PubMed] [Google Scholar]
- 13.Fein M, Delorme S, Weisser G, Zuna I, van Kaick G. Quantification of color Doppler for the evaluation of tissue vascularization. Ultrasound Med Biol 1995;21:1013–1019. [DOI] [PubMed] [Google Scholar]
- 14.Cosgrove DO, Kedar RP, Bamber JC, et al. Breast disease: color Doppler US in differential diagnosis. Radiology 1993;189:99–104. [DOI] [PubMed] [Google Scholar]
- 15.Carson PL, Fowlkes JB, Roubidoux MA, et al. 3-D color Doppler image quantification of breast masses. Ultrasound Med Biol 1998;24:945–952. [DOI] [PubMed] [Google Scholar]
- 16.Carson PL, Moskalik AP, Govil A, et al. The 3D and 2D color flow display of breast masses. Ultrasound Med Biol 1997;23:837–849. [DOI] [PubMed] [Google Scholar]
- 17.Bhatti PT, LeCarpentier GL, Roubidoux MA, Fowlkes JB, Helvie MA, Carson PL. Discrimination of sonographic breast masses using frequency shift color Doppler imaging in combination with age and gray scale criteria. J Ultrasound Med 2001;20:343–350. [DOI] [PubMed] [Google Scholar]
- 18.LeCarpentier GL, Tridandapani PB, Fowlkes JB, Roubidoux MA, Moskalik AP, Carson PL. Utility of three-dimensional US in the discrimination and detection of breast cancer. RSNA EJ 1999;3. http://ej.rsna.org/ej3/0103-99.fin/titlepage.html. Published October 22, 1999.
- 19.Fenn RC, Fowlkes JB, Moskalik AP, Zhang Y, Roubidoux MA, Carson PL. A hand-controlled, 3-D ultrasound guide and measurement system. In: Proceedings of acoustical imaging. New York, NY: Plenum, 1997; 237–242.
- 20.Rubin JM, Bude RO, Fowlkes JB, Spratt RS, Carson PL, Adler RS. Normalizing fractional moving blood volume estimates with power Doppler US: defining a stable intravascular point with the cumulative power distribution function. Radiology 1997;205:757–765. [DOI] [PubMed] [Google Scholar]
- 21.Stavros AT, Thickman DI, Rapp CL, Dennis MA, Parker SH, Sisney GA. Solid breast nodules: use of sonography to distinguish between benign and malignant lesions. Radiology 1995;196:123–134. [DOI] [PubMed] [Google Scholar]
- 22.Afifi AA, Azen SP. Statistical analysis: a computer aided approach. 2nd ed. New York, NY: Academic Press, 1979; 291–295.
- 23.Fukunaga K. Introduction to statistical pattern recognition. 2nd ed. San Diego, Calif: Academic Press, 1990; 129–131.
- 24.Ozdemir A, Ozdemir H, Maral I, Konus O, Yucel S, Isik S. Differential diagnosis of solid breast lesions: contribution of Doppler studies to mammography and gray scale imaging. J Ultrasound Med 2001;20:1091–1101. [DOI] [PubMed] [Google Scholar]


