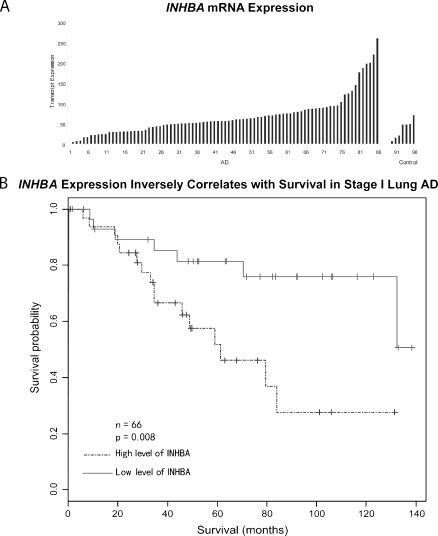
Figure 1.
(A) Affymetrix oligonucleotide microarray analysis of 86 lung AD (AD) and 10 nontumor control specimens demonstrated at least a two-fold increase in expression in 61 (70.9%) of 86 and a four-fold increase in expression in 17 (19.7%) of 86 lung AD relative to controls. The x-axis represents tumor identifier. (B) Kaplan-Meier survival analysis of 66 stage I lung AD demonstrated reduced survival in patients with high INHBA expression.

