

Abstract
Oceanic phages are critical components of the global ecosystem, where they play a role in microbial mortality and evolution. Our understanding of phage diversity is greatly limited by the lack of useful genetic diversity measures. Previous studies, focusing on myophages that infect the marine cyanobacterium Synechococcus, have used the coliphage T4 portal-protein-encoding homologue, gene 20 (g20), as a diversity marker. These studies revealed 10 sequence clusters, 9 oceanic and 1 freshwater, where only 3 contained cultured representatives. We sequenced g20 from 38 marine myophages isolated using a diversity of Synechococcus and Prochlorococcus hosts to see if any would fall into the clusters that lacked cultured representatives. On the contrary, all fell into the three clusters that already contained sequences from cultured phages. Further, there was no obvious relationship between host of isolation, or host range, and g20 sequence similarity. We next expanded our analyses to all available g20 sequences (769 sequences), which include PCR amplicons from wild uncultured phages, non-PCR amplified sequences identified in the Global Ocean Survey (GOS) metagenomic database, as well as sequences from cultured phages, to evaluate the relationship between g20 sequence clusters and habitat features from which the phage sequences were isolated. Even in this meta-data set, very few sequences fell into the sequence clusters without cultured representatives, suggesting that the latter are very rare, or sequencing artefacts. In contrast, sequences most similar to the culture-containing clusters, the freshwater cluster and two novel clusters, were more highly represented, with one particular culture-containing cluster representing the dominant g20 genotype in the unamplified GOS sequence data. Finally, while some g20 sequences were non-randomly distributed with respect to habitat, there were always numerous exceptions to general patterns, indicating that phage portal proteins are not good predictors of a phage's host or the habitat in which a particular phage may thrive.
Virus-like particles occur in high abundance (to 108 ml−1) in the oceans (Bergh, 1989; Bratbak et al., 1990; Proctor and Fuhrman, 1990). One of the most well-studied phage–host systems in this habitat is the phages that infect the marine cyanobacteria Prochlorococcus and Synechococcus, which are globally important marine primary producers (Waterbury et al., 1986; Partensky et al., 1999). These ‘cyanophages’ are abundant (Waterbury and Valois, 1993; Suttle and Chan, 1994; Suttle, 2000; Lu et al., 2001; Frederickson et al., 2003; Marston and Sallee, 2003; Sullivan et al., 2003), contribute to host mortality (Waterbury and Valois, 1993; Suttle and Chan, 1994; Suttle, 2000) and are thought to play a role in maintaining the extensive microdiversity of their hosts (Waterbury and Valois, 1993; Suttle and Chan, 1994; Marston and Sallee, 2003; Sullivan et al., 2003) likely through killing the winner (sensuThingstad, 2000) and through the movement of genes throughout the host population (Lindell et al., 2004; Coleman et al., 2006; Sullivan et al., 2006).
Studying the diversity of phages has proven difficult because no universal gene, analogous to the 16S rRNA gene used for microbes, exists throughout all phage families (Paul et al., 2002). Thus family-specific genes have been proposed for use as taxonomic tools in phage ecology (Rohwer and Edwards, 2002). One such marker, a homologue to the coliphage T4 portal protein gene 20 (g20), has been developed to study the diversity of Myoviridae – one of the most common phage types observed in metagenomics surveys (Breitbart et al., 2002; 2004a; DeLong et al., 2006) and among Synechococcus cyanophage isolates (Suttle and Chan, 1993; Waterbury and Valois, 1993; Wilson et al., 1993; Sullivan et al., 2003). The g20 homologue is ubiquitous among T4-like myoviruses (see T4-like phages genome website http://phage.bioc.tulane.edu/) with hosts ranging from proteobacteria to cyanobacteria (Fuller et al., 1998; Hambly et al., 2001; Mann et al., 2005; Sullivan et al., 2005). The evolution of g20 is likely constrained because its protein product initiates capsid assembly (at least in T4), a process which involves geometric precision (Coombs and Eiserling, 1977; van Driel and Couture, 1978; Hsiao and Black, 1978) through the formation of a proximal vertex (van Driel and Couture, 1978) used for DNA packaging (Hsiao and Black, 1978) and binding the capsid to the tail junction (Coombs and Eiserling, 1977).
The availability of cultured cyanomyophage (Waterbury and Valois, 1993; Wilson et al., 1993; Suttle and Chan, 1993; Marston and Sallee, 2003; Sullivan et al., 2003) has allowed the design of cyanomyophage-specific g20 sequence PCR primers that have been used to study this component of viral populations in the wild. Early studies using non-degenerate PCR primers and DNA ‘fingerprinting’ techniques (e.g. denaturing gradient gel electrophoresis and terminal-restriction fragment length polymorphism banding patterns) revealed variability in g20 diversity across gradients in space and time from a variety of different environments (Wilson et al., 1999; 2000; Frederickson et al., 2003; Dorigo et al., 2004; Wang and Chen, 2004; Mühling et al., 2005; Sandaa and Larsen, 2006). These studies concluded that g20 diversity was as great within a sample as between oceans (Wilson et al., 1999), that phage g20 diversity increased as Synechococcus abundance increased (Wilson et al., 1999; 2000; Frederickson et al., 2003; Wang and Chen, 2004; Sandaa and Larsen, 2006), that some g20 types were ubiquitous in the habitats examined (Wilson et al., 1999; 2000; Frederickson et al., 2003; Dorigo et al., 2004), as well as a temporal study by Muhling andcolleagues (2005) that correlated ‘cyanophage’ diversity (inferred from g20 sequence types) with Synechococcus diversity (inferred from rpoC1 sequence types).
Subsequent cloning and sequencing of g20 PCR amplicons from both cultured isolates and wild populations have allowed phylogenetic analyses of cyanomyophage diversity. Although initial studies (Zhong et al., 2002) suggested some correlation between ocean habitat and g20 phylogeny (e.g. phylogenetic cluster II represents ‘open ocean’ g20 sequences), further sampling revealed that this was not the case, as seven g20 sequences from coastal Synechococcus myophages isolated from Rhode Island waters clustered with the putative ‘open ocean’ sequences (Marston and Sallee, 2003). As more g20 sequence data have accumulated from diverse environments (Zhong et al., 2002; Marston and Sallee, 2003; Dorigo et al., 2004; Short and Suttle, 2005; Sandaa and Larsen, 2006; Wilhelm et al., 2006), it has become clear that marine g20 sequences form nine phylogenetic clusters (first described by Zhong et al., 2002), and g20 sequences originating from freshwater environments form a separate, tenth cluster (Dorigo et al., 2004; Short and Suttle, 2005; Wilhelm et al., 2006). Three of the nine marine clusters (clusters I–III in Zhong et al., 2002) contain cultured representatives (hereafter called ‘culture-containing clusters’), whereas the remaining six marine clusters (clusters A-F) and the ‘freshwater’ cluster do not (hereafter called ‘environmental-sequence-only clusters’). The cultured representatives were isolated using only Synechococcus hosts (7 strains = WH7803, WH7805, WH8007, WH8012, WH8018, WH8101, WH8113), which undoubtedly limits the diversity represented considering the larger diversity of Synechococcus strains (Rocap et al., 2002; Fuller et al., 2003; Ahlgren and Rocap, 2006) and that the sister genus Prochlorococcus is also abundant in open ocean waters. This raises the question: could these seven environmental-sequence-only clusters represent novel cyanomyophages that infect this broader diversity of Synechococcus host strains, Prochlorococcus or other cyanobacteria?
To address this question, we isolated phages on a broad diversity of Prochlorococcus and Synechococcus hosts (Table 1), sequenced their g20 homologues and analysed their diversity in the context of published PCR-generated sequences from natural populations. We then combined the g20 sequences from these new cultured isolates with all environmental g20 sequences available [including all PCR-generated environmental sequences, as well as primer-independent sequences available in the Global Ocean Survey (GOS) metagenomic data set], to examine the broad diversity of g20 observed in the wild. This allowed us to ask: do any of the new environmental sequences cluster with the previously observed environmental-sequence-only clusters? Furthermore, are g20 sequence clustering patterns ecologically meaningful? Do they reflect the habitat – and by inference the microbial community – of the site from which they were isolated?
Table 1.
Efficacy of three different primer sets at amplifying the g20 gene from cultured cyanophage.
| g20 primer set |
|||||||||
|---|---|---|---|---|---|---|---|---|---|
| Phage strain | Original host strain isolated on | Site of Isolation | Depth (m) | Date isolated | Familya | CPS4GC/5 | CPS1/8 | CPS1.1/8.1 | Refsb |
| Prochlorococcus cyanophage | |||||||||
| P-SSP1 | MIT 9215 | BATS/31°48′N, 64°16′W | 100 | 6 June 2000 | P | – | – | – | 1 |
| P-RSP1 | MIT 9215 | Red Sea/29°28′N, 34°53′E | 0 | 15 July 2000 | P | – | – | – | 1 |
| P-RSP2 | MIT 9302 | Red Sea/29°28′N, 34°53′E | 0 | 15 July 2000 | P | – | – | – | 1 |
| P-SSP2 | MIT 9312 | BATS/31°48′N, 64°16′W | 120 | 29 September 1999 | P | – | – | – | 1 |
| P-SSP3 | MIT 9312 | BATS/31°48′N, 64°16′W | 100 | 29 September 1999 | P | – | – | – | 1 |
| P-SSP4 | MIT 9312 | BATS/31°48′N, 64°16′W | 70 | 26 September 1999 | P | – | – | – | 1 |
| P-SSP5 | MIT 9515 | BATS/31°48′N, 64°16′W | 120 | 29 September 1999 | P | – | – | – | 1 |
| P-SSP6 | MIT 9515 | BATS/31°48′N, 64°16′W | 100 | 26 September 1999 | P | – | – | – | 1 |
| P-SSP7 | MED4 | BATS/31°48′N, 64°16′W | 100 | 26 September 1999 | P | – | – | – | 1 |
| P-GSP1 | MED4 | Gulf Stream/38°21′N, 66°49′W | 40 | 6 October 1999 | P | – | – | – | 1 |
| P-SSP8 | NATL2A | BATS/31°48′N, 64°16′W | 100 | 26 September 1999 | P | – | – | – | 1 |
| P-RSP3 | NATL2A | Red Sea/29°28′N, 34°55′E | 50 | 13 September 2000 | P | – | – | – | 1 |
| P-SP1 | SS120 | Slope/38°10′N, 73°09′W | 83 | 17 September 2001 | P | – | – | – | 1 |
| P-SSM8 | MIT 9211 | W Sargasso Sea/34°24′N, 72°03′W | 30 | 22 September 2001 | M | + | + | + | 2 |
| P-SSM1 | MIT 9303 | BATS/31°48′N, 64°16′W | 100 | 6 June 2000 | M | + | – | + | 1 |
| P-RSM1 | MIT 9303 | Red Sea/29°28′N, 34°53′E | 0 | 15 July 2000 | M | + | – | + | 1 |
| P-RSM4 | MIT 9303 | Red Sea/29°28′N, 34°55′E | 130 | 13 September 2000 | M | + | + | + | 2 |
| P-ShM1 | MIT 9313 | Shelf/39°60′N, 71°48′W | 40 | 16 September 2001 | M | + | – | + | 1 |
| P-ShM2 | MIT 9313 | Shelf/39°60′N, 71°48′W | 0 | 16 September 2001 | M | – | – | + | 1 |
| P-SSM2 | NATL1A | BATS/31°48′N, 64°16′W | 100 | 6 June 2000 | M | + | + | + | 1 |
| P-RSM5 | NATL1A | Red Sea/29°28′N, 34°55′E | 130 | 13 September 2000 | M | + | + | + | 2 |
| P-SSM7 | NATL1A | BATS/31°48′N, 64°16′W | 120 | 29 September 1999 | M | – | – | + | 2 |
| P-SSM3 | NATL2A | BATS/31°48′N, 64°16′W | 100 | 6 June 2000 | M | – | – | + | 1 |
| P-SSM4 | NATL2A | BATS/31°48′N, 64°16′W | 10 | 6 June 2000 | M | – | – | + | 1 |
| P-SSM5 | NATL2A | BATS/31°48′N, 64°16′W | 15 | 26 September 1999 | M | + | – | + | 1 |
| P-SSM6 | NATL2A | BATS/31°48′N, 64°16′W | 40 | 29 September 1999 | M | – | – | + | 1 |
| P-RSM2 | NATL2A | Red Sea/29°28′N, 34°55′E | 50 | 13 September 2000 | M | + | – | + | 1 |
| P-RSM3 | NATL2A | Red Sea/29°28′N, 34°55′E | 50 | 13 September 2000 | M | – | – | + | 1 |
| P-SSM9 | NATL2A | W Sargasso Sea/34°24′N, 72°03′W | 0 | 22 September 2001 | M? | + | – | + | 2 |
| P-SSM10 | NATL2A | W Sargasso Sea/34°24′N, 72°03′W | 0 | 22 September 2001 | M? | + | – | + | 2 |
| P-SSM11 | NATL2A | W Sargasso Sea/34°24′N, 72°03′W | 0 | 22 September 2001 | M? | + | – | + | 2 |
| P-SSM12 | NATL2A | W Sargasso Sea/34°24′N, 72°03′W | 95 | 22 September 2001 | M? | + | – | + | 2 |
| Synechococcus cyanophage | |||||||||
| Syn5 | WH 8109 | Sargasso Sea/36°58′N, 73°42′W | 0 | December 1990 | P | – | – | – | 1 |
| Syn12 | WH 8017 | Gulf Stream/34°06′N, 61°01′W | 0 | July 1990 | P | – | – | – | 1 |
| S-SM1 | WH 6501 | Slope/38°10′N, 73°09′W | 0 | 17 September 2001 | M | – | – | + | 1 |
| S-ShM1 | WH 6501 | Shelf/39°60′N, 71°48′W | 0 | 16 September 2001 | M | + | + | + | 1 |
| S-SSM1 | WH 6501 | W Sargasso Sea/34°24′N, 72°03′W | 70 | 22 September 2001 | M | + | + | + | 1 |
| Syn 2 | WH 8012 | Sargasso Sea/34°06′N, 61°01′W | 0 | July 1990 | M | – | + | + | 3 |
| Syn 9 | WH 8012 | Woods Hole/41°31′N, 71°40′W | 0 | October 1990 | M | + | + | + | 3 |
| Syn 10 | WH 8017 | Gulf Stream/36°58′N, 73°42′W | 0 | December 1990 | M | + | + | + | 3 |
| Syn 26 | WH 8017 | NE Providence Channel/25°53′N, 77°34′W | 0 | January 1992 | M | + | + | + | 3 |
| S-SM2 | WH 8017 | Slope/38°10′N, 73°09′W | 15 | 17 September 2001 | M | + | – | + | 2 |
| Syn30 | WH 8018 | NE Providence Channel/25°53′N, 77°34′W | 0 | January 1992 | M | + | – | + | 3 |
| S-SSM3 | WH 8018 | W Sargasso Sea/34°24′N, 72°03′W | 0 | 22 September 2001 | M | + | + | + | 2 |
| S-SSM4 | WH 8018 | W Sargasso Sea/34°24′N, 72°03′W | 110 | 22 September 2001 | M | + | + | + | 2 |
| S-RIM3 | WH 8018 | Mt. Hope Bay, RI/41°39′N, 71°15′W | 0 | September 1999 | M? | + | – | + | 4 |
| Syn 33 | WH 7803 | Gulf Stream/25°51′N, 79°26′W | 0 | January 1995 | M | + | + | + | 3 |
| S-PM2 | WH 7803 | English Channel/50°18′N, 4°12′W | 0 | 23 September 1992 | M | + | + | + | 5 |
| S-WHM1 | WH 7803 | Woods Hole/41°31′N, 71°40′W | 0 | 11 August 1992 | M | + | + | + | 5 |
| S-RIM9 | WH 7803 | Mt. Hope Bay, RI/41°39′N, 71°15′W | 0 | May 2000 | M? | + | – | + | 4 |
| S-RIM17 | WH 7803 | Mt. Hope Bay, RI/41°39′N, 71°15′W | 0 | July 2001 | M? | + | – | + | 4 |
| S-RIM24 | WH 7803 | Mt. Hope Bay, RI/41°39′N, 71°15′W | 0 | December 2001 | M? | + | – | + | 4 |
| S-RIM30 | WH 7803 | Mt. Hope Bay, RI/41°39′N, 71°15′W | 0 | June 2002 | M? | + | – | + | 4 |
| Syn 1 | WH 8101 | Woods Hole/41°31′N, 71°40′W | 0 | August 1990 | M | + | – | + | 3 |
| S-ShM2 | WH 8102 | Shelf/39°60′N, 71°48′W | 0 | 16 September 2001 | M | + | + | + | 1 |
| S-SSM2 | WH 8102 | W Sargasso Sea/34°24′N, 72°03′W | 0 | 22 September 2001 | M | + | + | + | 1 |
| S-SSM5 | WH 8102 | W Sargasso Sea/34°24′N, 72°03′W | 95 | 22 September 2001 | M | + | + | + | 2 |
| Syn 19 | WH 8109 | Sargasso Sea/34°06′N, 61°01′W | 0 | July 1990 | M | – | – | + | 3 |
| S-SSM6 | WH 8109 | W Sargasso Sea/34°24′N, 72°03′W | 70 | 22 September 2001 | M | + | + | + | 2 |
| S-SSM7 | WH 8109 | W Sargasso Sea/34°24′N, 72°03′W | 95 | 22 September 2001 | M | + | + | + | 2 |
| Other phages | |||||||||
| IH6-φ1 | IH6 | Inner Harbor, Baltimore, MD | 0 | 17 November 2000 | M | – | – | – | 6 |
| IH6-φ7 | IH6 | Inner Harbor, Baltimore, MD | 0 | 17 November 2000 | P | – | – | – | 6 |
| IH11-φ2 | Alteromonas | Inner Harbor, Baltimore, MD | 0 | 17 November 2000 | M | – | – | – | 6 |
| IH11-φ5 | Alteromonas | Inner Harbor, Baltimore, MD | 0 | 17 November 2000 | P | – | – | – | 6 |
| CB8-φ2 | CB8 | Chesapeake Bay, MD | 0 | 17 November 2000 | M | – | – | – | 6 |
| CB8-φ6 | CB8 | Chesapeake Bay, MD | 0 | 17 November 2000 | M | – | – | – | 6 |
| CB-φ8 | Vibrio alginolyticus | Chesapeake Bay, MD | 0 | 17 November 2000 | M | – | – | – | 6 |
| HER320 | H7 | Helgoland, North Sea | 0 | 1976−1978 | M | – | – | – | 7 |
| HER321 | H100 | Helgoland, North Sea | 0 | 1976−1978 | P | – | – | – | 7 |
| HER322 | H100 | Helgoland, North Sea | 0 | 1976−1978 | M | – | – | – | 7 |
| HER327 | 11–68 | Helgoland, North Sea | 0 | 1976−1978 | S | – | – | – | 7 |
| HER328 | H105 | Helgoland, North Sea | 0 | 1976−1978 | S | – | – | – | 7 |
M, P and S represent the virus families Myoviridae, Podoviridae and Siphoviridae respectively, as determined by morphology. ‘M?’ indicates that the assignment is based solely on amplification and sequencing of a g20 PCR product and has not been confirmed with electron microscopy.
Reference where cultured isolate was originally described: 1, Sullivan and colleagues (2003); 2, this study; 3, Waterbury and Valois (1993); 4, Marston and Salee (2003); 5, Wilson and colleagues (1993); 6, Zhong and colleagues (2002); 7, Wichels and colleagues (1998).
‘+’ indicates positive PCR amplification; ‘−’ indicates that there was no PCR product of the expected size. The new g20 sequences contributed in this study are shown in bold letters. CPS1.1/8.1 is the new primer set designed for this study, while CPS4GC/5 and CPS1/8 were published previously.
Results and discussion
Analysis of g20 diversity captured by several g20 primer sets
As our understanding of marine myoviruses has grown over the years, multiple primer sets have been developed and used to specifically amplify cyanomyophage g20 sequences from field samples (Fuller et al., 1998; Wilson et al., 1999; 2000; Zhong et al., 2002; Frederickson et al., 2003; Marston and Sallee, 2003; Dorigo et al., 2004; Wang and Chen, 2004; Sandaa and Larsen, 2006; Wilhelm et al., 2006). Each of these primer sets was designed based on a limited number of sequences from cultured isolates. Thus we wondered how well these primer sets would capture the diversity of g20 sequences in our relatively extensive Prochlorococcus and Synechococcus cyanophage collection (Table 1).
We found that the CPS4GC/5 primer set (Wilson et al., 1999) amplified g20 sequences from 80% of the cyanomyophages screened (bold entries in Table 1). This primer set, however, amplifies only a small region of this gene (∼165 bp), thus its utility for subsequent phylogenetic analyses is limited. In contrast, the CPS1/8 primer set (Zhong et al., 2002), which captures a larger segment of the gene (∼594 bp), amplified the g20 sequence of only 56% of the cyanomyophages screened (Table 1). Using genome sequence data from two Prochlorococcus cyanomyophages (Sullivan et al., 2005) that became available after these primer sets were designed, we modified the CPS1/8 primer set with the hope of amplifying g20 from all of our isolates for use in subsequent phylogenetic analyses. Indeed, the redesigned set (CPS1.1/8.1) captured g20 homologues from all cyanomyophage isolates screened (Table 1). Despite their degeneracy, the redesigned primer set remained specific only for cyanomyophage isolates as inferred from repeatedly negative PCR results against the sipho- and podo-cyanophage, as well as the non-cyanomyophages we examined (Table 1).
Phylogenetic relationships of g20 sequences
We next analysed how these new g20 sequences from cultured isolates compared with selected sequences (see Experimental procedures) from the databases (Fig. 1). Randomly paired g20 sequence identities from this data set ranged from 59% to 100% amino acid identity, notably with some identical g20 protein sequences observed multiple times (alphanumeric clusters #1–13 in Fig. 1). This is not unprecedented: even at the level of the gene, identical viral sequences have been previously reported from vastly different aquatic environments using two separate gene markers including g20 (Zhong et al., 2002; Marston and Sallee, 2003; Short and Suttle, 2005) and DNA polymerase (Breitbart et al., 2004b; Breitbart and Rohwer, 2005).
Fig. 1.

Evolutionary relationships determined using 183 amino acids of the portal protein gene (g20) amplified from cultured phage isolates (names begin with ‘S-’ or ‘P-’ and are coloured orange or green for Synechococcus or Prochlorococcus phages respectively) from this study (italicized), as well as previous studies (non-italicized), and environmental g20 sequences (names in black) (Zhong et al., 2002; Marston and Sallee, 2003). Clusters defined by Zhong and colleagues (2002) are as follows: clusters I–III contain g20 sequences from cultured phage isolates, while clusters A–F represent only environmental g20 sequences. Clusters containing identical g20 protein sequences are numbered with alphanumeric numbers (1–13). For cultured phages, the phage isolate names are followed by black lettering that indicates the original host strain used for isolation, while the phage host range is indicated as high light-adapted Prochlorococcus (green circle or dash), low light-adapted Prochlorococcus (blue circle or dash) or Synechococcus (orange circle or dash). The circles represent cross-infection was observed within this group of hosts tested, whereas a dash indicates that no cross-infection was observed. Isolates not available for host range testing have no indication of their host range. The tree shown was inferred by neighbour-joining as described in the Experimental procedures. Support values shown at the nodes are neighbour-joining bootstrap/maximum parsimony bootstrap/maximum likelihood quartet puzzling support (only values > 50 are shown). Well-supported nodes (as defined in Experimental procedures) are designated by italicized support values, including six nodes that represent subclusters within the culture-containing clusters I–III. The g20 sequence from the non-cyanomyophage isolate T4 was used as an outgroup to root this tree.
In phylogenetic analyses, 40 of 45 g20 sequences from cyanomyophages (38 new, 7 previously published) grouped within the clusters that contain cultured representatives (I, II and III), four fell into a new monophyletic cluster (indicated by ‘PSSM9/11/12 new cluster’ on Fig. 1), and one (P-ShM1) fell onto a long branch. None fell into the previously defined (by Zhong et al., 2002) environmental-sequence-only clusters A–F, which were thought to be from marine cyanomyophages because of the use of isolate-designed and -tested ‘cyanophage-specific primers’. Thus either our phage culture collection is still not diverse enough to represent the g20 diversity of phages that infect marine cyanobacteria, or the sequences in the environmental-sequence-only clusters A–F represent myophages that infect other hosts. Observations made by Short and Suttle (2005) lend support to the latter. They found three g20 sequences in waters 3246 m deep in the Arctic Chukchi Sea, waters unlikely to contain cyanobacteria and their phages, which grouped with cluster A.
Given our extensive host range information for these cyanobacteria phage–host systems, we examined g20 clustering patterns for relationships with respect to the host strains upon which the phage were isolated or could cross-infect. None of the three culture-containing clusters (I, II, III) were comprised solely of g20 sequences from phages with similar hosts (Fig. 1), and no clear-cut patterns emerged when subclusters within these clusters were evaluated. This is consistent with the observations of Stoddard and colleagues (2007), who recently reported that g20 sequences could not predict the pattern of cross-resistance observed when selecting for cyanophage resistance in Synechococcus. Conversely, they also found that Synechococcus DNA-dependent RNA polymerase genotypes were not related to phage sensitivities (Stoddard et al., 2007). Thus for the Prochlorococcus/Synechococcus/myophage system in Fig. 1, it appears that commonly used phage and host genetic markers lack the ability to predict either the range of hosts that a phage can infect, or the range of phages to which a host is susceptible.
We next added more recently published g20 sequences to this analysis, including those from the non-PCR-based GOS metagenomics database (Rusch et al., 2007) and all published PCR-based environmental sequences (Fig. 2, Table 2). Only sequences of sufficient length for phylogenetic analysis were used. The majority (464 of 769) of these environmental sequences, including 401 GOS sequences, grouped in culture-containing clusters I, II and III. First we found that 13 of the 38 GOS sample sites included in our analysis lack Prochlorococcus and Synechococcus (as determined by dot-blots in Rusch et al., 2007), yet 75 g20 sequences from these sites fell into clusters I, II and III (Fig. 2), thought, from earlier studies, to represent myophages that infect marine pico-cyanobacteria. Thus it appears that clusters I, II and III likely represent phages that infect a diversity of hosts and are not limited to pico-cyanobacteria-dominated environments. Second, these analyses revealed that cluster II contains ∼10-fold more GOS sequences than clusters I and III (336 versus 32 and 33 respectively). If we ignore possible cloning bias, this suggests that cluster II sequences are by far the most abundant type in theenvironments sampled. Third, we note that a relatively tiny number of the GOS sequences fell into the environmental-sequence-only clusters – clusters A–F in Fig. 1– that were defined by Zhong and colleagues (2002) (Fig. 2). The 12 that fell into cluster A originated from seven sites with different physicochemical characteristics (see colour rings, Fig. 2). Even fewer sequences fell into environmental-sequence-only clusters B–F, suggesting that these types of g20 sequences are either extremely rare in the environments sampled to date, or are sequencing artefacts.
Fig. 2.

Evolutionary relationships determined using 554 base pairs of the portal protein gene (g20) from 769 available g20 sequences. Clusters defined by Zhong and colleagues (2002) are identified as culture-based clusters I–III and environmental-sequence-only clusters A–F. New clusters defined since Zhong and colleagues (2002) are indicated with the preface ‘new cluster’, a number and a brief description. The tree shown is the consensus (majority rules) tree from 11 GARLI iterations inferred using the maximum likelihood criterion (see Experimental procedures), with the Aeromonas phage Aeh1 g20 sequence used as an outgroup to root the tree. Three colour rings reflect the habitat type from which the g20 sequence originated. For most of these sequences (GOS sequences), there is ribotype dot-blot and metagenomic information about the microbial community structure at the site, while for non-GOS sequences such information was assumed where reasonable to do so (see Table 3 legend). The inner ring is the microbial community structure information listed as Rusch and colleagues (2007)-defined environmental categories, while the other two rings reflect the temperature and salinity of the original sampling site.
Table 2.
Origins of the g20 sequences used in ‘meta’ phylogenetic analyses shown in Fig. 2.
| # Sequences | Description | PCR-based? | Sequence label in Fig. 2 | Refs |
|---|---|---|---|---|
| 512 | Environmental sequences from 42 oceanic sample sites from the GOS | N | JC# | 1 |
| 56 | Environmental sequences from 19 globally distributed freshwater and marine sites | Y | AY705# | 2 |
| 25 | Environmental sequences from Rhode Island coastal waters, USA | Y | AY259# | 3 |
| 43 | Environmental sequences from Lake Erie, USA | Y | DQ318# | 4 |
| 47 | Environmental sequences from Lake Bourget, France | Y | AY426# | 5 |
| 27 | Environmental sequences and mixed lysates from coastal north-western Atlantic Ocean | Y | Variable | 6 |
| 51 | Cultured marine cyanomyophages of variable coastal and open ocean origins | N/A | Variable | 3, 7 |
| 8 | Cultured non-cyanomyophages from sewage | N/A | Variable | 8 |
The ‘PCR-based’ column indicates whether the environmental sequence was obtained by PCR or metagenomic approaches (N/A indicates that this is not applicable for sequences from cultured phage isolates). Reference code: 1, Rusch and colleagues (2007); 2, Short and Suttle (2005); 3, Marston and Salee (2003); 4, Wilhelm and colleagues (2006); 5, Dorigo and colleagues (2004); 6, Zhong and colleagues (2002); 7, this study; 8, T4-like phage genomes website http://phage.bioc.tulane.edu/
This expanded data set lends support for three additional g20 lineages (Fig. 2). These include 93 sequences that group with the previously identified ‘freshwater’ cluster (Dorigo et al., 2004; Short and Suttle, 2005; Wilhelm et al., 2006; labelled as ‘new cluster #1’ in Fig. 2), 25 sequences that group with the new culture-containing P-SSM9/11/12 cluster (named after the original phage isolates forming this cluster in Fig. 1, labelled as ‘new cluster #2’ in Fig. 2) and 84 environmental sequences (74 GOS + 10 non-GOS environmental sequences, labelled as ‘new cluster #3’ in Fig. 2) of mixed biogeographic and habitat origin that form a new environmental-sequence-only cluster.
Relationship between g20 clusters and habitat
Using Unifrac distance metric statistical tools (Lozupone et al., 2006), we examined the meta-g20 data set for correlates between sequence clustering and habitat descriptors, such as the microbial community type, temperature and salinity of the original sample. As a first approximation of the microbial community type, we used previously defined environmental categories originally inferred from ribotype dot-blots and metagenomic sequence data (figs 9 and 10 in Rusch et al., 2007) for the GOS g20 sequences, then assigned such categories where reasonable assumptions could be made for non-GOS sequences (details in Table 3 legend). We found that the g20 sequence clusters were non-randomly distributed with respect to sequences that originated from freshwater, tropical freshwater, arctic/polar, estuarine, Sargasso and hypersaline environments, while eight other environments lacked statistically significant clustering (Table 3). Beyond habitat-related properties, we also observed non-random g20 sequence distributions relative to abiotic factors, such as salinity (four of five categories significant, Table 4) and temperature (three of five categories significant, Table 5). In both cases, the outermost categories (e.g. ‘cold’ and ‘hot’, but not ‘medium’ for temperature) were significantly structured, but median categories were not. Qualitatively, some of these clustering patterns are also evident in the colour-coded rings in Fig. 2.
Table 3.
Relationship between g20 sequence clusters and the microbial community types of the original habitats from which they were collected.
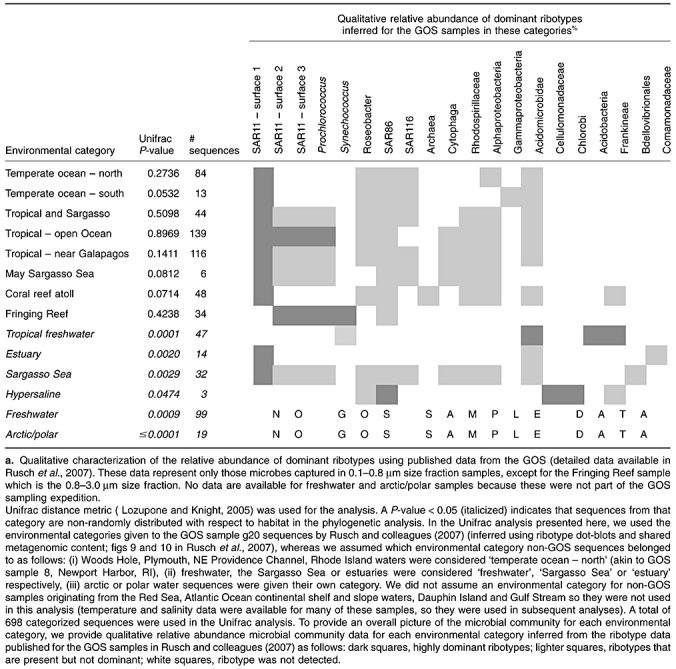
Table 4.
Probability that g20 sequence clusters are non-random with respect to the salinity at the site from which they were collected.
| Environmental category | Salinity (ppt) | # Sequences | Unifrac P-value |
|---|---|---|---|
| Sewage | N/A | 6 | ≤ 0.0001 |
| Fresh | < 0.50 | 149 | ≤ 0.0001 |
| Estuarine | 0.5–17.99 | 6 | 0.0096 |
| Brackish | 18–32.99 | 183 | 0.1456 |
| Ocean | 33–38 | 286 | 0.0006 |
| Hypersaline | > 38 | 8 | 0.0474 |
The Unifrac distance metric (Lozupone et al., 2006) was used for the analysis. Salinity values, when not available from the published work, were obtained from the communicating author of the paper in which the g20 sequence was first reported. All freshwater samples were assumed to have a salinity of < 0.50 ppt. All but the sequences from brackish waters clustered non-randomly (P< 0.05) with respect to the habitat type as defined by salinity.
Table 5.
Probability that g20 sequence clusters are non-random with respect to the temperature at the site from which they were collected.
| Environment | Temperature (°C) | # Sequences | Unifrac P-value |
|---|---|---|---|
| Sewage | N/A | 6 | ≤ 0.0001 |
| Cold | < 4.99 | 20 | ≤ 0.0001 |
| Cool | 5–14.99 | 57 | 0.2209 |
| Medium | 15–21.99 | 141 | 0.2296 |
| Warm | 22–29.99 | 467 | 0.0003 |
| Hot | > 30 | 3 | 0.0394 |
The Unifrac distance metric (Lozupone et al., 2006) was used for the analysis. Temperature values, when not available from the published work, were obtained from the communicating author of the paper in which the g20 sequence was first reported. All but the sequences from moderate temperatures clustered non-randomly (P< 0.05) with respect to the habitat type as defined by temperature.
Notably, however, clustered sequences, when significantly correlated with a habitat characteristic, always contained exceptions. For example, the ‘freshwater’ category was one of the most significantly non-random sequence categories (Fig. 2, Tables 3–5). In spite of this, the ‘freshwater’ cluster also contained 6 sequences from brackish waters, while 68 additional freshwater sequences were distributed elsewhere in the tree (light blue in the outer circle in Fig. 2). Similarly, while sequences in the ‘tropical freshwater’ category were found to be non-randomly distributed (Table 3), this is likely driven by the 24 sequences that form a well-defined subcluster within cluster II (GOS site 20 subcluster in Fig. 2). However, another 18 sequences from this same sample are scattered throughout the rest of the tree (11 in cluster II, 4 in cluster I and 3 in other clusters).
In other words, while some patterns emerge, exceptions are so frequent that one must conclude that the g20 sequence is not a good predictor of the habitat from which the phage originated. This is perhaps not surprising given the sheer abundance of phages on the planet (1031 phages) and the apparent promiscuity of viral–host interactions allow a lot of ‘rule breakers’ to persist. For example, not only can viral particles survive the physical challenges of extreme environmental shifts (Breitbart et al., 2004c), but viruses from one environment (e.g. freshwater Great Lakes) are also readily capable of infecting hosts from another environment (e.g. oceanic Synechococcus; (Wilhelm et al., 2006). Further, in coliphage T4, the g20 gene encodes a portal protein (Marusich and Mesyanzhinov, 1989) involved in functions quite removed from the direct interaction between phage and host. In contrast, the distal tail fibre gene is known to be the direct determinant of host range in T-even coliphages (Henning and Hashemolhosseini, 1994; Tetart et al., 1998). Thus, g20 sequence patterns might no longer correlate to host range at the fine scales (e.g. cyanobacteria and their phages) where host range ‘jumps’ could more commonly occur (e.g. by simple tail-fibre-switching sensuTetart et al., 1998) that would de-couple host properties from vertically evolved g20 sequence lineages.
Concluding remarks
Taken together, these data reveal that oceanic phage g20 sequence clustering patterns are, at a fine level (e.g. cyanobacteria-cyanophages), largely uncorrelated to host factors. As one zooms out to more generally consider the relationship between g20 sequences from the wild and the habitat characteristics from which they were collected, we find that they are non-randomly distributed, reflecting in some cases a connection between habitat properties, microbial community structure and phage community composition as defined by the g20 gene. We posit that the latter patterns, when evident, reflect host range-limited vertical evolution of g20 sequences, while the former reflects highly specific ‘tip-of-the-tree’ phage–host interactions that are evolutionarily disconnected from that of the g20 protein product.
Experimental procedures
Phage isolates
Forty-five cyanomyophages were isolated (Table 1) as described previously (Waterbury and Valois, 1993; Wilson et al., 1993; Marston and Sallee, 2003; Sullivan et al., 2003). S-PM2 and S-WHM1 were provided by W. Wilson and all S-RIM phages were provided by M. Marston. The specificity of cyanomyophage g20 primers was tested using five marine Pseudoalteromonas spp. bacteriophages (HER320, HER321, HER322, HER327, HER328; Wichels et al., 1998) that were purchased from the Felix d'Herelle Reference Center for Bacterial Viruses (contact H. Ackermann) as well as seven heterotrophic bacteriophages (IH6-φ1, IH6-φ7, IH11-φ2, IH11-φ5, CB8-φ2, CB8-φ6, CB-φ8; Zhong et al., 2002) kindly provided by F. Chen.
Primer redesign
To obtain g20 PCR amplicons from myophage that would not amplify using published primers, we added degeneracies to both CPS1 and CPS8, and shifted the CPS8 primer based upon genomic sequence data from two Prochlorococcus myophage isolates, P-SSM2 and P-SSM4 (Sullivan et al., 2005), to design CPS1.1 5′-GTAGWATWTTYTAYATTGAYGTWGG-3′ and CPS8.1 5′-ARTAYTTDCCDAYRWAWGGWTC-3′.
PCR amplification and sequencing
Previous g20 PCR primer sets [non-degenerate CPS4GC/CPS5 (Wilson et al., 1999) and degenerate CPS1/CPS8 (Fuller et al., 1998; Zhong et al., 2002] were designed to amplify ∼200 bp and ∼592 bp fragments, respectively, of the T4 g20 homologue in myophages.
The PCR reactions for CPS4GC/CPS5 and CPS1/CPS8 were conducted as described previously (Wilson et al., 1999; Zhong et al., 2002). Briefly, 2 μl of cyanophage lysate was added as DNA template to a PCR reaction mixture (total volume 50 μl) containing the following: 20 pmol each of a forward and reverse primers, 1× PCR buffer (50 mM Tris-HCl, 100 mM NaCl, 1.5 mM MgCl2), 250 μM of each dNTP and 0.75 U of Expand high-fidelity DNA polymerase (Roche, Indianapolis, IN). The PCR amplification was carried out with a PTC-100 DNA Engine Thermocycler (MJ Research, San Francisco, CA). Optimized thermal cycling conditions varied slightly from those reported as follows: CPS4GC/CPS5 required an initial denaturation step of 94°C for 3 min, followed by 35 cycles of denaturation at 94°C for 1 min, annealing at 50°C for 1 min, ramping at 0.3°C s−1, and elongation at 73°C for 1 min with a final elongation step at 73°C for 4 min, whereas both primer sets CPS1/CPS8 and CPS1.1/CPS8.1 required an initial denaturation step of 94°C for 3 min, followed by 35 cycles of denaturation at 94°C for 15 s, annealing at 35°C for 1 min, ramping at 0.3°C s−1, and elongation at 73°C for 1 min with a final elongation step at 73°C for 4 min. Systematic PCR screening using various primer sets was conducted using the same PCR reaction conditions and amplification protocol, but replacing the high-fidelity DNA polymerase with the less-expensive Taq DNA polymerase (Invitrogen, Carlsbad, CA) and only using 20 μl reactions as replicate (range 3–8) PCR reactions were pooled before sequencing to decrease PCR bias (Polz and Cavanaugh, 1998). In all cases, a 5–10 μl aliquot of PCR product was analysed in a 1.5% TAE gel stained with EtBr. The gel image was captured and analysed with an Eagle Eye II gel documentation system (Stratagene, La Jolla, CA). For purification and sequencing, replicate PCR reactions were combined, run out on a 1.5% TAE gel and purified using the QIAGEN QIAquick gel extraction kit (Qiagen, Valencia, CA). The purified PCR products were sequenced directly on both strands using the degenerate PCR primers used to obtain the product (CPS1, CPS8, CPS1.1, CPS8.1) with best results at primer concentrations ∼10-fold those suggested by the sequencing facility (40 pmol per reaction). To have greater confidence in negative PCR results, templates that did not produce amplified product were tested against optimized primer sets multiple times (data not shown). To confirm that our correctly sized amplicons from ‘positive’ PCR reactions were in fact g20 sequences, we sequenced the products. In all cases, the amplicon sequences were from g20 homologues
Where identical g20 sequences were observed in our study, we confirmed that the match was real and not the result of PCR contamination by re-amplifying and sequencing directly from fresh phage isolates (e.g. for P-SSM4, P-RSM3, S-SSM2 and ‘Syn’ phages Syn2, Syn9, Syn10, Syn26, Syn30, Syn33, Syn1, Syn19), many of which were obtained from stocks kept at a separate institution.
Phylogenetic analysis
For the new sequences presented in Fig. 1 of this study, paired sequence data were aligned using ClustalW (Thompson et al., 1997) and corrected manually using the sequence chromatograms. Consensus sequences for each cyanophage isolate were then translated in-frame into amino acids. Published g20 sequences from PCR-amplified environmental clone libraries and phage isolates were screened by building preliminary neighbour-joining trees to select representative sequences that spanned the known g20 diversity and added to this data set. Multiple sequence alignments of translated amino acid consensus sequences were done with ClustalW using the Gonnet protein weight matrix, a gap opening penalty of 15 and gap extension penalty of 0.30 (although changing these penalties did not significantly alter the alignments). Phylogenetic reconstruction was done using paup 4.0 (Swofford, 2002) for parsimony and distance trees and Tree-Puzzle 5.0 (Schmidt et al., 2002) for maximum likelihood trees. Evolutionary distances for neighbour-joining trees were calculated based on mean character distances, while evolutionary distances for maximum likelihood trees were calculated using the JTT model of substitution assuming a gamma-distributed model of rate heterogeneities with 16 gamma-rate categories empirically estimated from the data. A heuristic search with 10 random addition replicates using the tree-bisection-reconnection branch swapping algorithm was used for parsimony trees. Bootstrap analysis was used to estimate node reproducibility and tree topology for neighbour-joining (1000 replicates) and parsimony (100 replicates) trees, while quartet puzzling (10 000 replicates) indicates support for the maximum likelihood tree. The g20 sequence from coliphage T4 was used as the outgroup taxon for all analyses.
Phylogenetic analyses of 183 amino acids from viral g20 sequence from 79 taxa yielded robust, similar trees using both algorithmic (neighbour-joining) and tree-searching (parsimony and maximum likelihood) methods. The translated g20 sequences contained phylogenetically informative regions (e.g. for parsimony analyses, 41 positions were constant, 25 were parsimony uninformative and 117 were parsimony informative). Differences between the parsimony, distance and maximum likelihood trees were limited to the branching order of the terminal nodes in a given cluster. To evaluate whether g20 sequence diversity correlated to the host-related properties presented in Fig. 1, we empirically defined a ‘well supported node’ as one where the average support across all three phylogenetic methods was 80% or greater.
GOS g20 identification, filtering and phylogenetic analyses
Using the 549 bp g20 fragment from all available cultured isolates as queries (Table 1), we retrieved 553 sequence reads with similarity (bit score > 100) to this region of the g20 gene from the GOS databases (downloaded from http://camera.calit2.net/), then combined these GOS sequences with available published g20 sequences. The combined sequences were aligned using Clustal X and filtered to remove short, phylogenetically uninformative sequences, as well as sequences with poor quality at the ends. This manual curation left 769 total sequences (512 GOS sequences, details in Table 2) with 554 aligned nucleotide positions. Eleven maximum likelihood trees were generated using garli (Zwickl, 2006), starting from a neighbour-joining topology calculated in paup v4b10 (Swofford, 2002). Tree searching was terminated after 100 000 generations with no significantly better scoring topology, and a score improvement threshold for termination of 0.05. Topology mutation proportions were 0.1–0.2 nearest neighbour interchange and 0.8–0.9 limited SPR (subtree pruning-regrafting), with the maximum SPR range of 8–10 branches. From the 11 resulting trees, a majority-rule consensus tree (threshold 50% agreement) was generated in paup and is presented in Fig. 2.
Statistical analyses to evaluate whether g20 clustering patterns uncovered in the phylogenetic reconstructions were related to the habitat features of the original sample (e.g. microbial community type, temperature and salinity) were carried out using the Unifrac distance metric statistical tools available at http://bmf2.colorado.edu/unifrac/index.psp (Lozupone and Knight, 2005). The database and the tree file used for the analysis are provided in Supplementary Information (Files S1 and 2). Briefly, all g20 sequences were assigned to environmental categories using meta data for each sequence, with some assumptions made as described in Table 3 legend. Missing meta data for published g20 sequences were obtained where possible from the authors of the original work, as indicated in Tables 4 and 5. The patterns of these meta data were evaluated for ‘each environment separately’ in the context of a single neighbour-joining tree that included branch lengths (File S2) using Unifrac; all statistical results were similar using the P-test (also available at the Unifrac site, data not shown).
Nucleotide sequence accession numbers
The nucleotide sequences determined in this study were submitted to GenBank and assigned accession numbers EU715778–15813.
Acknowledgments
This research was supported in part by funding from NSF (CMORE contribution #87), DOE, The Seaver Foundation and the Gordon and Betty Moore Foundation Marine Microbiology Program to S.W.C.; an NIH Bioinformatics Training Grant supported M.B.S.; MIT Undergraduate Research Opportunities Program supported V.Q., J.A.L., G.T., R.F. and J.E.R.; Howard Hughes Medical Institute funded MIT Biology Department Undergraduate Research Opportunities Program supported A.S.D.; NSERC (Canada) Discovery Grant (DG 298394) and a Grant from the Canadian Foundation for Innovation (NOF10394) to J.P.B.; NSF Graduate Fellowship funding supported M.L.C. F. Chen and M. Marston kindly provided phage isolates used in testing of PCR primer sets. M.B.S. thanks C. Lozupone and M. Hamady for interpretive and technical support using Unifrac, as well as F. Chen, M. Marston, U. Dorigo, J. Waterbury and S. Wilhelm for providing unpublished meta-data for published g20 sequences to make the meta-g20 data set analyses as comprehensive as possible. The comments of V. Rich greatly improved the manuscript.
Supplementary material
The following supplementary material is available for this article online:
File S1.Salinity categories used in Unifrac analyses.
File S2.Treefree used in Unifrac analyses.
This material is available as part of the online article from http://www.blackwell-synergy.com
Please note: Blackwell Publishing is not responsible for the content or functionality of any supplementary materials supplied by the authors. Any queries (other than missing material) should be directed to the corresponding author for the article.
References
- Ahlgren NA, Rocap G. Culture isolation and culture-independent clone libraries reveal new marine Synechococcus ecotypes with distinctive light and nitrogen physiologies. Appl Environ Microbiol. 2006;72:7193–7204. doi: 10.1128/AEM.00358-06. [DOI] [PMC free article] [PubMed] [Google Scholar]
- Bergh O. High abundance of viruses found in aquatic environments. Nature. 1989;340:467–468. doi: 10.1038/340467a0. [DOI] [PubMed] [Google Scholar]
- Bratbak G, Heldal M, Norland S, Thingstad TF. Viruses as partners in spring bloom microbial trophodynamics. Appl Environ Microbiol. 1990;56:1400–1405. doi: 10.1128/aem.56.5.1400-1405.1990. [DOI] [PMC free article] [PubMed] [Google Scholar]
- Breitbart M, Rohwer F. Here a virus, there a virus, everywhere the same virus? Trends Microbiol. 2005;13:278–284. doi: 10.1016/j.tim.2005.04.003. [DOI] [PubMed] [Google Scholar]
- Breitbart M, Salamon P, Andresen B, Mahaffy JM, Segall AM, Mead D, et al. Genomic analysis of uncultured marine viral communities. Proc Natl Acad Sci USA. 2002;99:14250–14255. doi: 10.1073/pnas.202488399. [DOI] [PMC free article] [PubMed] [Google Scholar]
- Breitbart M, Felts B, Kelley S, Mahaffy JM, Nulton J, Salamon P, Rohwer F. Diversity and population structure of a near-shore marine-sediment viral community. Proc R Soc Lond B Biol Sci. 2004a;271:565–574. doi: 10.1098/rspb.2003.2628. [DOI] [PMC free article] [PubMed] [Google Scholar]
- Breitbart M, Miyake JH, Rohwer F. Global distribution of nearly identical phage-encoded DNA sequences. FEMS Microbiol Lett. 2004b;236:249–256. doi: 10.1016/j.femsle.2004.05.042. [DOI] [PubMed] [Google Scholar]
- Breitbart M, Wegley L, Leeds S, Schoenfeld T, Rohwer F. Phage community dynamics in hot springs. Appl Environ Microbiol. 2004c;70:1633–1640. doi: 10.1128/AEM.70.3.1633-1640.2004. [DOI] [PMC free article] [PubMed] [Google Scholar]
- Coleman ML, Sullivan MB, Martiny AC, Steglich C, Barry K, Delong EF, Chisholm SW. Genomic islands and the ecology and evolution of Prochlorococcus. Science. 2006;311:1768–1770. doi: 10.1126/science.1122050. [DOI] [PubMed] [Google Scholar]
- Coombs D, Eiserling FA. Studies on the structure, protein composition and assembly of the neck of bacteriophage T4. J Mol Biol. 1977;116:375–407. doi: 10.1016/0022-2836(77)90076-6. [DOI] [PubMed] [Google Scholar]
- DeLong EF, Preston CM, Mincer T, Rich V, Hallam SJ, Frigaard NU, et al. Community genomics among stratified microbial assemblages in the ocean's interior. Science. 2006;311:496–503. doi: 10.1126/science.1120250. [DOI] [PubMed] [Google Scholar]
- Dorigo U, Jacquet S, Humbert J-F. Cyanophage diversity, inferred from g20 gene analyses, in the Largest Natural Lake in France, Lake Bourget. Appl Environ Microbiol. 2004;70:1017–1022. doi: 10.1128/AEM.70.2.1017-1022.2004. [DOI] [PMC free article] [PubMed] [Google Scholar]
- van Driel R, Couture E. Assembly of the scaffolding core of bacteriophage T4 proheads. J Mol Biol. 1978;123:713–719. doi: 10.1016/0022-2836(78)90217-6. [DOI] [PubMed] [Google Scholar]
- Frederickson CM, Short SM, Suttle CA. The physical environment affects cyanophage communities in British Columbia Inlets. Microbial Ecology. 2003;46:348–357. doi: 10.1007/s00248-003-1010-2. [DOI] [PubMed] [Google Scholar]
- Fuller NJ, Wilson WH, Joint IR, Mann NH. Occurrence of a sequence in marine cyanophages similar to that of T4 g20 and its application to PCR-based detection and quantification techniques. Appl Environ Microbiol. 1998;64:2051–2060. doi: 10.1128/aem.64.6.2051-2060.1998. [DOI] [PMC free article] [PubMed] [Google Scholar]
- Fuller NJ, Marie D, Partensky F, Vaulot D, Post AF, Scanlan DJ. Clade-specific 16S ribosomal DNA oligonucleotides reveal the predominance of a single marine Synechococcus clade throughout a stratified water column in the Red Sea. Appl Environ Microbiol. 2003;69:2430–2443. doi: 10.1128/AEM.69.5.2430-2443.2003. [DOI] [PMC free article] [PubMed] [Google Scholar]
- Hambly E, Tetart F, Desplats C, Wilson WH, Krisch HM, Mann NH. A conserved genetic module that encodes the major virion components in both the coliphage T4 and the marine cyanophage S-PM2. Proc Natl Acad Sci USA. 2001;98:11411–11416. doi: 10.1073/pnas.191174498. [DOI] [PMC free article] [PubMed] [Google Scholar]
- Henning U, Hashemolhosseini S. Receptor recognition by T-even-type coliphages. In: Karam J, editor. Molecular Biology of Bacteriophage T4. Washington DC, USA: American Society for Microbiology Press; 1994. pp. 291–298. [Google Scholar]
- Hsiao CL, Black LW. Head morphogenesis of bacteriophage T4. III. The role of g20 in DNA packaging. Virology. 1978;91:26–38. doi: 10.1016/0042-6822(78)90352-5. [DOI] [PubMed] [Google Scholar]
- Lindell D, Sullivan MB, Johnson ZI, Tolonen AC, Rohwer F, Chisholm SW. Transfer of photosynthesis genes to and from Prochlorococcus viruses. Proc Natl Acad Sci USA. 2004;101:11013–11018. doi: 10.1073/pnas.0401526101. [DOI] [PMC free article] [PubMed] [Google Scholar]
- Lozupone C, Knight R. UniFrac: a new phylogenetic method for comparing microbial communities. Appl Environ Microbiol. 2005;71:8228–8235. doi: 10.1128/AEM.71.12.8228-8235.2005. [DOI] [PMC free article] [PubMed] [Google Scholar]
- Lozupone C, Hamady M, Knight R. UniFrac – an online tool for comparing microbial community diversity in a phylogenetic context. BMC Bioinformatics. 2006;7:371. doi: 10.1186/1471-2105-7-371. [DOI] [PMC free article] [PubMed] [Google Scholar]
- Lu J, Chen F, Hodson RE. Distribution, isolation, host specificity, and diversity of cyanophages infecting marine Synechococcus spp. in river estuaries. Appl Environ Microbiol. 2001;67:3285–3290. doi: 10.1128/AEM.67.7.3285-3290.2001. [DOI] [PMC free article] [PubMed] [Google Scholar]
- Mann NH, Clokie MR, Millard A, Cook A, Wilson WH, Wheatley PJ, et al. The genome of S-PM2, a ‘photosynthetic’ T4-type bacteriophage that infects marine Synechococcus. J Bacteriol. 2005;187:3188–3200. doi: 10.1128/JB.187.9.3188-3200.2005. [DOI] [PMC free article] [PubMed] [Google Scholar]
- Marston MF, Sallee JL. Genetic diversity and temporal variation in the cyanophage community infecting marine Synechococcus species in Rhode Island's coastal waters. Appl Environ Microbiol. 2003;69:4639–4647. doi: 10.1128/AEM.69.8.4639-4647.2003. [DOI] [PMC free article] [PubMed] [Google Scholar]
- Marusich EI, Mesyanzhinov VV. Nucleotide and deduced amino acid sequence of bacteriophage T4 gene 20. Nucleic Acids Res. 1989;17:7514. doi: 10.1093/nar/17.18.7514. [DOI] [PMC free article] [PubMed] [Google Scholar]
- Mühling M, Fuller NJ, Millard A, Somerfield PJ, Marie D, Wilson WH, et al. Genetic diversity of marine Synechococcus and co-occurring cyanophage communities: evidence for viral control of phytoplankton. Environ Microbiol. 2005;7:499–508. doi: 10.1111/j.1462-2920.2005.00713.x. [DOI] [PubMed] [Google Scholar]
- Partensky F, Hess WR, Vaulot D. Prochlorococcus, a marine photosynthetic prokaryote of global significance. Microbiol Mol Biol Rev. 1999;63:106–127. doi: 10.1128/mmbr.63.1.106-127.1999. [DOI] [PMC free article] [PubMed] [Google Scholar]
- Paul JH, Sullivan MB, Segall AM, Rohwer F. Marine phage genomics. Comp Biochem Physiol B Biochem Mol Biol. 2002;133:463–476. doi: 10.1016/s1096-4959(02)00168-9. [DOI] [PubMed] [Google Scholar]
- Polz MF, Cavanaugh CM. Bias in template-to-product ratios in multitemplate PCR. Appl Environ Microbiol. 1998;64:3724–3730. doi: 10.1128/aem.64.10.3724-3730.1998. [DOI] [PMC free article] [PubMed] [Google Scholar]
- Proctor LM, Fuhrman JA. Viral mortality of marine bacteria and cyanobacteria. Nature. 1990;343:60–62. [Google Scholar]
- Rocap G, Distel DL, Waterbury JB, Chisholm SW. Resolution of Prochlorococcus and Synechococcus ecotypes by using 16S−23S ribosomal DNA internal transcribed spacer sequences. Appl Environ Microbiol. 2002;68:1180–1191. doi: 10.1128/AEM.68.3.1180-1191.2002. [DOI] [PMC free article] [PubMed] [Google Scholar]
- Rohwer F, Edwards R. The Phage Proteomic Tree: a genome-based taxonomy for phage. J Bacteriol. 2002;184:4529–4535. doi: 10.1128/JB.184.16.4529-4535.2002. [DOI] [PMC free article] [PubMed] [Google Scholar]
- Rusch DB, Halpern AL, Sutton G, Heidelberg KB, Williamson S, Yooseph S, et al. The Sorcerer II Global Ocean Sampling Expedition: Northwest Atlantic through Eastern Tropical Pacific. PLoS Biol. 2007;5:e77. doi: 10.1371/journal.pbio.0050077. [DOI] [PMC free article] [PubMed] [Google Scholar]
- Sandaa RA, Larsen A. Seasonal variations in virus–host populations in Norwegian coastal waters: focusing on the cyanophage community infecting marine Synechococcus spp. Appl Environ Microbiol. 2006;72:4610–4618. doi: 10.1128/AEM.00168-06. [DOI] [PMC free article] [PubMed] [Google Scholar]
- Schmidt HA, Strimmer K, Vingron M, von Haeseler A. TREE-PUZZLE: maximum likelihood phylogenetic analysis using quartets and parallel computing. Bioinformatics. 2002;18:502–504. doi: 10.1093/bioinformatics/18.3.502. [DOI] [PubMed] [Google Scholar]
- Short CM, Suttle CA. Nearly identical bacteriophage structural gene sequences are widely distributed in both marine and freshwater environments. Appl Environ Microbiol. 2005;71:480–486. doi: 10.1128/AEM.71.1.480-486.2005. [DOI] [PMC free article] [PubMed] [Google Scholar]
- Stoddard LI, Martiny JB, Marston MF. Selection and characterization of cyanophage resistance in marine Synechococcus strains. Appl Environ Microbiol. 2007;73:5516–5522. doi: 10.1128/AEM.00356-07. [DOI] [PMC free article] [PubMed] [Google Scholar]
- Sullivan MB, Waterbury JB, Chisholm SW. Cyanophages infecting the oceanic cyanobacterium Prochlorococcus. Nature. 2003;424:1047–1051. doi: 10.1038/nature01929. [DOI] [PubMed] [Google Scholar]
- Sullivan MB, Coleman M, Weigele P, Rohwer F, Chisholm SW. Three Prochlorococcus cyanophage genomes: signature features and ecological interpretations. PLoS Biol. 2005;3:e144. doi: 10.1371/journal.pbio.0030144. [DOI] [PMC free article] [PubMed] [Google Scholar]
- Sullivan MB, Lindell D, Lee JA, Thompson LR, Bielawski JP, Chisholm SW. Prevalence and evolution of core photosystem II genes in marine cyanobacterial viruses and their hosts. PLoS Biol. 2006;4:e234. doi: 10.1371/journal.pbio.0040234. [DOI] [PMC free article] [PubMed] [Google Scholar]
- Suttle CA. Cyanophages and their role in the ecology of cyanobacteria. In: Whitton BA, Potts M, editors. The Ecology of Cyanobacteria: Their Diversity in Tiime and Space. Boston, USA: Kluwer Academic Publishers; 2000. pp. 563–589. [Google Scholar]
- Suttle CA, Chan AM. Marine cyanophages infecting oceanic and coastal strains of Synechococcus: abundance, morphology, cross-infectivity and growth characteristics. Mar Ecol Prog Ser. 1993;92:99–109. [Google Scholar]
- Suttle CA, Chan AM. Dynamics and distribution of cyanophages and their effects on marine Synechococcus spp. Appl Environ Microbiol. 1994;60:3167–3174. doi: 10.1128/aem.60.9.3167-3174.1994. [DOI] [PMC free article] [PubMed] [Google Scholar]
- Swofford DL. PAUP*.Phylogenetic Analysis Using Parsimony (*and Other Methods) Sunderland, MA, USA: Sinauer Associates; 2002. Version 4. [Google Scholar]
- Tetart F, Desplats C, Krisch HM. Genome plasticity in the distal tail fiber locus of the T-even bacteriophage: recombination between conserved motifs swaps adhesin specificity. J Mol Biol. 1998;282:543–556. doi: 10.1006/jmbi.1998.2047. [DOI] [PubMed] [Google Scholar]
- Thikngstad TF. Elements of a theory for the mechanisms controlling abundance, diversity, and biogeochemical role of lytic bacterial viruses in aquatic ecosystems. Limnol Oceanogr. 2000;45:1320–1328. [Google Scholar]
- Thompson JD, Gibson TJ, Plewniak F, Jeanmougin F, Higgins DG. The CLUSTAL_X windows interface: flexible strategies for multiple sequence alignment aided by quality analysis tools. Nucleic Acids Res. 1997;25:4876–4882. doi: 10.1093/nar/25.24.4876. [DOI] [PMC free article] [PubMed] [Google Scholar]
- Wang K, Chen F. Genetic diversity and population dynamics of cyanophage communities in the Chesapeake Bay. Aquat Microb Ecol. 2004;34:105–116. [Google Scholar]
- Waterbury JB, Valois FW. Resistance to co-occurring phages enables marine Synechococcus communities to coexist with cyanophage abundant in seawater. Appl Environ Microbiol. 1993;59:3393–3399. doi: 10.1128/aem.59.10.3393-3399.1993. [DOI] [PMC free article] [PubMed] [Google Scholar]
- Waterbury JB, Watson SW, Valois FW, Franks DG. Biological and ecological characterization of the marine unicellular cyanobacterium Synechococcus. Can Bull Fish Aquat Sci. 1986;214:71–120. [Google Scholar]
- Wichels A, Biel SS, Gelderblom HR, Brinkhoff T, Muyzer G, Schutt C. Bacteriophage diversity in the North Sea. Appl Environ Microbiol. 1998;64:4128–4133. doi: 10.1128/aem.64.11.4128-4133.1998. [DOI] [PMC free article] [PubMed] [Google Scholar]
- Wilhelm SW, Carberry MJ, Eldridge ML, Poorvin L, Saxton MA, Doblin MA. Marine and freshwater cyanophages in a Laurentian Great Lake: evidence from infectivity assays and molecular analyses of g20 genes. Appl Environ Microbiol. 2006;72:4957–4963. doi: 10.1128/AEM.00349-06. [DOI] [PMC free article] [PubMed] [Google Scholar]
- Wilson WH, Fuller NJ, Joint IR, Mann NH. Analysis of cyanophage diversity and population structure in a south-north transect of the Atlantic Ocean. In: Sharpy L, Larkum AWD, editors. Marine Cyanobacteria. Monaco: Bulletin de l'Institut oceanographique; 1999. pp. 209–216. [Google Scholar]
- Wilson WH, Fuller NJ, Joint IR, Mann NH. Analysis of cyanophage diversity in the marine environment using denaturing gradient gel electrophoresis. In: Bell CR, Brylinksky M, Johnson-Green P, editors. Microbial Biosystems: New Fronteirs.Proceedings of the 8th International Symposium on Microbial Ecology. Halifax, Nova Scotia, Canada: Atlantic Canada Society for Microbial Ecology; 2000. pp. 565–570. [Google Scholar]
- Wilson WH, Joint IR, Carr NG, Mann NH. Isolation and molecular characterization of five marine cyanophages propogated on Synechococcus sp. strain WH 7803. Appl Environ Microbiol. 1993;59:3736–3743. doi: 10.1128/aem.59.11.3736-3743.1993. [DOI] [PMC free article] [PubMed] [Google Scholar]
- Zhong Y, Chen F, Wilhelm SW, Poorvin L, Hodson RE. Phylogenetic diversity of marine cyanophage isolates and natural virus communities as revealed by sequences of viral capsid assembly protein gene g20. Appl Environ Microbiol. 2002;68:1576–1584. doi: 10.1128/AEM.68.4.1576-1584.2002. [DOI] [PMC free article] [PubMed] [Google Scholar]
- Zwickl DJ. Genetic Algorithm Approaches for the Phylogenetic Analysis of Large Biological Sequence Datasets under the Maximum Likelihood Criterion. Austin, TX, USA: University of Texas.; 2006. [Google Scholar]
Associated Data
This section collects any data citations, data availability statements, or supplementary materials included in this article.