Abstract
In obesity and diabetes, an imbalance in fatty acid uptake and fatty acid utilization leads to excess accumulation of lipid in non-adipose tissues. This lipid overload is associated with cellular dysfunction and cell death, which contribute to organ failure, a phenomenon termed lipotoxicity. To elucidate the molecular mechanism of lipid-mediated cell death, we generated and characterized a mutant Chinese hamster ovary cell line that is resistant to palmitate-induced cell death. In this mutant, random insertion of a retroviral promoter trap has disrupted the gene for the non-coding RNA, growth arrested DNA-damage inducible gene 7 (gadd7). Here we report that gadd7 is induced by lipotoxic stress in a reactive oxygen species (ROS)-dependent fashion and is necessary for both lipid- and general oxidative stress-mediated cell death. Depletion of gadd7 by mutagenesis or short hairpin RNA knockdown significantly reduces lipid and non-lipid induced ROS. Furthermore, depletion of gadd7 delays and diminishes ROS-induced endoplasmic reticulum stress. Together these data are the first to implicate a non-coding RNA in a feed-forward loop with oxidative stress and its induction of the endoplasmic reticulum stress response.
Cellular homeostasis can be perturbed by a myriad of stimuli, including metabolic imbalance, oxidative stress, and aberrant protein folding. In response to such stressors, cells induce specific molecular pathways that commonly involve activation of signaling cascades or alterations in gene expression (1, 2). These responses enable cells to adapt to relatively modest stress and regain homeostasis. However, if the stress is extreme or prolonged, cells are unable to re-establish homeostasis and in turn, activate pathways that result in cell death.
In obesity and diabetes, high serum triglycerides and free fatty acids (FFAs)2 lead to excess accumulation of lipid in non-adipose tissues. This lipid accumulation is associated with cellular dysfunction and cell death, which contribute to organ failure, a phenomenon termed lipotoxicity (3). Evidence from human studies implicates lipotoxicity in heart failure associated with obesity and diabetes by showing a link between cardiomyocyte lipid accumulation and heart muscle dysfunction (4–6). In rodent models of diabetes and in several transgenic mouse models, increased cardiac fatty acid uptake and oxidation and/or cardiomyocyte lipid accumulation is associated with heart failure (7–12). Similarly, lipid accumulation in the pancreas, kidney, and liver in obesity and diabetes is associated with organ dysfunction (13–15). Furthermore, end-organ damage in diabetes and obesity is associated with oxidative and endoplasmic reticulum (ER) stress that may be related in part to lipotoxicity, because perturbation of lipid metabolism alone can lead to these responses (11, 16–22).
Studies from our laboratory and others show that lipotoxicity can be modeled in established cell lines by supplementation of culture media with pathophysiological concentrations of the saturated FFA, palmitate. In these studies palmitate supplementation of diverse cell types leads to cell death through the accumulation of ROS and induction of ER stress (21, 23–27). A number of reports suggest that palmitate induces ROS through activation of NADPH oxidase (23, 24). Scavenging ROS with antioxidants not only inhibits lipotoxic cell death, but also significantly diminishes induction of the ER stress response, suggesting that lipid-mediated oxidative stress leads to ER stress (21). Pathophysiological concentrations of palmitate also lead to rapid remodeling of ER membrane lipids that may directly impair ER structure and function (28). Although, oxidative stress and ER stress responses are known to be integral steps in lipotoxicity, the precise molecular mechanisms by which excess lipid orchestrates these stress responses remain unresolved.
In an effort to elucidate how cells respond to lipid metabolic stress, we used retroviral promoter trap mutagenesis and selection in palmitate-supplemented media to isolate Chinese hamster ovary (CHO) cells that are resistant to lipotoxicity (21). Herein we describe a mutant with a disruption in gadd7, a gene that leads to expression of a non-coding RNA (ncRNA) previously described as a hydrogen peroxide (H2O2)-inducible transcript (29, 30). We demonstrate that gadd7 participates in a feed-forward loop that regulates the response to oxidative stress.
EXPERIMENTAL PROCEDURES
Materials—Palmitate was from Nu-Chek Prep (Elysian) and [14C]palmitate was from PerkinElmer Life Sciences. Staurosporine and actinomycin D were from Calbiochem. Vitamin E, H2O2, phloretin, tunicamycin, thapsigargin, fatty acid-free bovine serum albumin, N-acetyl cysteine (NAC), xanthine, and xanthine oxidase were from Sigma.
Cell Culture—CHO-K1 cells (American Type Culture Collection) and CHO-derived cell lines were maintained in high glucose (4.5 mg/ml Dulbecco's modified Eagle's medium and Ham's F-12 nutrient mixture (1:1)) media with 5% non-inactivated fetal bovine serum, 2 mm l-glutamine, 50 units/ml penicillin G sodium, 50 units/ml streptomycin sulfate, and 1 mm sodium pyruvate. For lipotoxicity experiments, cell culture media was supplemented with 500 μm palmitate complexed to bovine serum albumin at a 2:1 m ratio, as described previously (25). For antioxidant studies, cells were pretreated with 400 μm vitamin E for 1 h or with 5 mm NAC for 5 h, then rinsed with phosphate-buffered saline (PBS), and co-treated with 500 μm palmitate and 400 μm vitamin E or 5 mm NAC. To induce ER stress, cells were treated with 2.5 μg/ml tunicamycin or 1 mm thapsigargin. For ROS induction cells were treated with 2.3 mm H2O2 in growth media or with 100 μm xanthine and 15–150 microunits/ml xanthine oxidase in PBS containing 0.5 mm MgCl2, 0.92 mm CaCl2, 5 mm glucose, and 0.6% bovine serum albumin or in growth media.
Generation of CHO Cell Mutants—Vesicular stomatitis virus G protein pseudotyped murine retrovirus encoding the ROSAβgeo retroviral promoter trap (31) was generated as described previously (32). CHO cells were transduced with retrovirus at a low multiplicity of infection and mutants were isolated as described previously (21). Number of retroviral insertions within the mutant cell genome was assessed by Southern blot. Genomic DNA was digested with restriction enzymes (New England BioLabs) separated by 0.8% agarose gel electrophoresis, transferred to nylon membranes, and probed with a 32P-labeled probe corresponding to the ROSAβgeo proviral sequence.
Cell Death and DNA Fragmentation Assays—Cell death was assessed by membrane permeability to propidium iodide (PI) staining as described previously (25). Briefly, cells (5 × 10⁵) were plated into 35-mm wells 1 day prior to treatment. Following treatments, cells were harvested by trypsinization and stained with 1 μm PI. Percentage of PI-positive cells was determined by flow cytometry, quantifying 104 cells/sample. Apoptosis was assessed by quantifying DNA cleavage using a DNA fragment end labeling kit (TUNEL; Calbiochem). Percentage of DNA fragment end-labeled cells was quantified by flow cytometry, quantifying 104 cells/sample.
Identification of Trapped Gene—The endogenous gene disrupted by retroviral insertion was identified by 5′ rapid amplification of cDNA ends (RACE) using an oligonucleotide tag and ROSAβgeo sequences (SMART RACE cDNA amplification kit; Clontech). The 5′ RACE product was TA cloned and sequenced. Gene identification and directed PCR were carried out as described previously (21). Directed PCR primers used to verify retroviral integration within the gadd7 gene were: gadd7 forward, 5′-GGG AAG CTG AGG TTT TTC C-3′; gadd7 reverse, 5′-CAC ACC AGT CTC AAC TCC C-3′; and ROSAβgeo reverse, 5′-CTC AGG TCA AAT TCA GAC GG-3′.
Quantitative Real Time PCR (qPCR)—Total RNA was isolated using TRIzol reagent (Invitrogen) and reverse transcribed to cDNA using the SuperScript First-strand Synthesis System for RT-PCR (Invitrogen) following the manufacturer's instructions. cDNA was amplified for 40 PCR cycles using SYBR Green PCR master mixture (Applied Biosystems) and 10 nm template-specific primers in a ABI Prism 7500 sequence detector. Primer sequences to gadd7 (forward, 5′-ACA ATG ACG CCA TCG TTT TCT-3′; reverse, 5′-TGT CCT CCA TCT GGG CAT TT-3′), grp78 (forward, 5′-GCC TCA TCG GAC GCA CTT-3′; reverse, 5′-AAC CAC CTT GAA TGG CAA GAA-3′), and β-actin (forward, 5′-GGC TCC CAG CAC CAT GAA-3′; reverse, 5′-GCC ACC GAT CCA CAC AGA GT-3′) were used in qPCR. Relative quantification of gene expression was performed using the comparative threshold method as described by the manufacturer. Changes in gadd7 and grp78 RNA expression levels were calculated following normalization to β-actin expression.
Plasmids and Transient Transfection—gadd7 was cloned by PCR into pcDNA3.1 to generate pcDNA-gadd7. QuikChange II Site-directed Mutagenesis Kit (Stratagene) was used to create three constructs, each with replacement of one gadd7 open reading frame (ORF) stop codon with AgeI and PacI restriction sites. A double-stranded oligo containing three tandem Myc sequences and a stop codon, flanked by AgeI and PacI restriction sites, was generated (IDT) and ligated downstream of the gadd7 ORFs in the three constructs to create in-frame carboxyl-terminal Myc tags. The Myc-tagged NPC2 sequence was generated by PCR and cloned into the ΔU3 vector. All PCR-derived segments were confirmed by sequencing. Cells were transfected with Lipofectamine Plus (Invitrogen) as per the manufacturer's protocol and assayed 48 h post-transfection.
Immunofluorescence and Microscopy—Cells (5 × 10⁵) were plated onto 0.8% gelatin-coated glass coverslips 48 h before transfection with Lipofectamine Plus (Invitrogen). 48 h post-transfection, cells were fixed with 4% paraformaldehyde, permeabolized with Triton X-100, and stained with α-Myc antibody (1:800, clone 9E10, Upstate Biotechnology) and Cy5-coupled donkey α-mouse secondary antibody (1:250, Jackson ImmunoResearch). Fluorescently labeled cells were visualized at ×40 using a Zeiss Axioskop2 microscope, equipped with an AxioCam MR5 camera. The percentage of Myc-labeled cells was determined by quantifying Cy5 fluorescence in 600 green fluorescent protein (GFP)-expressing cells/sample, analyzed in three independent experiments.
Generation of gadd7 shRNA Clones—Hamster gadd7 cDNA sequence (gi: 703070) was used to design siRNA oligonucleotides using Ambion's siRNA Target Finder Program (ambion.com/techlib/misc/siRNA_finder.html). gadd7 sense and antisense siRNA sequences were 5′-GAU GAG AAA GUG CAG UAU UUU-3′ and 5′-AAU ACU GCA CUU UCU CAU CUU-3′, respectively, and scrambled sense and antisense siRNA sequences were 5′-AAG AUG AGC AUA GGA UGU U-3′ and 5′-AAC AUC CUA UGC UCA-3′, respectively. shRNA oligonucleotides were designed from these siRNA sequences and each cloned into a pSilencer 4.1-CMV hygro vector (Ambion) containing a hygromycin resistance cassette. shRNA vectors were transfected into CHO cells with Lipofectamine 2000 reagent (Invitrogen). Cells were plated at limiting dilutions and treated with 0.5 mg/ml hygromycin. Clonal lines were isolated, and gadd7 knockdown assessed by qPCR.
Detection of Reactive Oxygen Species Generation—Cells (1 × 10⁵) were plated in 12-well plates 32 h prior to various treatments. Cells were rinsed with PBS and incubated with PBS containing 0.5 mm MgCl2, 0.92 mm CaCl2, and 3 μm 5-(and-6)-chloromethyl-2′,7′-dichlorodihydrofluorescein diacetate, acetyl ester (CM-H2DCFDA, Invitrogen) in the dark at 37 °C for 1 h. Cells were then rinsed with PBS, harvested by trypsinization, and quenched with culture media. Mean fluorescence was determined by flow cytometry on 104 cells/sample.
xbp-1 mRNA Splicing—Total RNA was isolated from cells using TRIzol reagent (Invitrogen) and reverse transcribed to cDNA using the SuperScript First-strand Synthesis System for RT-PCR (Invitrogen) following the manufacturer's instructions. PCR was performed using hamster xbp-1 primers flanking the xbp-1 splice site as reported previously (33). PCR conditions were denaturation at 95 °C for 3 min, followed by 40 cycles of 94 °C for 1 min, 60 °C for 30 s, and 72 °C for 1 min. PCR products were separated by non-denaturing PAGE on a 3.5% polyacrylamide gel, which was then stained with ethidium bromide.
Immunoblot Analyses—Whole cell protein lysates were prepared using RIPA buffer (50 mm Tris-Cl, 150 mm NaCl, 1% Nonidet P-40, 0.5% sodium deoxycholate, 0.1% SDS, and 5 mm EDTA) containing 1 mm phenylmethylsulfonyl fluoride, 1× Protease Complete inhibitor mixture (Roche), and 1× phosphatase inhibitors I and II (Sigma). Nuclear lysates were prepared using the NE-PER Nuclear and Cytoplasmic Extraction reagents (Pierce Scientific). Proteins (30 μg) were resolved by 12 (for CHOP) or 10% (for JNK) SDS-PAGE gel electrophoresis and transferred to polyvinylidene difluoride membrane (Millipore). Membranes were probed with CHOP (F-168, Santa Cruz Biotechnology, 1:1000), phospho-JNK (9251, Cell Signaling Technology, 1:1000), total JNK (9252, Cell Signaling Technology, 1:1000), β-actin (A 2066, Sigma, 1:2000), and proliferating cell nuclear antigen (F 0167, Sigma, 1:2000) antibodies. Proteins were visualized using appropriate horseradish peroxidase-conjugated secondary antibodies (Jackson ImmunoResearch Laboratories, 1:10,000) and chemiluminescence reagents (PerkinElmer Life Sciences). Band intensities were quantified by densitometry (Quantity One Basic Software).
RESULTS
Disruption of gadd7 Confers Resistance to Lipotoxicity—We carried out a genetic screen in CHO cells using the ROSAβgeo retroviral promoter trap vector to identify genes critical for the lipotoxic response by selecting for mutants in media supplemented with a pathophysiological concentration of palmitate (500 μm palmitic acid complexed to bovine serum albumin at a 2:1 molar ratio) (21). From this screen we isolated mutant cell line 2E1. To characterize 2E1 cells further, we supplemented wild-type (WT) and mutant cells with palmitate or other inducers of cell death and quantified resistance to cell death and apoptosis by PI staining and TUNEL assay, respectively (Fig. 1, A and B). Compared with WT CHO cells, mutant 2E1 cells were significantly resistant to palmitate-induced cell death (WT 70% versus 2E1 16% PI positive) and apoptosis (WT 54% versus 2E1 5% TUNEL positive). This resistance was relatively palmitate-specific, because mutant and WT cells were similarly sensitive to the apoptotic inducers, staurosporine and actinomycin D. These data indicate that mutant 2E1 is not generally resistant to cell death or apoptosis.
FIGURE 1.
Mutant 2E1 is resistant to palmitate-induced cell death and apoptosis. WT and 2E1 mutant cells were incubated with 500 μm palmitate (Palm) for 48 h or 80 nm staurosporine (Staur) and 2 μm actinomycin D (Act D) for 24 h. Cell death was assessed by PI staining and flow cytometry (A) and apoptosis was assessed by TUNEL and flow cytometry (B). Data are expressed as mean ± S.E. for three independent experiments. *, p < 0.005 for 2E1 versus WT. C, autoradiogram shows Southern blot analysis of WT (lanes 1–3) and 2E1 mutant (lanes 4–6) genomic DNA digested with restriction enzymes BglII, NcoI, or XbaI, each of which cuts once within the integrated ROSAβgeo provirus. The blot was probed with a 32P-labeled fragment corresponding to the ROSAβgeo sequence.
Southern blot analysis was used to characterize the insertion of the provirus in the genome of 2E1 cells. DNA from WT and mutant cells was digested with restriction enzymes whose sites are present in the retroviral vector sequence, and analyzed by Southern blot, probing for the ROSAβgeo sequence (Fig. 1C). Only one hybridizing band was observed for each digest, indicating there is a single retroviral integration in mutant 2E1, consistent with the low multiplicity of infection used in the mutagenesis method.
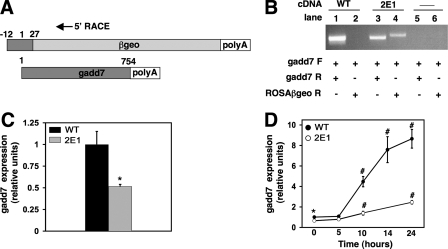
To identify the gene disrupted in mutant 2E1, we performed 5′ RACE using cDNA from the mutant. The sequence obtained corresponds to 39 nucleotides from the 5′ region of the previously identified ncRNA gadd7 (Fig. 2A). We carried out directed PCR using primers to gadd7 and ROSAβgeo to confirm that gadd7 was the site of proviral insertion (Fig. 2B). Using gadd7 forward and ROSAβgeo reverse primers, a PCR product corresponding to the gadd7-retroviral fusion transcript was obtained in mutant cDNA, but not in WT cDNA, demonstrating that the fusion transcript is present only in the mutant cells. A product was obtained in WT and mutant cDNA using gadd7 forward and reverse primers, indicating that both cell types contain at least one WT allele. Although not strictly quantitative, the gadd7 PCR product produced from the mutant cDNA is of a lower intensity. Together with data from Southern blotting, these findings suggest that the provirus disrupted one of two gadd7 alleles in mutant 2E1, creating a model of haploinsufficiency.
FIGURE 2.
Disruption of one gadd7 allele in 2E1 cells leads to decreased gadd7 RNA expression. A, schematic representation of gadd7-retroviral fusion transcript with 5′ RACE primer location and endogenous gadd7 transcript. B, directed PCR was performed on cDNA from WT (lanes 1 and 2) and 2E1 (lanes 3 and 4) cells to detect gadd7 expression (lanes 1 and 3) and fusion transcript (lanes 2 and 4). Negative control reactions (lanes 5 and 6) contained no cDNA. Forward (F) and reverse (R) primers for gadd7 were used in PCR for lanes 1, 3, and 5. Forward gadd7 primer and reverse primer for the proviral sequence (ROSAβgeo) were used in PCR for lanes 2, 4, and 6. C, basal gadd7 RNA expression in WT and 2E1 mutant cells was determined by qPCR and normalized to β-actin RNA expression. *, p < 0.05 for 2E1 versus WT. Data are expressed as mean ± S.E. for three independent experiments. D, WT and 2E1 mutant cells were treated with 500 μm palmitate for the indicated times and gadd7 expression was determined by qPCR and normalized to β-actin RNA expression. *, p < 0.05 for 2E1 versus WT; #, p < 0.01 for treated versus untreated WT cells and for treated 2E1 versus treated WT. Data are expressed as mean ± S.E. for three independent experiments.
To quantitatively assess the level of gadd7 expression in 2E1 cells, basal gadd7 RNA levels were measured in WT and mutant cells by qPCR and values were normalized to β-actin RNA expression (Fig. 2C). Relative to WT cells, gadd7 expression was 50% lower in 2E1 cells, consistent with a model of haploinsufficiency. Because gadd7 expression is increased by various stress stimuli, we asked whether lipotoxic stress affected gadd7 expression. WT and mutant cells were supplemented with palmitate for varying times, and gadd7 expression was measured by qPCR (Fig. 2D). gadd7 expression increased in a time-dependent manner in both WT and mutant cells. However, compared with WT cells, mutant cells expressed lower levels of gadd7 at all time points and the magnitude of induction in mutant cells was substantially diminished. These results indicate that lipotoxic stress is an inducer of gadd7 expression.
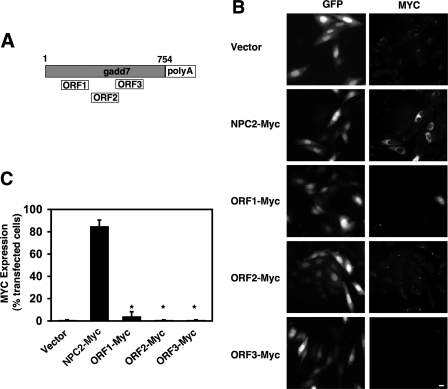
Confirmation of gadd7 as a Non-coding RNA—gadd7 contains three putative small ORFs predicted to encode peptides 38, 37, and 43 amino acids in length (Fig. 3A). In vitro translation studies conducted by two independent groups showed no detectable protein products were produced from gadd7 RNA (29, 30), leading to the classification of gadd7 as a ncRNA. To address the possibility that small peptides might have been missed in SDS-PAGE analyses, we generated gadd7 ORF fusion constructs by replacing each predicted gadd7 stop codon with a triple Myc epitope tag in-frame followed by a stop codon (ORF1-Myc, ORF2-Myc, and ORF3-Myc). The fusion constructs were co-transfected into WT cells along with a construct for GFP, and immunofluorescence was used for detection of fusion peptides (Fig. 3, B and C). Cells were transfected with a Myc-tagged NPC2 construct in parallel for comparison of translation efficiency with a bona fide small ORF of 151 amino acids (34). For ORF1-Myc, sporadic, low level Myc expression was observed in 5% of transfected cells, whereas for NPC2-Myc high level Myc expression was observed in 85% of transfected cells. No expression of the Myc epitope tag was detected in ORF2-Myc or ORF3-Myc transfected cells. The level of epitope tag expression in ORF1-Myc-transfected cells is extremely low, compared with NPC2-Myc-transfected cells and is unlikely to have biological significance. Together, our studies are consistent with a model in which gadd7 functions at the level of RNA.
FIGURE 3.
gadd7 ORFs are not translated. A, schematic representation of gadd7 RNA transcript with three predicted ORFs. B, WT cells were co-transfected with the indicated plasmids and GFP. GFP (left column of images) and epitope-tagged proteins (right column) were detected by immunofluorescence. Images shown are representative of three independent experiments. Bar, 60 μm. C, graph shows percentage of transfected (GFP-positive) cells expressing Myc. Data are mean ± S.E. values from analysis of 200 transfected cells in each of three experiments. *, p < 0.001 ORF-Myc-transfected cells versus NPC2-Myc-transfected cells.
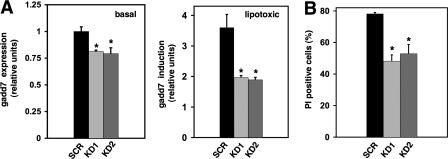
Knockdown of gadd7 Recapitulates Mutant Phenotype—To confirm that disruption of gadd7 expression leads to a lipotoxicity-resistant phenotype, we used shRNA technology to determine whether directed knockdown of gadd7 expression in WT cells recapitulates the palmitate-resistant phenotype. We isolated two independent stable cell lines expressing shRNA directed against gadd7 (KD1 and KD2) and a cell line expressing a scrambled shRNA (SCR). Compared with the SCR control, basal gadd7 expression in KD1 and KD2 cells was decreased 20% (Fig. 4A, left panel). Under lipotoxic conditions, gadd7 expression was decreased 45 and 48% in KD1 and KD2, respectively (Fig. 4A, right panel). Compared with SCR cells, KD1 and KD2 cells were significantly protected from cell death (38 and 32% reduction in PI positivity, respectively, Fig. 4B). These studies provide independent evidence supporting our model in which gadd7 loss of function is protective against lipotoxicity.
FIGURE 4.
gadd7 knockdown recapitulates palmitate-resistant phenotype. Stable cell lines were generated following transfection with a scrambled (SCR) or gadd7 targeting shRNA (KD1 and KD2). A, gadd7 RNA expression was determined by qPCR and normalized to β-actin RNA expression under normal growth conditions (basal) and following treatment with 500 μm palmitate for 10 h (lipotoxic). B, cells were treated with 500 μm palmitate for 48 h and cell death was assessed by PI staining and flow cytometry. All data are expressed as mean ± S.E. for three independent experiments. *, p < 0.05 for KD versus SCR.
gadd7 Functions as a Regulator of Lipid-mediated Oxidative Stress—We next sought to determine where gadd7 acts in the lipotoxic pathway. To assess whether resistance of 2E1 cells to lipotoxicity was due to impairment in the import of FFAs, initial rates of palmitate uptake were measured in WT and 2E1 cells pulsed for 1 min with 14C-labeled palmitate. Levels of palmitate uptake were equivalent in the two cell lines, indicating that resistance to palmitate-induced cell death in 2E1 cells is not due to impaired FFA uptake (supplemental Fig. S1).
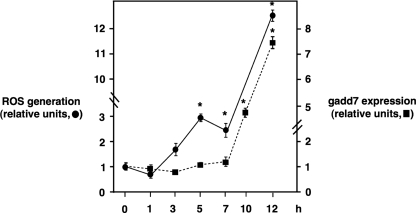
Studies in cultured cells, as well as animal models, have implicated oxidative stress in the pathogenesis of lipotoxicity. Furthermore, H2O2, a ROS precursor, has previously been shown to increase gadd7 expression (29, 30). To investigate whether palmitate-induced ROS generation is upstream of gadd7 expression, we measured levels of ROS and gadd7 RNA in WT cells over a time course of palmitate treatment (Fig. 5). At both 5 and 7 h of palmitate treatment, ROS levels were significantly increased, whereas gadd7 expression remained unchanged relative to untreated cells. After these time points, ROS continued to increase. By contrast, gadd7 levels were not significantly elevated until 10 h following palmitate treatment. These data indicate that palmitate-induced ROS generation occurs before gadd7 expression.
FIGURE 5.
Palmitate-induced ROS generation occurs prior to gadd7 induction. WT cells were treated with 500μm palmitate for the indicated time course and ROS generation was quantified by CM-H2DCFDA labeling and flow cytometry. gadd7 expression was determined by qPCR normalized to β-actin RNA expression. All data are expressed as mean ± S.E. for three independent experiments. *, p < 0.001 palmitate-treated versus untreated.
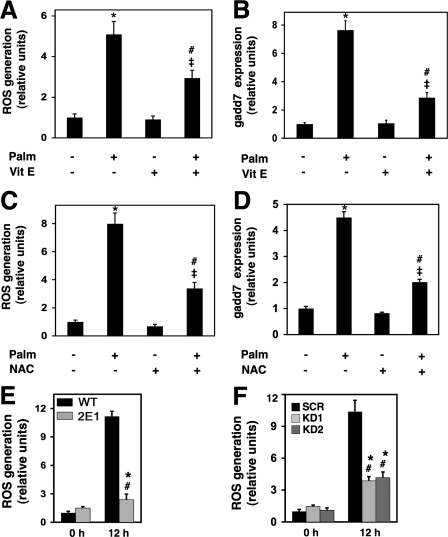
We then sought to determine whether palmitate-induced ROS generation was required for gadd7 expression. We supplemented WT cells with palmitate in the absence and presence of the antioxidants, vitamin E (α-tocopherol) or NAC to deplete ROS. In the presence of vitamin E and NAC, palmitate-induced ROS levels were decreased by 42 and 58% compared with vehicle treated cells, respectively (Figs. 6, A and C). This reduction of ROS resulted in a 62 and 55% decrease in gadd7 expression upon treatment with vitamin E and NAC, respectively (Fig. 6, B and D). These data indicate that lipotoxic stress induces gadd7 expression in a ROS-dependent fashion.
FIGURE 6.
gadd7 is a regulator of palmitate-induced ROS generation. A, WT cells were treated with 500 μm palmitate in the presence or absence of vitamin E (Vit E) for 12 h. ROS generation was quantified by CM-H2DCFDA labeling and flow cytometry. *, p < 0.001 palmitate (Palm)-treated versus untreated; #, p < 0.01 Vit E/palmitate-treated versus Vit E-treated; ‡, p < 0.05 Vit E/palmitate-treated versus palmitate-treated cells. B, WT cells were treated as in A, and gadd7 expression was determined by qPCR normalized to β-actin RNA expression. *, p < 0.001 palmitate-treated versus untreated; #, p < 0.05 Vit E/palmitate-treated versus Vit E-treated; ‡, p < 0.005 for Vit E/palm-treated versus palmitate-treated cells. C, WT cells were treated with 500μm palmitate in the presence or absence of NAC for 12 h. ROS generation was quantified as in A.*, p < 0.001 palmitate-treated versus untreated; #, p < 0.001 NAC/palmitate-treated versus NAC-treated; ‡, p < 0.05 NAC/palmitate-treated versus palmitate-treated cells. D, WT cells were treated as in C, and gadd7 expression was determined by qPCR as in B.*, p < 0.001 palmitate-treated versus untreated; #, p < 0.001 NAC/palmitate-treated versus NAC-treated; ‡, p < 0.001 for NAC/palmitate-treated versus palmitate-treated cells. E,WTand 2E1 cells were treated with palmitate and analyzed for ROS generation as in A.*, p < 0.05 for treated versus untreated mutant cells; #, p < 0.001 for treated mutant versus treated WT cells. F, stable scrambled (SCR) and gadd7 knockdown (KD1 and KD2) cell lines were treated with palmitate and analyzed for ROS generation as in A.*, p < 0.001 for treated versus untreated knockdown cells; #, p < 0.005 for treated knockdown versus treated SCR cells. All data are expressed as mean ± S.E. for three independent experiments.
To determine whether this induction of gadd7 also contributed to the level of oxidative stress in palmitate-treated cells, we measured levels of ROS in WT and 2E1 mutant cells supplemented with palmitate. At baseline, levels of ROS were similar between the two cell types, and ROS increased significantly in both WT and 2E1 cells in response to lipid challenge. However, under lipotoxic conditions, levels of ROS were 77% lower in mutant cells compared with WT cells (Fig. 6E). A similar response was observed in gadd7 knockdown clones (KD1 and KD2), which showed a mean 62% decrease in palmitate-induced ROS compared with SCR cells (Fig. 6F). These findings indicate that gadd7 is a positive regulator of palmitate-induced ROS accumulation. Together with the findings that palmitate-induced ROS generation precedes and is required for gadd7 induction, our data are consistent with a model in which gadd7 serves as a feed-forward regulator of lipid-mediated oxidative stress.
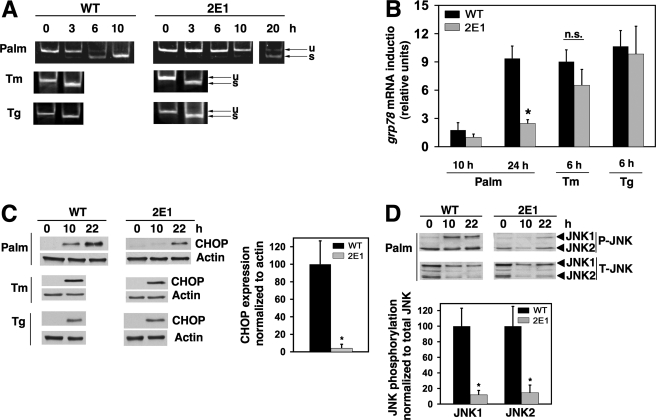
gadd7 Regulates Lipid-mediated ER Stress—Because gadd7 expression amplifies palmitate-induced ROS, and because palmitate-induced ROS contributes to the induction of ER stress, we asked whether gadd7 is required for palmitate-induced ER stress. Splicing of xbp-1 mRNA, an early indicator of the ER stress response, was complete following 10 h of palmitate supplementation in WT cells, but remained incomplete in mutant cells even up to 20 h of treatment (Fig. 7A). Similarly, grp78 mRNA induction was diminished in mutant cells 10 and 24 h following palmitate supplementation (9-fold induction in WT cells versus 2-fold induction in 2E1 cells at 24 h, Fig. 7B). CHOP protein expression and JNK phosphorylation were also diminished and delayed in 2E1 cells (Fig. 7, C and D). Consistent with these findings, cells with knockdown of gadd7 expression also demonstrated delayed and diminished palmitate-induced ER stress (supplemental Fig. S2). These effects of gadd7 were specific for palmitate-induced ER stress. In response to the non-lipid inducers of ER stress, tunicamycin and thapsigargin, splicing of xbp-1 and induction of grp78 mRNA and CHOP protein were indistinguishable between WT and mutant cells (Fig. 7, A–C). Taken together, these data indicate that gadd7 is required for palmitate-induced ER stress.
FIGURE 7.
gadd7 is necessary for palmitate-induced ER stress. WT and 2E1 cells were incubated with 500 μm palmitate, 1 μm thapsigargin (Tg), or 2.5 μg/ml tunicamycin (Tm) for the indicated times. A, cDNA was synthesized and used for PCR with primers specific for the region of xbp-1 that is spliced during ER stress induction. PCR products were separated by non-denaturing PAGE, followed by EtBr staining. Gel shown is representative of three independent experiments, with arrows indicating xbp-1 unspliced (u) and spliced (s) species. B, Grp78 RNA expression in WT and 2E1 mutant cells was determined by qPCR and is reported normalized to β-actin RNA expression. Data are expressed as mean ± S.E. for three independent experiments, *, p < 0.01 palmitate-treated 2E1 versus treated WT. n.s., not significant. C, cell lysates were analyzed by Western blot probed for CHOP and β-actin proteins. Blots shown are representative of three independent experiments. Graph shows quantification of CHOP expression normalized toβ-actin. Data are expressed as mean ± S.E. for three independent experiments, *, p < 0.05 for 2E1 versus WT. D, cell lysates were analyzed by Western blot probed for phosphorylated (P-JNK) and total (T-JNK) JNK proteins. A representative blot is shown. Graph shows quantification of phosphorylated JNK1 and JNK2 normalized to total JNK1 and JNK2, respectively. Data are expressed as mean ± S.E. for three independent experiments, *, p < 0.05 for 2E1 versus WT.
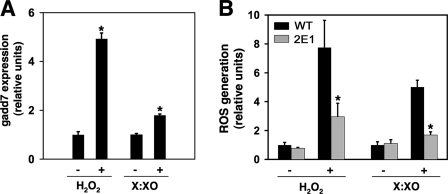
gadd7 Is a Regulator of General Oxidative Stress—Our data indicate that gadd7 plays a critical role in lipid-mediated oxidative stress and the downstream induction of ER stress and cell death. Because gadd7 is up-regulated not only by palmitate, but also by non-lipid inducers of oxidative stress, we sought to investigate whether gadd7 is a regulator of general oxidative stress (27, 28). To address this, WT and mutant cells were treated with H2O2 or with xanthine and xanthine oxidase (X:XO) and gadd7 expression and ROS accumulation were measured. In the presence of H2O2 and X:XO, gadd7 expression was induced 5- and 2-fold, respectively (Fig. 8A). ROS increased significantly in both treated WT and 2E1 cells, but the level of ROS accumulation in 2E1 cells was decreased by 62% with H2O2 and 66% with X:XO compared with WT cells (Fig. 8B). These data indicate that gadd7 is up-regulated by non-lipid inducers of oxidative stress and is required for the amplification of ROS.
FIGURE 8.
gadd7 regulates general ROS amplification. A, WT cells were treated with 1 mm H2O2 or 100 μm xanthine and 150 microunits/ml xanthine oxidase (X:XO) for 4 h. gadd7 expression was determined by qPCR and is reported normalized to β-actin RNA expression. All data are expressed as mean ± S.E. for a minimum of 6 measures per condition. *, p < 0.005 for treated versus untreated cells. B, WT and 2E1 cells were treated with 2.3 mm H2O2 or 100 μm xanthine and 15 microunits/ml xanthine oxidase for 30 min or 2 h, respectively. Generation of ROS was measured by CM-H2DCFDA labeling and flow cytometry. All data are expressed as mean ± S.E. for three independent experiments. *, p < 0.05 for treated 2E1 versus treated WT.
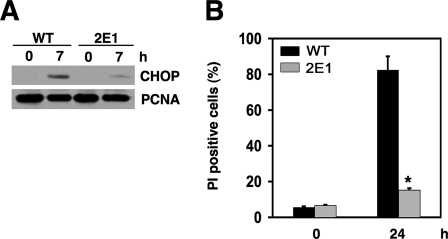
We next investigated whether gadd7 was required for ROS-induced ER stress and cell death. In the presence of H2O2, CHOP protein expression was decreased in mutant cells compared with WT cells, consistent with a block in ER stress induction (Fig. 9A). Moreover, mutant cells were resistant to ROS-induced cell death as assessed by PI staining (Fig. 9B). These findings indicate that gadd7 is a regulator of ROS-induced ER stress and cell death.
FIGURE 9.
gadd7 is necessary for ROS-induced ER stress and cell death. A, WT and 2E1 cells were treated with 2.3 mm H2O2. Nuclear cell lysates were analyzed by Western blot for CHOP and proliferating cell nuclear antigen proteins. Blots shown are representative of three independent experiments. B, cells were treated as in A for 24 h. Cell death was assessed by PI staining and flow cytometry. All data are expressed as mean ± S.E. for three independent experiments. *, p < 0.001 for treated 2E1 versus treated WT.
DISCUSSION
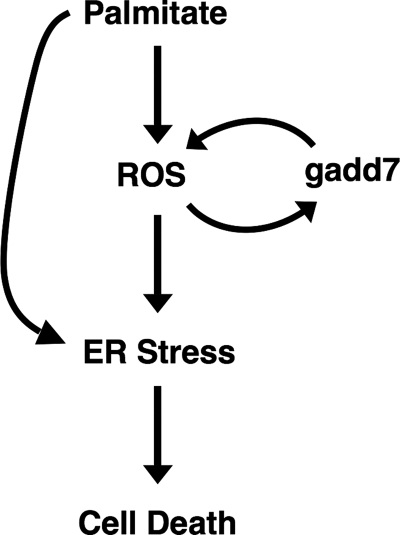
Oxidative and ER stress are integral to the cellular response to lipid metabolic stress. To understand the molecular mechanism whereby excess lipid contributes to cell dysfunction and cell death, we conducted a genetic screen in CHO cells that led to isolation of a mutant with a disruption of one allele of gadd7. Here we report that gadd7 is a regulator of lipotoxicity and is necessary for lipid-induced cell death. Palmitate induces gadd7 in a ROS dependent fashion; however, the further amplification of these ROS is dependent upon induction of gadd7, suggesting that gadd7 functions in a feed-forward loop with ROS in response to lipid overload (Fig. 10). Furthermore, during lipid overload, induction of gadd7 is necessary for the downstream activation of ER stress and subsequent cell death.
FIGURE 10.
Model of the role of gadd7 in the lipotoxic response. Excess palmitate leads to generation of ROS, which in turn activates the ER stress response. Palmitate may also act directly on the ER through remodeling of ER membrane lipids (28). Oxidative stress generated by palmitate induces expression of gadd7, which plays a role in amplifying oxidative stress and in turning on the ER stress response following oxidative stress. Oxidative stress, ER stress, and induction of gadd7 all contribute to palmitate-induced cell death.
Cellular oxidative stress can be initiated not only by lipids, but also by ROS precursors such as H2O2, nitric oxide, and cytokines such as tumor necrosis factor α. ROS generated by each of these mechanisms induces ER stress (21, 26, 27, 35–37). However, the precise mechanisms linking ROS production to activation of the ER stress response remain to be resolved. Our data show that gadd7 participates in a feed-forward loop with ROS generated by both lipid and non-lipid stimuli and that gadd7 loss-of-function significantly diminishes generalized ROS-induced ER stress and cell death. These data suggest that gadd7 is a key mediator of ROS-induced cellular damage. It remains to be determined how ROS induce gadd7. However, H2O2 and X:XO are both known to increase intracellular calcium levels. Moreover, it was previously shown that induction of gadd7 by H2O2 requires intracellular calcium (38). Together these data suggest that ROS may induce gadd7 through a calcium-dependent signaling mechanism. Overexpression of gadd7 in WT cells does not further amplify the response to lipotoxic stress or H2O2 (not shown), suggesting that induction of gadd7 under these circumstances is already sufficient to achieve a maximal response. Furthermore, gadd7 overexpression alone in the absence of a lipid (or non-lipid) source of ROS does not increase cellular ROS levels or induce ER stress (not shown). It is likely that gadd7 RNA acts in concert with other cellular signals generated by ROS.
Given the absence of an ORF of greater than 43 amino acids, gadd7 has been hypothesized to function as a ncRNA, a model supported by the absence of a detectable in vitro translation product (29, 30). Computational analyses of sequence conservation and codon structure also support this model. None of the three short ORFs of gadd7 have significant homology to known proteins, and whereas the predicted 28-amino acid peptide from ORF1 shares 50% homology with a predicted amino acid sequence of a murine EST clone, there is substantially greater conservation at the nucleotide level for this region (71%). The greater homology of nucleotide sequence over the amino acid sequence observed in gadd7 is a hallmark of ncRNAs (39–41). Additionally, examination of the predicted codon structures of ORF1 and the predicted amino acid sequence of the murine EST clone show a lack of conserved codon structure. Moreover, our studies demonstrate that none of the gadd7 ORFs is efficiently translated. Disruption of low-level translation of ORF1 is unlikely to account for the robust phenotype in the haploinsufficient 2E1 cells. gadd7 belongs to a large class of non-coding RNAs, described as long or mRNA-like ncRNAs, which are found in species from Drosophila to humans (39, 42–44). Recent reports suggest that for long ncRNAs, greater conservation exists in the predicted secondary structure, because this is more highly conserved than the nucleotide sequence (42). Thus, mouse or human orthologs of gadd7 are unlikely to be identified based on sequence conservation alone. Future studies will need to combine analysis of secondary structure, identification of small conserved nucleotide motifs, and functional assays to delineate gadd7 orthologs in these other species.
Over the past decade, transcriptional profiling and expression analyses have uncovered a large number of ncRNAs. Although the cellular functions for a few ncRNAs have been described, the specific roles for the vast majority of ncRNA species are unknown. Here we describe gadd7 as the first ncRNA to link oxidative stress to ER stress and the only long ncRNA to be implicated in oxidative stress. The precise molecular mechanisms of action of long ncRNAs such as gadd7 are presently unknown. It has been proposed that ncRNAs may serve as cellular rheostats, providing a previously unappreciated layer of fine regulation of gene expression (45). Future studies will be necessary to ascertain whether gadd7 acts at the level of RNA-RNA interactions or RNA-protein interactions and to identify the downstream targets that it regulates.
Supplementary Material
Acknowledgments
We thank Jeff Harp and Sarah Lewis for technical help.
This work was supported, in whole or in part, by National Institutes of Health Grant DK064989 (to J. E. S.) and Predoctoral Fellowship DK077583 (to R. T. B.). This work was also supported by Burroughs Wellcome Foundation Grant 1005935 (to J. E. S.). The costs of publication of this article were defrayed in part by the payment of page charges. This article must therefore be hereby marked “advertisement” in accordance with 18 U.S.C. Section 1734 solely to indicate this fact.
The on-line version of this article (available at http://www.jbc.org) contains supplemental Figs. S1 and S2.
Footnotes
The abbreviations used are: FFA, free fatty acid; gadd7, growth arrested DNA-damage inducible gene 7; ROS, reactive oxygen species; ER, endoplasmic reticulum; CHO, Chinese hamster ovary; ncRNA, non-coding RNA; WT, wild type; PI, propidium iodide; TUNEL, terminal uridine deoxynucleotidyl transferase dUTP nick end labeling; RACE, rapid amplification of cDNA ends; qPCR, quantitative PCR; ORF, open reading frame; NPC2, Niemann-Pick type C2; GFP, green fluorescent protein; SCR, scrambled; KD, knockdown; NAC, N-acetyl cysteine; X:XO, xanthine and xanthine oxidase; CM-H2DCFDA, 5- (and -6)-chloromethyl-2′,7′-dichlorodihydrofluorescein diacetate acetyl ester; PBS, phosphate-buffered saline; siRNA, small interfering RNA; shRNA, short hairpin RNA; JNK, c-Jun NH2-terminal kinase.
References
- 1.Nollen, E. A., and Morimoto, R. I. (2002) J. Cell Sci. 115 2809–2816 [DOI] [PubMed] [Google Scholar]
- 2.Zhang, K., and Kaufman, R. J. (2004) J. Biol. Chem. 279 25935–25938 [DOI] [PubMed] [Google Scholar]
- 3.Unger, R. H. (2002) Annu. Rev. Med. 53 319–336 [DOI] [PubMed] [Google Scholar]
- 4.Leichman, J. G., Aguilar, D., King, T. M., Vlada, A., Reyes, M., and Taegtmeyer, H. (2006) Am. J. Clin. Nutr. 84 336–341 [DOI] [PubMed] [Google Scholar]
- 5.Sharma, S., Adrogue, J. V., Golfman, L., Uray, I., Lemm, J., Youker, K., Noon, G. P., Frazier, O. H., and Taegtmeyer, H. (2004) FASEB J. 18 1692–1700 [DOI] [PubMed] [Google Scholar]
- 6.Szczepaniak, L. S., Dibbins, R. L., Metzger, G. J., Sartoni-D'Ambrosia, G., Arbique, D., Vongpatanasin, W., Unger, R., and Victor, R. G. (2003) Magn. Reson. Med. 49 417–423 [DOI] [PubMed] [Google Scholar]
- 7.Christoffersen, C., Bollano, E., Lindegaard, M. L. S., Bartels, E. D., Goetze, J. P., Andersen, C. B., and Nielsen, L. B. (2003) Endocrinology 144 3483–3490 [DOI] [PubMed] [Google Scholar]
- 8.Young, M. E., Guthrie, P. H., Razeghi, P., Leighton, B., Abbasi, S., Patil, S., Youker, K. A., and Taegtmeyer, H. (2002) Diabetes 51 2587–2595 [DOI] [PubMed] [Google Scholar]
- 9.Mazumder, P. K., O'Neill, B. T., Roberts, M. W., Buchanan, J., Yun, U. J., Cooksey, R. C., Boudina, S., and Abel, E. D. (2004) Diabetes 53 2366–2374 [DOI] [PubMed] [Google Scholar]
- 10.Belke, D. D., Larsen, T. S., Gibbs, M., and Severson, D. L. (2000) Am. J. Physiol. 279 E1104–E1113 [DOI] [PubMed] [Google Scholar]
- 11.Finck, B. N., Han, X., Courtois, M., Aimond, F., Nerbonne, J. M., Kovacs, A., Gross, R. W., and Kelly, D. P. (2003) Proc. Natl. Acad. Sci. U. S. A. 100 1226–1231 [DOI] [PMC free article] [PubMed] [Google Scholar]
- 12.Chiu, H. C., Kovacs, A., Ford, D. A., Hsu, F. F., Garcia, R., Herrero, P., Saffitz, J. E., and Schaffer, J. E. (2001) J. Clin. Investig. 107 813–822 [DOI] [PMC free article] [PubMed] [Google Scholar]
- 13.Shimabukuro, M., Zhou, Y. T., Levi, M., and Unger, R. H. (1998) Proc. Natl. Acad. Sci. U. S. A. 95 2498–2502 [DOI] [PMC free article] [PubMed] [Google Scholar]
- 14.Ji, J., Zhang, L., Wang, P., Mu, Y. M., Zhu, X. Y., Wu, Y. Y., Yu, H., Zhang, B., Chen, S. M., and Sun, X. Z. (2005) Exp. Toxicol. Pathol. 56 369–376 [DOI] [PubMed] [Google Scholar]
- 15.Browning, J. D., and Horton, J. D. (2004) J. Clin. Investig. 114 147–152 [DOI] [PMC free article] [PubMed] [Google Scholar]
- 16.Darmaun, D., Smith, S. D., Sweeten, S., Sager, B. K., Welch, S., and Mauras, N. (2005) Diabetes 54 190–196 [DOI] [PubMed] [Google Scholar]
- 17.Houstis, N., Rosen, E. D., and Lander, E. S. (2006) Nature 440 944–948 [DOI] [PubMed] [Google Scholar]
- 18.Furukawa, S., Fujita, T., Shimabukuro, M., Iwaki, M., Yamada, Y., Nakajima, Y., Nakayama, O., Makishima, M., Matsuda, M., and Shimomura, I. (2004) J. Clin. Investig. 114 1752–1761 [DOI] [PMC free article] [PubMed] [Google Scholar]
- 19.Ye, G., Metreveli, N. S., Donthi, R. V., Xia, S., Xu, M., Carlson, E. C., and Epstein, P. N. (2004) Diabetes 53 1336–1343 [DOI] [PubMed] [Google Scholar]
- 20.Ozcan, U., Cao, Q., Yilmaz, E., Lee, A. H., Iwakoshi, N. N., Ozdelen, E., Tuncman, G., Gorgun, C., Glimcher, L. H., and Hotamisligil, G. S. (2004) Science 306 457–461 [DOI] [PubMed] [Google Scholar]
- 21.Borradaile, N. M., Buhman, K. K., Listenberger, L. L., Magee, C. J., Morimoto, E. T., Ory, D. S., and Schaffer, J. E. (2006) Mol. Biol. Cell 17 770–778 [DOI] [PMC free article] [PubMed] [Google Scholar]
- 22.Wang, D., Wei, Y., and Pagliassotti, M. J. (2006) Endocrinology 147 943–951 [DOI] [PubMed] [Google Scholar]
- 23.Cacicedo, J. M., Benjachareowong, S., Chou, E., Ruderman, N. B., and Ido, Y. (2005) Diabetes 54 1838–1845 [DOI] [PubMed] [Google Scholar]
- 24.Inoguchi, T., Li, P., Umeda, F., Yu, H. Y., Kakimoto, M., Imamura, M., Aoki, T., Etoh, T., Hashimoto, T., Naruse, M., Sano, H., Utsumi, H., and Nawata, H. (2000) Diabetes 49 1939–1945 [DOI] [PubMed] [Google Scholar]
- 25.Listenberger, L. L., Ory, D. S., and Schaffer, J. E. (2001) J. Biol. Chem. 276 14890–14895 [DOI] [PubMed] [Google Scholar]
- 26.Wei, Y., Wang, D., Topczewski, F., and Pagliassotti, M. J. (2006) Am. J. Physiol. 291 E275–E281 [DOI] [PubMed] [Google Scholar]
- 27.Karaskov, E., Scott, C., Zhang, L., Teodoro, T., Ravazzola, M., and Volchuk, A. (2006) Endocrinology 147 3398–3407 [DOI] [PubMed] [Google Scholar]
- 28.Borradaile, N. M., Han, X., Harp, J. D., Gale, S. E., Ory, D. S., and Schaffer, J. E. (2006) J. Lipid Res. 47 2726–2737 [DOI] [PubMed] [Google Scholar]
- 29.Crawford, D. R., Schools, G. P., Salmon, S. L., and Davies, K. J. (1996) Arch. Biochem. Biophys. 325 256–264 [DOI] [PubMed] [Google Scholar]
- 30.Hollander, M. C., Alamo, I., and Fornace, A. J., Jr. (1996) Nucleic Acids Res. 24 1589–1593 [DOI] [PMC free article] [PubMed] [Google Scholar]
- 31.Friedrich, G., and Soriano, P. (1991) Genes Dev. 5 1513–1523 [DOI] [PubMed] [Google Scholar]
- 32.Ory, D. S., Neugeboren, B. A., and Mulligan, R. C. (1996) Proc. Natl. Acad. Sci. U. S. A. 93 11400–11406 [DOI] [PMC free article] [PubMed] [Google Scholar]
- 33.Sorensen, S., Ranheim, T., Bakken, K. S., Leren, T. P., and Kulseth, M. A. (2006) J. Biol. Chem. 281 468–476 [DOI] [PubMed] [Google Scholar]
- 34.Naureckiene, S., Sleat, D. E., Lackland, H., Fensom, A., Vanier, M. T., Wattiaux, R., Jadot, M., and Lobel, P. (2000) Science 290 2298–2301 [DOI] [PubMed] [Google Scholar]
- 35.Scorrano, L., Oakes, S. A., Opferman, J. T., Cheng, E. H., Sorcinelli, M. D., Pozzan, T., and Korsmeyer, S. J. (2003) Science 300 135–139 [DOI] [PubMed] [Google Scholar]
- 36.Xu, W., Liu, L., Charles, I. G., and Moncada, S. (2004) Nat. Cell Biol. 6 1129–1134 [DOI] [PubMed] [Google Scholar]
- 37.Xue, X., Piao, J. H., Nakajima, A., Sakon-Komazawa, S., Kojima, Y., Mori, K., Yagita, H., Okumura, K., Harding, H., and Nakano, H. (2005) J. Biol. Chem. 280 33917–33925 [DOI] [PubMed] [Google Scholar]
- 38.Crawford, D. R., Schools, G. P., and Davies, K. J. (1996) Arch. Biochem. Biophys 329 137–144 [DOI] [PubMed] [Google Scholar]
- 39.Inagaki, S., Numata, K., Kondo, T., Tomita, M., Yasuda, K., Kanai, A., and Kageyama, Y. (2005) Genes Cells 10 1163–1173 [DOI] [PubMed] [Google Scholar]
- 40.Lin, R., Maeda, S., Liu, C., Karin, M., and Edgington, T. S. (2007) Oncogene 26 851–858 [DOI] [PubMed] [Google Scholar]
- 41.Tiedge, H., Chen, W., and Brosius, J. (1993) J. Neurosci. 13 2382–2390 [DOI] [PMC free article] [PubMed] [Google Scholar]
- 42.Mercer, T. R., Dinger, M. E., Sunkin, S. M., Mehler, M. F., and Mattick, J. S. (2008) Proc. Natl. Acad. Sci. U. S. A. 105 716–721 [DOI] [PMC free article] [PubMed] [Google Scholar]
- 43.Ravasi, T., Suzuki, H., Pang, K. C., Katayama, S., Furuno, M., Okunishi, R., Fukuda, S., Ru, K., Frith, M. C., Gongora, M. M., Grimmond, S. M., Hume, D. A., Hayashizaki, Y., and Mattick, J. S. (2006) Genome Res. 16 11–19 [DOI] [PMC free article] [PubMed] [Google Scholar]
- 44.Tupy, J. L., Bailey, A. M., Dailey, G., Evans-Holm, M., Siebel, C. W., Misra, S., Celniker, S. E., and Rubin, G. M. (2005) Proc. Natl. Acad. Sci. U. S. A. 102 5495–5500 [DOI] [PMC free article] [PubMed] [Google Scholar]
- 45.Mattick, J. S., and Makunin, I. V. (2006) Hum. Mol. Genet. 15 R17–R29 [DOI] [PubMed] [Google Scholar]
Associated Data
This section collects any data citations, data availability statements, or supplementary materials included in this article.


