Abstract
Activity of the epithelial Na+ channel (ENaC) is modulated by Na+ self-inhibition, an allosteric down-regulation of channel open probability by extracellular Na+. We searched for determinants of Na+ self-inhibition by analyzing changes in this inhibitory response resulting from specific mutations within the extracellular domains of mouse ENaC subunits. Mutations at γMet438 altered the Na+ self-inhibition response in a substitution-specific manner. Fourteen substitutions (Ala, Arg, Asp, Cys, Gln, Glu, His, Ile, Phe, Pro, Ser, Thr, Tyr, and Val) significantly suppressed Na+ self-inhibition, whereas three mutations (Asn, Gly, and Leu) moderately enhanced the inhibition. Met to Lys mutation did not alter Na+ self-inhibition. Mutations at the homologous site in the α subunit (G481A, G481C, and G481M) dramatically increased the magnitude and speed of Na+ self-inhibition. Mutations at the homologous βAla422 resulted in minimal or no change in Na+ self-inhibition. Low, high, and intermediate open probabilities were observed in oocytes expressing αG481Mβγ, αβγM438V, and αG481M/βγM438V, respectively. This pair of residues map to theα5 helix in the extracellular thumb domain in the chicken acid sensing ion channel 1 structure. Both residues likely reside near the channel surface because both αG481Cβγ and αβγM438C channels were inhibited by an externally applied and membrane-impermeant sulfhydryl reagent. Our results demonstrate that αGly481 and γMet438 are functional determinants of Na+ self-inhibition and of ENaC gating and suggest that the thumb domain contributes to the channel gating machinery.
Maintenance of body fluid volume homeostasis requires a collaborative interaction of many Na+ transport mechanisms. Na+ transport in epithelia that line the late distal convoluted tubule, connecting tubule, and collecting tubule relies on apical Na+ entry through epithelial Na+ channels (ENaC).4 Gain-of-function and loss-of-function ENaC mutations in humans result in Liddle syndrome and pseudohypoaldosteronism type I, respectively (1). ENaC activity is regulated by a variety of factors that primarily alter channel density at plasma membrane, open probability (Po), or both. ENaC gating is characterized by long open and close time in the range of up to minutes and a highly variable Po, although channels with brief open (on the order of tens of ms) and long close times have also been observed (2, 3). Although previous studies have identified several regions that appear to have a role in ENaC gating, the mechanism of ENaC gating is not well understood. It is now well established that ENaC undergoes a reduction in Po as a result of Na+ binding to extracellular component(s) within the channel complex, a process referred to as Na+ self-inhibition (4–6). Recent studies have revealed specific characteristics and have identified several sites that have a functional role in Na+ self-inhibition (4, 6–8). However, detailed elements regarding its mechanism have not been revealed.
A logical place to search for structural elements associated with Na+ self-inhibition is the large extracellular domain (ECD) that connects the two transmembrane domains (M1 and M2) within each ENaC subunit. The ECD likely exists as well structured subdomains with 16 conserved Cys residues. We recently reported that point mutations at multiple α and γ ECD Cys residues blunted Na+ self-inhibition, and certain double or triple mutations rendered ENaC insensitive to high concentration of extracellular Na+. These results suggest that multiple Cys residues are required to establish the proper tertiary structure permitting this allosteric regulation (9). In addition, the N-terminal portion of ECD contains γHis239, a previously identified residue critical for Na+ self-inhibition, as well as defined protease cleavage sites (4, 10–12). Various proteases have been shown to regulate ENaC activity, in part, by interfering with Na+ self-inhibition (6, 7, 13).
The resolved high resolution structure of the chicken acid-sensing ion channel 1 (cASIC1) revealed an extracellular domain with a highly organized structure characterized by β sheets within a core embedded within peripheral α helices (14). These helices form the finger, thumb, and knuckle domains, whereas two bundles of long and short β-sheets occupy the palm and β-ball domains. Given the similarities in amino acid sequences and biophysical properties among ASIC and other members of ENaC/degenerin family, it is very likely that ENaC subunits adopt a similar overall tertiary structure, although considerable differences likely exist within local structures, particularly for poorly conserved regions that likely contribute to differences in the biophysical properties of ASIC and ENaC. Additional evidence supporting the notion that ECDs of ASIC and ENaC share a similar overall structure is that the disulfide bridges proposed for the ECD of α ENaC, based on mutational analyses and chemical modifications, match the disulfide bonds within the cASIC1 structure (9, 14).
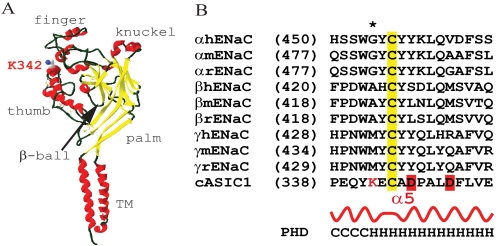
In searching for additional determinants for Na+ self-inhibition and ENaC gating, we observed a significant suppression of this inhibitory response by a mutation of a Met residue (M438A) within the second cysteine-rich domain in ECD of γENaC. The γMet438 is near the 13th conserved Cys (γCys440) whose mutation leads to significant suppression of Na+ self-inhibition (9). Sequence alignments placed this residue at a site corresponding to Lys342 within cASIC1, which is located at the N-terminal part of helix α5, one of the two helices that comprise the thumb domain (Fig. 1). The thumb domain within cASIC1 was proposed to interact with other parts of the extracellular domains during proton gating of the channel (14). In this study we performed mutagenesis analyses to assess the functional role of γMet438 and its homologous residues in α and β ENaC in Na+ self-inhibition.
FIGURE 1.
Location of αGly481/γMet438. A, structure of chain A of cASIC1 is drawn from Protein Data Bank coordinates (2QTS) with a DeepView/Swiss-PDB-Viewer v3.7. Solvent molecules and the bound chloride ion are not shown. Backbone is shown in ribbons with coloring according to secondary structures: helix in red, β-sheet in yellow, and coiled in dark green. Residue Lys342 is displayed in the CPK color scheme and labeled. B, sequence alignments of human (h), mouse (m), and rat (r) ENaC subunits and cASIC1 were performed with Vector NTI v10 (Invitrogen), and only the α5 regions are shown. The sequence numbers of the first residues in the alignments are shown in parentheses. Lys342 is shown a red letter K, and the potential proton binding sites are highlighted in red. The asterisk identifies αGly481, βAla422, and γMet438 in mENaC studied in this report. Secondary structures from cASIC1 (Protein Data Bank code 2QTS) and predicted for ENaCs by PHD (profile network from Heidelberg) algorithm are shown in curve and letters (C for coiled and H for helical), respectively.
EXPERIMENTAL PROCEDURES
Site-directed Mutagenesis and in Vitro Transcription— Mouse α, β, and γ ENaC cDNAs in pBluescript SK-vector (Stratagene, La Jolla, CA) were used as templates to generate point mutations using a PCR-based method as previously described (15). Target mutations were confirmed by direct sequencing. The complementary RNAs (cRNAs) for wild type (WT) and mutant ENaC subunits were synthesized with T3 RNA polymerase (Ambion, Inc.), purified with an RNA purification kit (Qiagen Inc., Valencia, CA), and quantitated by spectrophotometry and density analyses of the RNA band in a denaturing agarose gel.
ENaC Expression and Two-electrode Voltage Clamp—ENaC expression in Xenopus oocytes and current measurements by two-electrode voltage clamp were performed as previously reported (15). Defolliculated oocytes were injected with 50 nl/cell of mixed cRNAs containing 1 ng of cRNA for each mENaC subunit (α, β, and γ) and incubated at 18 °C in modified Barth's saline (88 mm NaCl, 1 mm KCl, 2.4 mm NaHCO3, 15 mm HEPES, 0.3 mm Ca (NO3)2, 0.41 mm CaCl2, 0.82 mm MgSO4, 10 μg/ml sodium penicillin, 10 μg/ml streptomycin sulfate, 100 μg/ml gentamycin sulfate, pH 7.4). All of the experiments were performed 20–50 h following cRNA injections at room temperature (20–24 °C). The oocytes were placed in an oocyte recording chamber from Warner Instruments (Hamden, CT) and perfused with constant flow rate of 12–15 ml/min. Voltage clamp was performed using TEV-200 Voltage Clamp amplifier (Dagan Corp.) and DigiData 1322A interface controlled by pClamp 9 (Molecular Devices Corporation, Sunnyvale, CA).
Procedures for Observing Na+ Self-inhibition—To examine Na+ self-inhibition, a low Na+ bath solution (NaCl-1; containing 1 mm NaCl, 109 mm N-methyl-d-glucamine, 2 mm KCl, 2 mm CaCl2, 10 mm HEPES, pH 7.4) was replaced rapidly by a high Na+ bath solution (NaCl-110; containing 110 mm NaCl, 2 mm KCl, 2 mm CaCl2, 10 mm HEPES, pH 7.4), whereas the oocytes were continuously clamped to -60 or -100 mV as indicated. Bath solution exchange was performed with a 6-channel Teflon valve perfusion system from Warner Instruments. At the end of the experiment, 10 μm amiloride was added to the bath to determine the amiloride-insensitive component of the whole cell current. Currents remaining in the presence of 10 μm amiloride were generally less than 200 nA. The results from oocytes that showed unusually large amiloride-insensitive currents (>5% of total currents) were discarded to minimize current contamination from endogenous channels and membrane leak. Given the well known variability of Xenopus oocyte expression system and our initial observation that the Na+ self-inhibition responses of WT αβγ mENaCs varied moderately among different batches of oocytes, despite a very small variation in the response within the same batch of oocytes, the responses of WT channels were always examined with mutants in the same batch of oocytes in an alternating manner.
The first 40 s of current decay was fit with an exponential equation by Clampfit 9.0 (Axon Instruments Inc.). The peak current (Ipeak) was the measured maximal inward current immediately after bath solution exchange from low Na+ to high Na+ concentration. The steady state current (Iss) represented the measured current at 40 s post Ipeak. The current ratio of Iss/Ipeak was calculated from amiloride-sensitive Iss and Ipeak obtained by subtracting amiloride-insensitive currents from Iss and Ipeak.
Analysis of Na+ Binding Affinity—To estimate the Michaelis constant (Km) for the Na+ concentration-current relationship, both Ipeak and Iss were measured in the same cell after the bath Na+ concentration was raised from 1 to 3, 10, 30, 60, 90, or 110 mm. Ipeak and Iss were plotted against [Na+]. Km and Vmax (maximal current) were obtained by best fit of the current-concentration data according to the following equation, with least squares nonlinear curve fitting using Origin Pro 7.5 (OriginLab Corporation, Northampton, MA): I = Vmax · C/(C + Km). In the equation, I is the relative Ipeak or Iss, and C refers to the [Na+] used to initiate self-inhibition. The apparent inhibitory constant (Ki) of Na+ self-inhibition was estimated by fitting Iss and [Na+] data with an equation for substrate inhibition of enzymes (16): Iss = Vmax · C/(Km + C + C2/Ki).
Single Channel Recordings—The oocytes were placed in a hypertonic solution (NaCl-110 supplemented with 200 mm sucrose) for 5 min, and the vitelline membranes were removed manually. The oocytes were then transferred to a recording chamber with NaCl-110 and maintained for at least 20 min at room temperature (22–25 °C) before recordings. Pipette solution was the same as bath solution (NaCl-110). Patch pipettes with a tip resistance of 5–10 MΩ were used. Patch clamp in the cell-attached configuration was performed using PC-One Patch Clamp amplifier (Dagan Corp.) and a DigiData 1322A interface connected to a PC. The patches were clamped at membrane potentials (negative value of pipette potentials) of -40 to -100 mV. Software pClamp 8 or 10 (Molecular Devices Corporation) was used for data acquisition and analyses. Single channel recordings were acquired at 5 kHz, filtered at 300 Hz by a 4-pole low pass Bessel Filter built in the amplifier, and stored on the hard disk. Open probability was estimated by single channel search function of pClamp 10 from recordings that contained no more than three current levels at a clamping membrane potential of -100 mV and lasted for at least 2 min. The voltages were not corrected by the junction potential.
Chemicals—2-(Trimethylammonium) ethyl methanethiosulfonate bromide (MTSET) was from Toronto Research Chemicals Inc. All of the other reagents were from Sigma. MTSET was aliquoted in powder and dissolved in bath solution immediately prior to application to avoid hydrolysis.
Statistical Analysis—The data are presented as the means ± S.E. Significance comparisons between groups were performed with Student's t tests. A p value of less than 0.05 was considered statistically different.
RESULTS
Residue γMet438 is not well conserved in ENaC subunits or other ENaC/degenerin members, although its neighboring residues are conserved at a similar degree to the overall homology among ENaC subunits (∼35%; Fig. 1B). Its corresponding residues are Gly in α, Ala in β, and Lys in most ASIC isoforms. The region harboring γMet438 aligns to a helix (α5) within the thumb domain of cASIC1 (Fig. 1A), where its homologous residue is Lys342 (Fig. 1A). We examined the potential role of γMet438 and its counterparts in the α and β subunits in Na+ self-inhibition and ENaC gating by analyzing αβγ mouse ENaCs with introduced point mutations.
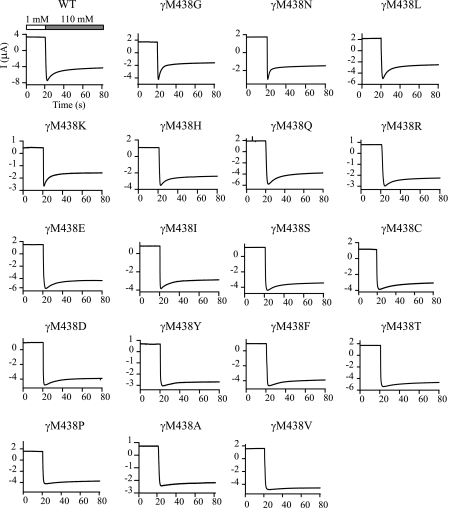
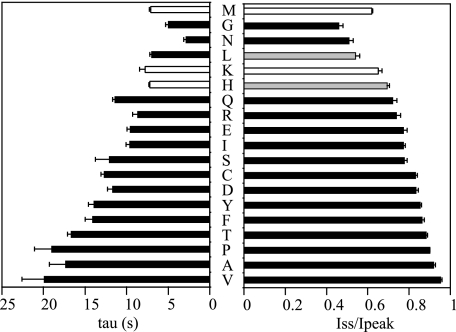
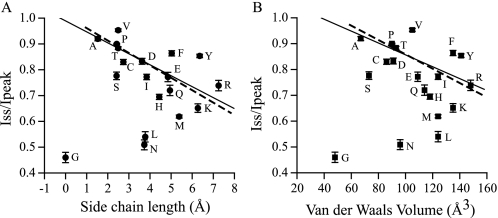
Mutations at γMet438 Alter the Na+ Self-inhibition Response in a Residue-dependent Manner— γMet438 was mutated to 18 different amino acids. Co-expression of all mutant mouse γENaC subunits with WT mouse α and β subunits in oocytes resulted in measurable amiloride-sensitive currents permitting examination of Na+ self-inhibition. As shown in Figs. 2 and 3, most substitutions of γMet438 (Gln, Arg, Glu, Ile, Ser, Cys, Asp, Tyr, Phe, Thr, Pro, Ala, and Val) greatly suppressed Na+ self-inhibition as determined by the magnitude (Iss/Ipeak) and rate (tau) of this process (p < 0.01). A His residue at this site slightly reduced the magnitude of Na+ self-inhibition (p < 0.05), whereas a Leu slightly enhanced the inhibition (p < 0.05). Two mutations (γM438G and γM438N) significantly enhanced Na+ self-inhibition (p < 0.01). The only mutation that did not significantly alter the speed and magnitude of Na+ self-inhibition was γM438K. The data from 19 different channels offered an opportunity to identify residue factors dictating the degree of Na+ self-inhibition using correlation analysis. A plot of Iss/Ipeak against side chain lengths revealed a linear relationship (Fig. 4A; r =-0.58, p = 0.01, n = 19). Excluding Gly that lacks a side chain gave a slightly better fit (r =-0.68, p < 0.01, n = 18). The values for side chain lengths (shown in Fig. 4 legend) were estimated as the maximal lengths between theα-carbons and the most distal non-hydrogen atoms of the side chains using HyperChem 8.0 Pro (Hypercube, Inc.), which are in close agreement to the values used by Hirel et al. (17). For the same 18 channels (WT and mutants), Iss/Ipeak values were also found to correlate with Van der Waals' volumes (18) (Fig. 4B; r =-0.54, p < 0.05, n = 18). The correlation became insignificant when Gly was included in the analysis (r =-0.43, p = 0.06, n = 19). A weak correlation between Iss/Ipeak and accessible area (19) (r =-0.49, p < 0.05, n = 18) was also identified. No correlation between Iss/Ipeak and hydrophobicity (20) was found (r = -0.04, p = 0.86, n = 18). These correlation analyses suggest that the residue volume or side chain length may dictate, in part, the functionality of γMet438 in Na+ self-inhibition.
FIGURE 2.
Mutations of γMet438 alter the Na+ self-inhibition response. The oocytes were clamped at -60 mV and whole cell currents were continuously recorded whereas bath [Na+] was rapidly increased from 1 mm (open bar) to 110 mm (gray bar). The units of current and time for the mutants are the same as for WT αβγ and are omitted for clarity. The traces are representative of at least six independent observations.
FIGURE 3.
Time constants and magnitude of Na+ self-inhibition for the γMet438 mutants. The time constants (left panel) and Iss/Ipeak (right panel) values were obtained as described under “Experimental Procedures.” The data were collected in different batches of oocytes. The WT (αβγ) values represent 111 observations from 16 batches of oocytes, whereas mutant data are from 6–12 oocytes. Student's t tests were performed in the same batch of oocytes to compare the Na+ self-inhibition responses of WT and an individual mutant. Values that are significantly different from that of WT are shown as black bars (p < 0.01) or gray bars (p < 0.05).
FIGURE 4.
Relationships between side chain length or residual volume and the magnitude of Na+ self-inhibition. The Iss/Ipeak values from Fig. 3 were plotted against either side chain lengths (A) or Van der Waals' volumes (B) of residues at γ438. Side chain lengths used in the plot were as follows (Å): Gly (0), Ala (1.53), Ser (2.42), Cys (2.74), Pro (2.43), Asp (3.63), Thr (2.49), Asn (3.73), Val (2.49), Gl (4.85), Gln (4.95), His (4.44), Met (5.38), Leu (3.78), Ile (3.84), Lys (6.27), Phe (5.03), Tyr (6.36), and Arg (7.25). The mutants are denoted by single-letter code in the figure. The solid lines were from linear fitting of all data points (n = 19), and the dashed lines were from fitting all data points except Gly (n = 18). The weighted linear regression was obtained with Origin Pro 7.5 using weighting factor of 1/S.E. Correlation coefficients were all statistically significant at level of 0.05 except the solid line in (B, p = 0.06).
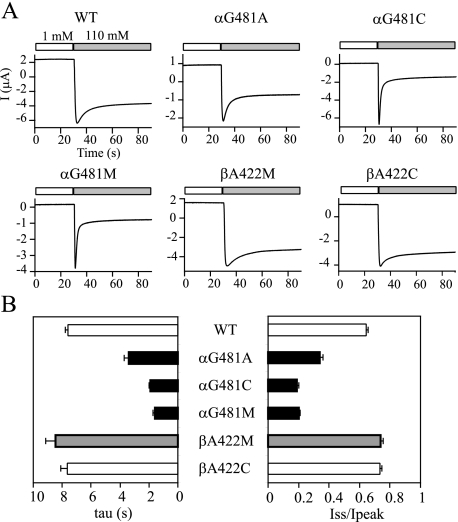
Substitutions at αGly481 Enhance Na+ Self-inhibition—A functional ENaC complex typically contains all three homologous subunits and, similar to cASIC1, is likely a heterotrimer (14). We examined the role of residues in α and β ECDs at the position homologous to γMet438 in Na+ self-inhibition. Residue βAla422 was substituted with Met and Cys, whereas αGly481 was replaced with Met, Ala, and Cys (Fig. 5). All three α mutations (αG481A, αG481C, and αG481M) greatly enhanced Na+ self-inhibition. The βA422C mutant showed a WT-like Na+ self-inhibition response. Although the tau and Iss/Ipeak values for βA422M mutant were statistically greater than WT (p < 0.05), the changes were small compared with α and γ mutants. These results suggest that αGly481 plays a role in restricting Na+ self-inhibition, and βAla422 is not important for this process.
FIGURE 5.
Mutations at αGly481 enhance Na+ self-inhibition. A, representative recordings. The oocytes were clamped at -60 mV, and whole cell currents were continuously recorded, whereas bath [Na+] was rapidly increased from 1 mm (open bar) to 110 mm (gray bar). The units of current and time for the mutants are the same as for WT αβγ and are omitted for clarity. The traces are representative of at least six independent observations. In (B), WT data were collected from 44 oocytes derived from eight batches and the mutants from 6–20 oocytes. Student's t tests were performed using data obtained with the same batch of oocytes to compare the Na+ self-inhibition responses of WT and individual mutants. Values that are significantly different from that of WT are shown as solid bars (p < 0.01) or gray bars (p < 0.05).
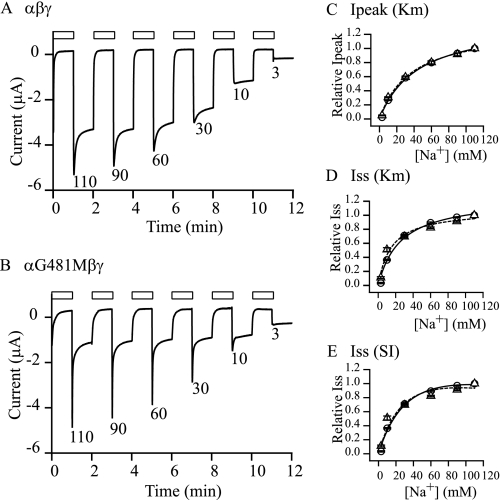
Enhanced Na+ Self-inhibition of αG481M Does Not Appear to Originate from Increased Na+ Binding Affinity—To determine whether the altered Na+ self-inhibition responses resulted from changed Na+ binding affinity or allosteric steps following Na+ binding, we examined the apparent Na+ affinity for Na+ self-inhibition. As previously described (4), we analyzed the Na+ self-inhibition responses at 3, 10, 30, 60, 90, and 110 mm Na+ (Fig. 6). Because Na+ self-inhibition is a low affinity regulatory process with reported Ki over 100 mm for human and mouse ENaCs (4, 7), we chose a mutant with greatly enhanced Na+ self-inhibition, αG481M, for this analysis. Although WT channels showed clear current decay starting from 30 mm Na+, the αG481M displayed robust self-inhibition at Na+ concentrations as low as 10 mm. The peak currents of both WT and mutant channels followed Michaelis-Menten enzyme kinetics very well (r2 of 0.99; Fig. 6C). The estimated Km values were slightly different (44.3 ± 0.9 mm, n = 5, for WT and 37.3 ± 1.9 mm, n = 8, for αG491M, p < 0.05). The steady state currents also fit well to the Michaelis equation (r2 of 0.98 for WT and 0.97 for the mutant (Fig. 6D)). The estimated Km for Iss of αG481M was 15.8 ± 1.5 mm (n = 8), moderately lower than that of WT (25.7 ± 1.3 mm (n = 5, p < 0.001). We estimated the Ki of Na+ by fitting Iss against [Na+] with the substrate inhibition equation (16) as described under “Experimental Procedures.” The average Ki for αG481M mutant was 273 ± 41 mm (n = 8, r2 of 0.92), not significantly different (p > 0.05) from that of WT (272 ± 27 mm, n = 5, r2 of 0.99). Our data are consistent with the view that the enhanced Na+ self-inhibition observed with the αG481M mutant is not due to a large change in Na+ binding affinity but primarily reflects allosteric changes subsequent to Na+ binding.
FIGURE 6.
Na+ concentration dependence of self-inhibition. Na+ self-inhibition responses were examined in individual oocytes expressing WT or αG481Mβγ with extracellular Na+ concentrations of 110, 90, 60, 30, 10, or 3 mm. A and B, representative recordings of current changes in response to the alterations of external Na+ concentration were from five oocytes expressing αβγ and eight oocytes expressing αG481Mβγ. The open bars indicate the periods of time when the cell was bathed in a 1 mm NaCl solution. The numbers below each current decay are the Na+ concentrations (in mm) used for inducing self-inhibition. Averaged data are shown in C–E with circles for αβγ and triangles for αG481M mutant. Solid (αβγ) and dashed (αG481M) lines were from best fitting of the relative Ipeak (C) or relative Iss (D and E) with equations indicated in parentheses (Km, Michaelis equation, and SI, substrate inhibition equation, see “Experimental Procedures”). Relative Ipeak represents the individual peak current at a specific Na+ concentration that was normalized to the maximal Ipeak observed in the same cell. Relative Iss represents the individual steady state current normalized to maximal Iss measured in the same cell.
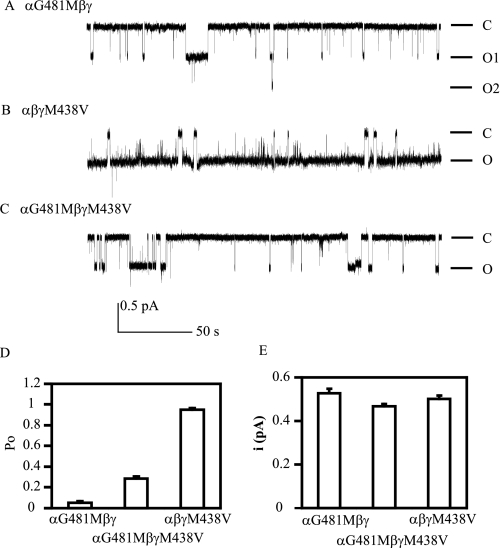
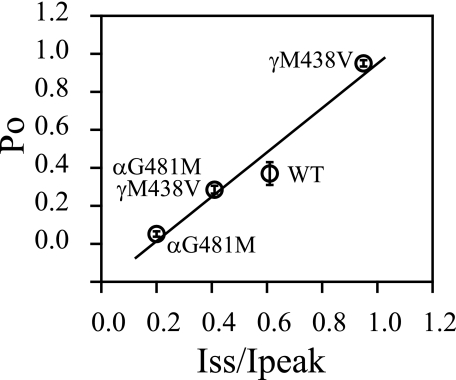
Mutations Affecting Na+ Self-inhibition Alter Open Probability—Because Na+ self-inhibition is considered an intrinsic gating event (6, 21, 22), changes in Na+ self-inhibition observed with αGly481 and γMet438 mutant channels are expected to be associated with parallel changes in channel Po. Unitary Na+ currents were obtained from cell-attached patches in oocytes expressing αG481Mβγ, αβγM438V, or αG481M/βγM438V mENaCs. Both bath and pipette solutions contained 110 mm Na+. As shown in Fig. 7, αG481Mβγ channels reside primarily in the closed state with infrequent short openings, resulting in a very low mean Po (0.05 ± 0.01, n = 6). In contrast, αβγM438V channels spend most of the time in the open state with rare short closures, leading to a very high Po (0.95 ± 0.02, n = 6). The double mutants behave like WT mENaC with the estimated Po of 0.29 ± 0.02 (n = 4), which is close to the value we reported recently under similar conditions (0.37 ± 0.06) (11, 23). All of the mutants had unitary currents (0.53 ± 0.02 pA, n = 6 for αG481Mβγ; 0.50 ± 0.01 pA, n = 6 for αβγM438V and 0.47 ± 0.01 pA, n = 4 for αG481M/βγM438V) comparable with WT (∼0.5 pA) (24). A plot of Po versus Iss/Ipeak values for WT (Po for WT was obtained from Ref. 11) and the three mutants revealed a significant correlation between the two parameters (r = 0.98, p < 0.05; Fig. 8).
FIGURE 7.
αG418M and γM438V mutants alter Po. Patch clamp recordings were performed with oocytes expressing αG481Mβγ, αβγM438V and αG481M/βγM438V mENaCs. Cell-attached patches were clamped at -100 mV (membrane potential). Both bath and pipette solutions contained 110 mm Na+. Recordings containing two or three levels of currents (one or two channels) and lasting at least 3 min were selected for analyses. Representative recordings of single channel currents are shown in A–C. Downward deflections indicate channel opening. The letters C and O represent closed and open states, respectively. The scale bars are for all three traces. The recordings were filtered at 100 Hz with low pass Gaussian algorithm by ClampFit 10 (Molecular Devices) for display. D, averaged Po of the mutant channels. Po was estimated using the single channel analysis function of ClampFit 10. The values between any two groups were significantly different (p < 0.001). E, averaged unitary currents at -100 mV. The unitary currents in each patch were obtained from the event analyses following single channel searching by ClampFit 10. The values between any two groups were not significantly different (p > 0.05).
FIGURE 8.
Correlation between Po and Iss/Ipeak. The Po values from Fig. 7 were plotted against the Iss/Ipeak obtained from the same mutants. The data points are labeled with mutation names. The Po of WT was from published data (11).
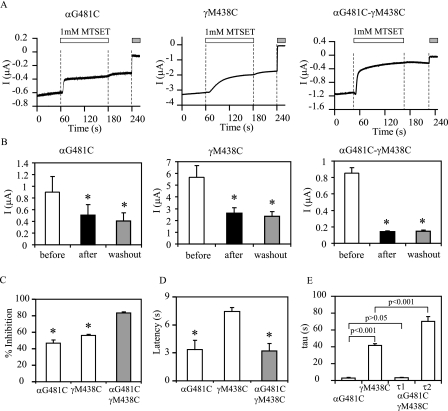
Both γMet438 and αGly481 Are Solvent-accessible—To further explore functional roles of αGly481 and γMet438 in the mechanism of Na+ self-inhibition and gating of ENaC, we investigated whether they are solvent-accessible by examining the responses of the αG481C and γM438C mutants to externally applied sulfhydryl reagents. Membrane-impermeant and positively changed MTSET was chosen to avoid modifications of intracellular sulfhydryl groups (25) and because it does not significantly alter the current of WT αβγ mENaC (9). MTSET (1 mm) applied in the bath solution slowly inhibited currents in oocytes expressing αβγM438C mENaC with a maximal inhibition of 56 ± 2% (n = 6) within 2 min and a time constant of 40 ± 2 s (n = 6; Fig. 9). The inhibition persisted following washout of the reagent from the bath and was reversed by 10 mm dithiothreitol, indicating that the inhibition was due to covalent modification of the introduced Cys at γMet438. The αG481Cβγ mutant was also inhibited by 1 mm MTSET with the maximal inhibition of 47 ± 4% (n = 4) within 2 min and a time constant of 3.0 ± 0.5 s (n = 4). MTSET caused a greater inhibition of αG481CβγM438C (83 ± 1%, n = 6) than observed with either single mutant. The inhibition of αG481CβγM438C by MTSET displayed a biphasic time course that was best described by a double exponential decay with τ1 of 3.2 ± 0.5 s (n = 6) and τ2 of 73 ± 7 s (n = 6). The magnitude and time course of the inhibition of αG481CβγM438C by MTSET suggested that both introduced Cys residues were modified by the reagent. In contrast to αG481C and γM438C, βA422C was insensitive to external MTSET. The currents prior to MTSET, during perfusion with 1 mm MTSET, and following washout were 3.8 ± 0.2, 3.9 ± 0.2, and 3.3 ± 0.2 μA(n = 5), respectively (p > 0.05). A considerable delay following MTSET application was observed prior to current inhibition in all recordings. The estimated latencies were 3.4 ± 1.0 s (n = 4) for αG481Cβγ; 7.5 ± 0.5 s (n = 6) for αβγM438C; and 3.2 ± 0.8 s (n = 5) for αG481CβγM438C. These delays were not due to slow reagent delivery, because the oocyte perfusion rate was very high (∼15 ml/min) in an oocyte chamber with unidirectional flow and small volume (∼0.5 ml). In addition, the pore blocker amiloride (10 μm) had an estimated latency of 0.6 ± 0.0 s (n = 15, pooled from oocytes expressing all mutants).
FIGURE 9.
Modification of introduced Cys at αGly481 and γMet438 by MTSET. A, representative recordings showing effects of externally applied MTSET on mutant ENaCs. Whole cell currents were recorded prior to, during (open bars) and after bath application of 1 mm MTSET from oocytes expressing αG481Cβγ, αβγM438C, and αG481CβγM438C. The gray bars indicate the periods of time in the presence of 10 μm amiloride. The dashed vertical lines show the time tags generated by digital output signals that direct the perfusion valve controller to switch the bath solution. The oocytes were clamped at -60 mV for αβγM438C and -100 mV for αG481Cβγ and αG481CβγM438C. B, summary data. White, black, and gray bars show the averaged amiloride-sensitive currents prior to MTSET, after MTSET treatment, and following washout of MTSET, respectively. For display purposes, the inward currents (negative values) were inverted and shown as positive currents. The numbers of oocytes were 4, 7, and 6 for αG481C, αβγM438C, and αG481C-γM438C, respectively. Asterisks indicate that the currents were significantly different from baseline currents (prior to MTSET) (p < 0.05, paired Student's t test). C, percentage of MTSET-induced inhibition of the three mutants. An asterisk indicates that the percentage of inhibition in the single mutant was significantly lower than the double mutant (p < 0.001). D, latency. The time between the digital tag for opening the valve of the perfusion channel for MTSET and the earliest visible change in current was considered latency. An asterisk indicates that the value was significantly lower than that of αβγM438C (p < 0.01). E, time constants. The time constants for αG481Cβγ and αβγM438C were obtained by fitting data with a single exponential equation, whereas the τ values for αG481CβγM438C were from fitting with a double exponential equation.
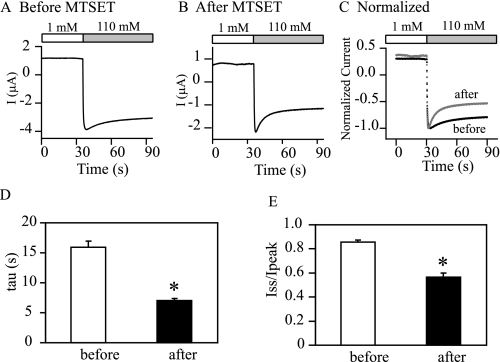
Chemical Modification of γM438C Inhibits the Channel by “Restoring” Na+ Self-inhibition—Current inhibition of the Cys mutants by MTSET likely reflects a decrease in channel Po. Because Po is correlated with the magnitude of Na+ self-inhibition (Fig. 8), MTSET-modified αβγM438C should show greater Na+ self-inhibition than unmodified αβγM438C. This is what we observed (Fig. 10). Following MTSET treatment, the Na+ self-inhibition response of αβγM438C was greatly enhanced (Iss/Ipeak (+MTSET), 0.57 ± 0.03, n = 5; Iss/Ipeak (-MTSET), 0.86 ± 0.02, n = 5) such that the modified mutant channels behaved like WT. The modification of Cys by MTSET results in a new side chain -CH2-S-S-CH2CH2N(CH3) +3 with a length of ∼9 Å (estimated using HyperChem 8.0 Pro). The linear relationship between Iss/Ipeak and side chain length (Fig. 4A) was preserved to a moderate degree with MTSET-modified αβγM438C (r =-0.59, p < 0.01, n = 20), supporting the notion that an increasing side chain length of residue γ438 generally favors Na+ self-inhibition.
FIGURE 10.
MTSET modification of γM438C mutant enhances Na+ self-inhibition. Representative Na+ self-inhibition responses in oocytes expressing αβγM438C before and after MTSET treatment are shown in A and B. Current recordings normalized to the individual peak current are shown in C. The black trace is prior to MTSET, and the gray trace is following MTSET. Averaged time constants and Iss/Ipeak values are shown in D and E. The values are significantly different (asterisk, p < 0.01, paired Student's t test, n = 5).
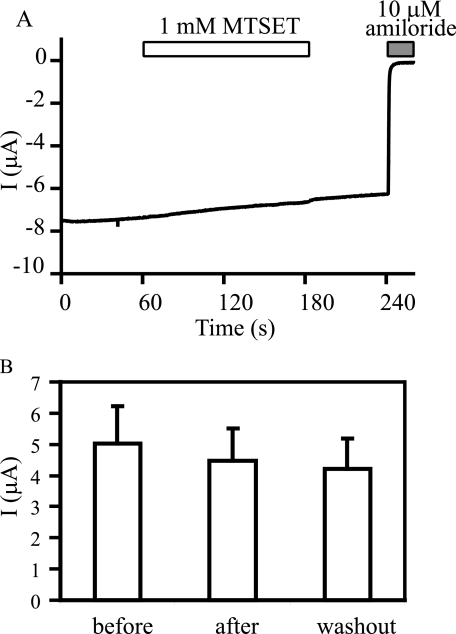
The introduction of a bulky side chain at the degeneration site in the ENaC pore, such as βS518K, locks the channel in an open state with a Po close to 1 (26–31). If MTSET treatment of αβγM438C reduces the Po of the channel, the channel must be able to alter transitions between open and closed states in response to MTSET. This should not occur with a mutation that locks ENaC in an open state. As shown in Fig. 11, MTSET did not alter the current in oocytes expressing αβS518K/γM438C, consistent with the notion that MTSET inhibits αβγM438C by reducing Po.
FIGURE 11.
MTSET has no effect on channels with a high intrinsic Po. A recording trace representing 4 independent experiments is shown in A. The oocyte was clamped at -60 mV 1 day after injection of cRNAs for αβS518K/γM438C mENaC. MTSET at 1 mm was applied as in Fig. 9. Amiloride-sensitive currents prior to, during (2 min) and after (1-min washout) application of MTSET are shown in B.
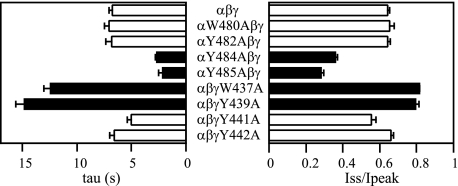
Mutations of Selected Aromatic Residues near αGly481/ γMet438 Alter Na+ Self-inhibition—To examine whether residues in proximity to αGly481 and γMet438 contribute to the Na+ self-inhibition response, we mutated four aromatic residues in the vicinity of these sites. Based on sequence alignments, these aromatic residues reside in the same helix (α5) as αGly481 and γMet438 (Fig. 1). Mutations immediately before and after αGly481 (αW480A and αY482A) had no significant effect on Na+ self-inhibition (Fig. 12). However, both αY484A and αY485A greatly enhanced Na+ self-inhibition. Substitutions immediately before and after γMet438 (γW437A and γY439A) significantly reduced and slowed Na+ self-inhibition. WT-like Na+ self-inhibition was observed in oocytes expressing the γY441A or γY442A mutant. The results suggest that αTyr484 and αTyr485 have similar functional roles as αGly481 in Na+ self-inhibition. Similarly, γTrp437 and γTyr439 may have a functional role similar to γMet438.
FIGURE 12.
Mutations of residues near αGly481/γMet438 alter Na+ self-inhibition. The time constants and Iss/Ipeak values were obtained as described under “Experimental Procedures.” The data were collected in different batches of oocytes. The WT (αβγ) values represent 27 observations from five batches of oocytes, whereas mutant data are from 7 to 12 oocytes. Student's t tests were performed in the same batch of oocytes to compare the Na+ self-inhibition responses of WT and an individual mutant. The values that are significantly different from that of WT are shown as solid bars (p < 0.001).
DISCUSSION
The tight correlation between ENaC Po and the magnitude of Na+ self-inhibition validates the concept that Na+ self-inhibition is an intrinsic gating event that modulates channel Po (6). The observed changes in the Na+ self-inhibition response of ENaCs with mutations at γMet438 and/or αGly481 suggest that both residues have functional roles in Na+ self-inhibition. The inhibitory effect of MTSET on channels with Cys introduced at either αGly481 or γMet438, as well as the effects of αGly481 and γMet438 mutations on channel Po, also supports the notion that these residues function as gating modifiers.
Our current findings provide new sites in addition to those that have previously been implicated in the allosteric regulation of ENaC by extracellular Na+ (4, 6, 8, 9). Additional sites are expected to be identified in future studies as investigators continue to examine the mechanism of Na+ self-inhibition, because this inhibitory response to Na+ has a high activation energy (Q10 of ∼8), implying that large scale conformational changes are associated with this allosteric process (7, 32). It is possible that these sites are spread out along the ECD of a subunit, contributing to one or more putative Na+ receptors as well as to structures linking the receptors to the gate within the pore.
The changes in Na+ self-inhibition by the homologous mutations at αGly481 and γMet438 suggest that these residues have different roles in the regulation of ENaC by external Na+. All three αGly481 mutations greatly enhanced Na+ self-inhibition, whereas most γMet438 mutations greatly suppressed Na+ self-inhibition. We previously identified another pair of homologous residues, αHis282 and γHis239, where αHis282 substitutions either enhanced (H282D, H282R, and H282C) or accelerated (H282W) the Na+ self-inhibition response, whereas γHis239 mutations (H239D, H239R and H239C) eliminated the response (4). These observations raise the possibility that certain subdomains within the α subunit restrict Na+ self-inhibition, whereas subdomains within the γ subunit favor Na+ self-inhibition. Drawing parallels between the contributions of specific residues and the functional roles of different subunits should be performed with caution. For example, we recently reported that mutations at eight of sixteen extracellular Cys residues within the α subunit significantly suppressed Na+ self-inhibition (9).
As an allosteric process, Na+ self-inhibition likely involves three major sequential steps: Na+ binding to its “receptor(s),” a series of local and remote conformational changes, and gate closure. αGly481 and γMet438 could contribute to one or more above steps. Because the gate of ENaC likely resides within the channel pore and the residue in cASIC1 (Lys342) homologous to αGly481 and γMet438 is located at least 40 Å away from the pore domain (Fig. 1), the likelihood that either αGly481 or γMet438 is located within the gate is very low. The other two possibilities (Na+-binding site versus allosteric regulatory site) are difficult to distinguish. To address this question, we estimated the apparent Na+ affinity for Na+ self-inhibition of WT and αG481M channels (Fig. 6). Our observations suggest that αG481M does not increase Na+ binding affinity. Both Ipeak and Iss from WT and αG481M mutant showed similar saturation behavior that was well described by Michaelis kinetics. Because Ipeak is observed prior to appearance of Na+ self-inhibition, it likely represents the high Po state of the channel, and its saturation with increasing [Na+] largely reflects Na+ binding affinity for the conducting pore. Indeed, our estimated Km for Ipeak of WT mouse αβγENaC (44 mm) is very close to the Km (48 mm) from [Na+] dependence of single channel current in rat cortical collecting tubule (33). On the other hand, Iss saturation is influenced by Na+ binding affinity for both the pore and the site for self-inhibition. The similar relationships of Ipeak and Iss with [Na+] suggest that the mutant and WT channels have similar Na+ affinities for permeation and self-inhibition. If the αG481M mutant had higher Na+ binding affinity for self-inhibition, a decline of Iss at [Na+] larger than 30 mm would be expected, as we previously reported for αH282 mutants and an α furin site mutant (4, 6). Rather as seen in Fig. 6, Iss for the αG481M mutant continued to increase with increasing [Na+]. As a result, the Iss/[Na+] data fit very well with the Michaelis equation (Fig. 6D). We suggest that αG481M “sensitizes” ENaC such that the conformational changes resulting from Na+ binding are “amplified” because of a reduced energy barrier for pore closure. We did not determine the apparent Na+ binding affinity for a γMet438 mutant that showed suppressed Na+ self-inhibition, because these experiments would require a very high Na+ concentration (>>100 mm). We speculate that γMet438 mutations do not alter Na+ binding affinity based on the following observations. First, the changes in Na+ self-inhibition with mutations of γMet438 are not dependent on the charge of the side chain. Second, MTSET modification of γM438C enhanced Na+ self-inhibition. We propose that amino acid substitutions of γMet438 either increase or decrease the energy barrier for shutting off the channels in a residue-dependent manner. This notion is consistent with the rapid inhibition of αG481C (lowered energy barrier for closing channels) and the slow inhibition of γM438C (increased energy barrier; Fig. 9) in response to MTSET.
Our observations and insights garnered from the structure of cASIC1 allow us to address the potential functional roles of αGly481 and γMet438. αGly481 appears to restrict the extent of Na+ self-inhibition, perhaps functioning as a “brake” in the response to external Na+. The functional role of αGly481 may be related to the unique properties of Gly within α-helices. Gly and Pro have the lowest helical propensity. Gly may destabilize a helical conformation by reducing the available hydrogen bonds (34, 35). In contrast, Gly residues have an important role in helix-helix packing interactions (36). For example, Gly zipper motifs (GXXGXXXGorGXXXGXXXG) are found in membrane proteins, including ion channels, and may facilitate helix packing (37). Therefore, Gly can be either a destabilizing force within a helix or serve as a stabilizing component in helical packing. Based on the location of homologous residues Lys342 within cASIC1 (Fig. 1A), it is unlikely that αGly481 is involved in packing against an adjacent helix (i.e. α4 in the thumb domain or α3 in the finger domain). We speculate that αGly481 may destabilize the helical structure of α5 in the α subunit, reducing Na+-induced movement of the thumb domain that leads to pore closure. Replacement of Gly by a residue that stabilizes α5 (Met, Cys, or Ala) would tend to enhance Na+-induced movement of thumb domain.
The effects of substitutions of γMet438 on Na+ self-inhibition correlated, in some degree, with residue volume and the length of the side chain (Fig. 4). This relationship is consistent with a “chain length effect” that has been found in the inactivation of certain enzymes and receptors (38). A long and flexible side chain (Met, Lys, or Leu) generally facilitated the functional response to external Na+, whereas a shorter side chain (Val, Ala, Thr, Asp, Cys, or Ser) hindered the functional response. It is important to recognize that this correlation is weak, given the low correlation coefficient, and there is a clear outliner, Gly. Because Gly does not have a side chain and an introduced Gly has the possibility to alter the backbone and secondary structure, it is often difficult to predict the outcome of a Gly substitution. Clearly the side chain length (or volume) is only one of the factors that define the functional role of γ438 in the Na+ self-inhibition response. Side chain chemical properties such as hydrophobicity and charge do not seem to be important. For instance, substitution of γMet438 with negatively charged Glu or positively charged Arg suppressed Na+ self-inhibition to a similar degree.
In contrast to the sensitivity of αGly481 and γMet438 to substitutions, the βA422M mutant had a modestly suppressed Na+ self-inhibition response, and βA422C caused no change in the response. In addition, αβA422Cγ was not sensitive to external MTSET. This is reminiscent of previous observations that mutations of β residues often resulted in little or no effect on the Na+ self-inhibition response, whereas large changes in Na+ self-inhibition were seen with substitutions of the corresponding residues in the α or γ subunit (4, 9). These results suggest that the β subunit has, at best, a limited role in Na+ self-inhibition of channels composed of all three subunits. However, the β subunit clearly contributes to the gating mechanism of ENaC, because dramatic changes of Po have been reported with mutations or modifications of an introduced Cys at the degeneration site in the β subunit (26, 28, 29, 31).
One intriguing feature of the thumb domain α5 is that there are four well conserved aromatic residues in the neighborhood of αGly481/γMet438 and the αCys483/γCys440 (the 13th Cys within the ECDs). Previous studies using crystallographic data have suggested that there exists a strong sulfur-aromatic interaction that may contribute to protein stability (39). Our mutational analyses indicate that αG481A, αY484A, and αY485A have a similar phenotype (i.e. enhancement on Na+ self-inhibition), suggesting a shared functional role. Equivalently, γW437A, γM438A, and γY439A may contribute to Na+ self-inhibition in a similar manner.
In summary, we have identified two homologous residues (αGly481/γMet438) in the extracellular thumb domains of α and γ ENaC subunits as novel structural determinants for Na+ self-inhibition and gating. A long side chain (or no side chain (i.e. Gly)) at position γ438 appears to preserve the functional role of Met438, whereas Gly at position α481 restricts the degree of Na+ self-inhibition. A strong correlation between Po and the magnitude of Na+ self-inhibition was observed. Experiments from sulfhydryl modifications demonstrated that both residues are accessible to extracellular solvent. Our results support the notion that the putative helices of ENaC homologous to the α5 of the thumb domains in the cASIC1 structure are important components of the allosteric pathway for ENaC gating and its regulation by extracellular Na+.
Acknowledgments
We thank Dr. Ossama B. Kashlan for helpful discussion on data analysis.
This work was supported, in whole or in part, by National Institutes of Health Grant R01 DK054354, R01 ES014701, and P30 DK079307. The costs of publication of this article were defrayed in part by the payment of page charges. This article must therefore be hereby marked “advertisement” in accordance with 18 U.S.C. Section 1734 solely to indicate this fact.
Footnotes
The abbreviations used are: ENaC, epithelial Na+ channel; ECD, extracellular domain; WT, wild type; MTSET, 2-(Trimethylammonium) ethyl methanethiosulfonate bromide; cASIC, chicken acid-sensing ion channel; cRNA, complementary RNA.
References
- 1.Rossier, B. C., Pradervand, S., Schild, L., and Hummler, E. (2002) Annu. Rev. Physiol. 64 877-897 [DOI] [PubMed] [Google Scholar]
- 2.Garty, H., and Palmer, L. G. (1997) Physiol. Rev. 77 359-396 [DOI] [PubMed] [Google Scholar]
- 3.Sheng, S., Johnson, J. P., and Kleyman, T. R. (2007) in Seldin and Giebisch's The Kidney: Physiology & Pathophysiology (Alpern, R. J., and Hebert, S. C. eds.), 4th Ed., pp. 743-768, Academic Press, New York
- 4.Sheng, S., Bruns, J. B., and Kleyman, T. R. (2004) J. Biol. Chem. 279 9743-9749 [DOI] [PubMed] [Google Scholar]
- 5.Horisberger, J. D., and Chraibi, A. (2004) Nephron. Physiol. 96 p37-41 [DOI] [PubMed] [Google Scholar]
- 6.Sheng, S., Carattino, M. D., Bruns, J. B., Hughey, R. P., and Kleyman, T. R. (2006) Am. J. Physiol. 290 F1488-F1496 [DOI] [PubMed] [Google Scholar]
- 7.Chraibi, A., and Horisberger, J. D. (2002) J. Gen. Physiol. 120 133-145 [DOI] [PMC free article] [PubMed] [Google Scholar]
- 8.Babini, E., Geisler, H. S., Siba, M., and Grunder, S. (2003) J. Biol. Chem. 278 28418-28426 [DOI] [PubMed] [Google Scholar]
- 9.Sheng, S., Maarouf, A. B., Bruns, J. B., Hughey, R. P., and Kleyman, T. R. (2007) J. Biol. Chem. 282 20180-20190 [DOI] [PubMed] [Google Scholar]
- 10.Hughey, R. P., Bruns, J. B., Kinlough, C. L., Harkleroad, K. L., Tong, Q., Carattino, M. D., Johnson, J. P., Stockand, J. D., and Kleyman, T. R. (2004) J. Biol. Chem. 279 18111-18114 [DOI] [PubMed] [Google Scholar]
- 11.Bruns, J. B., Carattino, M. D., Sheng, S., Maarouf, A. B., Weisz, O. A., Pilewski, J. M., Hughey, R. P., and Kleyman, T. R. (2007) J. Biol. Chem. 282 6153-6160 [DOI] [PubMed] [Google Scholar]
- 12.Adebamiro, A., Cheng, Y., Rao, U. S., Danahay, H., and Bridges, R. J. (2007) J. Gen. Physiol. 130 611-629 [DOI] [PMC free article] [PubMed] [Google Scholar]
- 13.Bize, V., and Horisberger, J. D. (2007) Am. J. Physiol. 293 F1137-F1146 [DOI] [PubMed] [Google Scholar]
- 14.Jasti, J., Furukawa, H., Gonzales, E. B., and Gouaux, E. (2007) Nature 449 316-323 [DOI] [PubMed] [Google Scholar]
- 15.Sheng, S., Li, J., McNulty, K. A., Avery, D., and Kleyman, T. R. (2000) J. Biol. Chem. 275 8572-8581 [DOI] [PubMed] [Google Scholar]
- 16.Schulz, A. R. (1994) Enzyme Kinetics: From Disease to Multi-enzyme Systems, pp. 38-41, Cambridge University Press, Cambridge, UK
- 17.Hirel, P. H., Schmitter, M. J., Dessen, P., Fayat, G., and Blanquet, S. (1989) Proc. Natl. Acad. Sci. U. S. A. 86 8247-8251 [DOI] [PMC free article] [PubMed] [Google Scholar]
- 18.Creighton, T. E. (1993) Proteins: Structures and Molecular Properties, p. 4, W. H. Freeman, New York, NY
- 19.Chothia, C. (1976) J. Mol. Biol. 105 1-12 [DOI] [PubMed] [Google Scholar]
- 20.Kyte, J., and Doolittle, R. F. (1982) J. Mol. Biol. 157 105-132 [DOI] [PubMed] [Google Scholar]
- 21.Van Driessche, W., and Zeiske, W. (1985) Physiol. Rev. 65 833-903 [DOI] [PubMed] [Google Scholar]
- 22.Garty, H., and Benos, D. J. (1988) Physiol. Rev. 68 309-373 [DOI] [PubMed] [Google Scholar]
- 23.Carattino, M. D., Sheng, S., and Kleyman, T. R. (2005) J. Biol. Chem. 280 4393-4401 [DOI] [PubMed] [Google Scholar]
- 24.Sheng, S., Perry, C. J., and Kleyman, T. R. (2002) J. Biol. Chem. 277 50098-50111 [DOI] [PubMed] [Google Scholar]
- 25.Kellenberger, S., Gautschi, I., Pfister, Y., and Schild, L. (2005) J. Biol. Chem. 280 7739-7747 [DOI] [PubMed] [Google Scholar]
- 26.Snyder, P. M., Bucher, D. B., and Olson, D. R. (2000) J. Gen. Physiol. 116 781-790 [DOI] [PMC free article] [PubMed] [Google Scholar]
- 27.Sheng, S., Li, J., McNulty, K. A., Kieber-Emmons, T., and Kleyman, T. R. (2001) J. Biol. Chem. 276 1326-1334 [DOI] [PubMed] [Google Scholar]
- 28.Kellenberger, S., Gautschi, I., and Schild, L. (2002) J. Physiol. 543 413-424 [DOI] [PMC free article] [PubMed] [Google Scholar]
- 29.Condliffe, S. B., Zhang, H., and Frizzell, R. A. (2004) J. Biol. Chem. 279 10085-10092 [DOI] [PubMed] [Google Scholar]
- 30.Carattino, M. D., Edinger, R. S., Grieser, H. J., Wise, R., Neumann, D., Schlattner, U., Johnson, J. P., Kleyman, T. R., and Hallows, K. R. (2005) J. Biol. Chem. 280 17608-17616 [DOI] [PubMed] [Google Scholar]
- 31.Carattino, M. D., Sheng, S., Bruns, J. B., Pilewski, J. M., Hughey, R. P., and Kleyman, T. R. (2006) J. Biol. Chem. 281 18901-18907 [DOI] [PubMed] [Google Scholar]
- 32.Chraibi, A., and Horisberger, J. D. (2003) Pflugers Arch. Eur. J. Physiol. 447 316-320 [DOI] [PubMed] [Google Scholar]
- 33.Palmer, L. G., Sackin, H., and Frindt, G. (1998) J. Physiol. 509 151-162 [DOI] [PMC free article] [PubMed] [Google Scholar]
- 34.Pace, C. N., and Scholtz, J. M. (1998) Biophys. J. 75 422-427 [DOI] [PMC free article] [PubMed] [Google Scholar]
- 35.Senes, A., Engel, D. E., and DeGrado, W. F. (2004) Curr. Opin. Struct. Biol. 14 465-479 [DOI] [PubMed] [Google Scholar]
- 36.Curran, A. R., and Engelman, D. M. (2003) Curr. Opin. Struct. Biol. 13 412-417 [DOI] [PubMed] [Google Scholar]
- 37.Kim, S., Jeon, T. J., Oberai, A., Yang, D., Schmidt, J. J., and Bowie, J. U. (2005) Proc. Natl. Acad. Sci. U. S. A. 102 14278-14283 [DOI] [PMC free article] [PubMed] [Google Scholar]
- 38.Shahrestanifar, M. S., and Howells, R. D. (1996) Neurochem. Res. 21 1295-1299 [DOI] [PubMed] [Google Scholar]
- 39.Zauhar, R. J., Colbert, C. L., Morgan, R. S., and Welsh, W. J. (2000) Biopolymers 53 233-248 [DOI] [PubMed] [Google Scholar]


