

Abstract
Mechanisms underlying hypoxia-induced neuronal adaptation have not been fully elucidated. In the present study we investigated glucose metabolism and the activities of glycolytic and TCA cycle enzymes in cerebro-cortical neurons exposed to hypoxia (3 days in 1% of O2) or normoxia (room air). Hypoxia led to increased activities of LDH (251%), PK (90%), and HK (24%) and decreased activities of CS (15%) and GDH (34%). Neurons were incubated with [1-13C]glucose for 45 and 120 min under normoxic or hypoxic (120 min only) conditions and 13C enrichment determined in the medium and cell extract using 1H-{13C}-NMR. In hypoxia-treated neurons [3-13C]lactate release into the medium was 428% greater than in normoxia-treated controls (45-min normoxic incubation) and total flux through lactate was increased by 425%. In contrast glucose oxidation was reduced significantly in hypoxia-treated neurons, even when expressed relative to total cellular protein, which correlated with the reduced activities of the measured mitochondrial enzymes. The results suggest that surviving neurons adapt to prolonged hypoxia by up-regulation of glycolysis and down-regulation of oxidative energy metabolism, similar to certain other cell types. The factors leading to adaptation and survival for some neurons but not others remains to be determined.
Keywords: continuous hypoxia, glycolysis, TCA cycle, metabolic flux, NMR
1. Introduction
Oxygen is critical for neuronal survival and severe hypoxia can induce neuronal injury leading to cell death (Iadecola, 1999; Janssens et al., 2000; Mathur, 1999; Kuroiwa, 1999; Berger and Garnier, 1999; Taylor et al., 1999). However, cell death is not the only outcome to hypoxia. Moderate hypoxia or a brief period of hypoxia/ischemia may induce adaptive responses in some tissues prolonging cellular survival (Hochachka et al., 1996; Semenza, 2001). Adaptation may include down-regulation of energy demand (Duffy et al., 1975; Vannucci and Duffy, 1976), reduced protein synthesis (Haddad and Jiang, 1993; Gu and Haddad, 2001; Munns et al., 2003), and changes in the expression of genes and enzymes necessary for survival (Semenza 2001). The distinction between hypoxia-tolerance in cells possessing adaptive mechanisms and hypoxia-sensitivity in cells with few survival mechanisms has been discussed by Hochachka et al. (1996).
Hypoxia up-regulates the expression of glycolytic enzymes in several mammalian cell types (Webster, 1987; Firth et al., 1994; Semenza, 2001) including the astroglia (Marrif and Juurlink, 1999). Anoxic neurons maintain stable ATP levels after an initial fall of 30–40% respectively, while glycolytic flux is increased five folds and remains upregulated (Munns et al., 2003). Nevertheless, under severe hypoxia, decreased ATP level is one major factor contributing to neuronal cell death (Kass and Lipton, 1989).
Hochachka et al. (1996) have proposed hypoxia sensing and signal transduction mechanisms in the regulation of gene expression during the defense and rescue phases in the development of hypoxia tolerance. The transcription factor, hypoxia inducible factor (HIF), is known to play a key role in mediating the vascular and metabolic responses to hypoxia, including increased expression of vascular endothelial growth factor (VEGF), glucose transporter (GLUT1), and several glycolytic enzymes (Firth et al., 1994; Semenza, 2001). In the mammalian CNS hypoxia sensing and adaptation are known to occur in vascular endothelial cells and astroglia leading to enhanced oxygen and glucose delivery and glucose (glycolytic) metabolism. In contrast to astroglia, neurons are considered far less tolerant to hypoxia with even brief exposures resulting in cell death (Almeida et al., 2002). This outcome does not mean however that neurons are incapable of survival-enhancing adaptation to hypoxia, as Munns et al. (2003) have shown that primary neurons in culture reduce energy utilization in response to hypoxia, prolonging their survival. Enhancing the metabolic capacity of neurons to adapt to hypoxia would have substantial therapeutic benefit in hypoxic brain injury.
Recently, we reported that the chronic postnatal hypoxia induced differential changes in glycolytic and tricarboxylic acid (TCA) cycle enzymes, most notably a ~200% increase in lactate dehydrogenase (LDH) activity in most brain regions (Lai et al., 2003). However, the molecular and cellular mechanisms underlying the hypoxia-induced pathological and/or adaptive responses in neural tissue have not been fully elucidated. In the present study, we investigated hypoxia-induced regulation of several glycolytic and TCA cycle enzymes and their corresponding fluxes in cerebro-cortical neuronal primary cultures. Our findings show that surviving neurons can adapt to hypoxia by up-regulation and down-regulation of glycolytic and TCA cycle oxidative metabolism, respectively.
2. Results
Effects of Hypoxia on Energy-Metabolizing Enzymes and LDH-1 Protein Expression
To determine the effect of continuous hypoxia on energy-metabolizing enzymes in cerebro-cortical neurons, we assayed the activities of five key enzymes —three glycolytic and related enzymes (HK, PK and LDH) and two TCA cycle and related enzymes (CS, GDH). Among the five investigated enzymes LDH was most significantly (p<0.001) increased (251%; 515.6 ± 9.5 versus 175.7 ± 34 mU/mg protein) above control in hypoxic neurons (Table 1, Figure 2). To determine whether this increase in LDH activity was a result of increased enzyme expression, we measured the LDH-1 isoform by Western blot since this isoform is predominantly localized in neurons (Venkov et al., 1976; Tholey et al., 1981; Bittar et al., 1996). LDH-1 expression was increased by 119% in hypoxic neurons as compared to that in control normoxic neurons (Figure 3). These results suggest that the hypoxia-induced increase in LDH enzymatic activity correlated with the hypoxia-induced increase in LDH-1 protein (Figure 3, inset).
Figure 2.
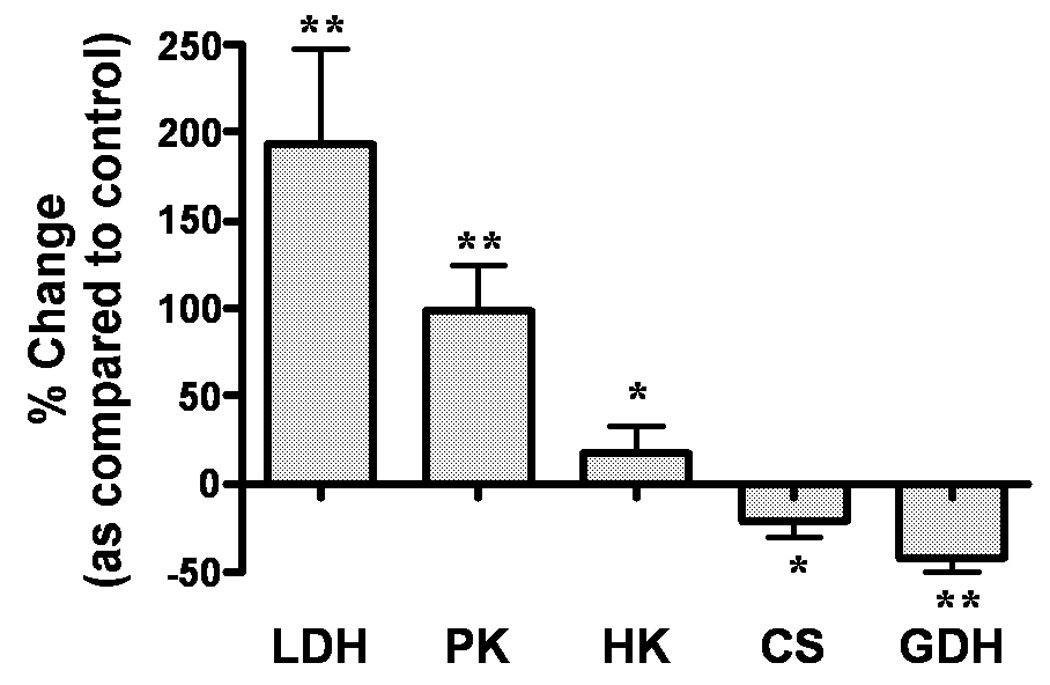
Percentage Change in Enzyme Activities in Hypoxia verses Normoxia-treated Neurons. Bars are depicted by means ± SEM of at least three different experiments. LDH: Lactate Dehydrogenase, PK: Pyruvate Kinase, HK: Hexokinase, CS: Citrate Synthase, GDH: Glutamate Dehydrogenase. * - p<0.05, ** - p<0.001.
Figure 3.
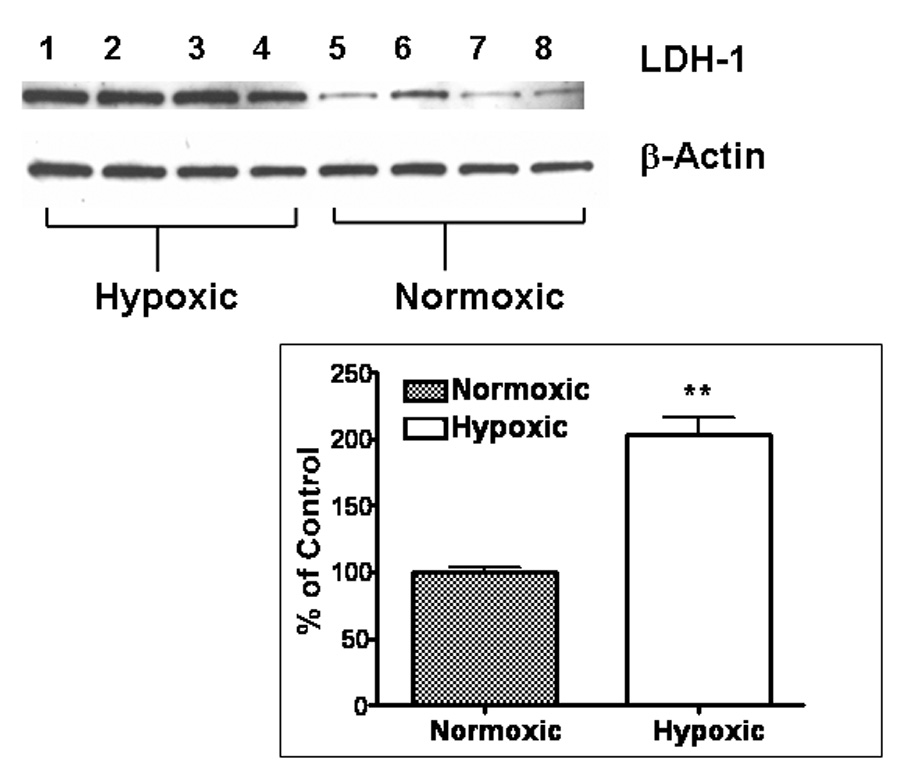
LDH-1 Protein Expression: Lanes 1–4, hypoxia-treated and lanes 5–8, normoxia-treated. First panel is LDH-1 expression and second panel is β-Actin expression on the same blots to demonstrate equal protein loading as shown in a representative experiment. Inset - Correlation of LDH Activity and LDH-1 Protein Expression in a single representative experiment expressed as percentage of control. Bars represent mean ± SEM of at least three determinations. PE: Protein Expression, EA: Enzyme Activity. ** - p<0.001, * - p<0.05
The activities of PK and HK were also increased significantly, by 90% (p<0.001) and 24% (p<0.05) respectively, in the hypoxic neurons (Table 1, Figure 2). In contrast to the glycolytic enzymes, the activities of TCA cycle and related enzymes (CS and GDH) were decreased by 15% (p<0.05) and 34% (p<0.001), respectively, during hypoxia (Table 1, Figure 2).
Effects of Hypoxia on Neuronal Metabolite Levels
The levels of glutamate, GABA, aspartate, N-acetylaspartate, alanine, and creatine were decreased significantly (12% to 50%) in neurons exposed to hypoxia compared to normoxic cultures after 45 minute incubation with labeled glucose (Figure 4A). The reduction in these metabolite levels paralleled the reduction in total cellular protein (32%, data not shown). When metabolite levels were expressed relative to total protein, which normalizes levels to surviving neurons correcting for cell loss, only the decreases in aspartate, NAA and creatine were significant (Figure 4B).
Figure 4.
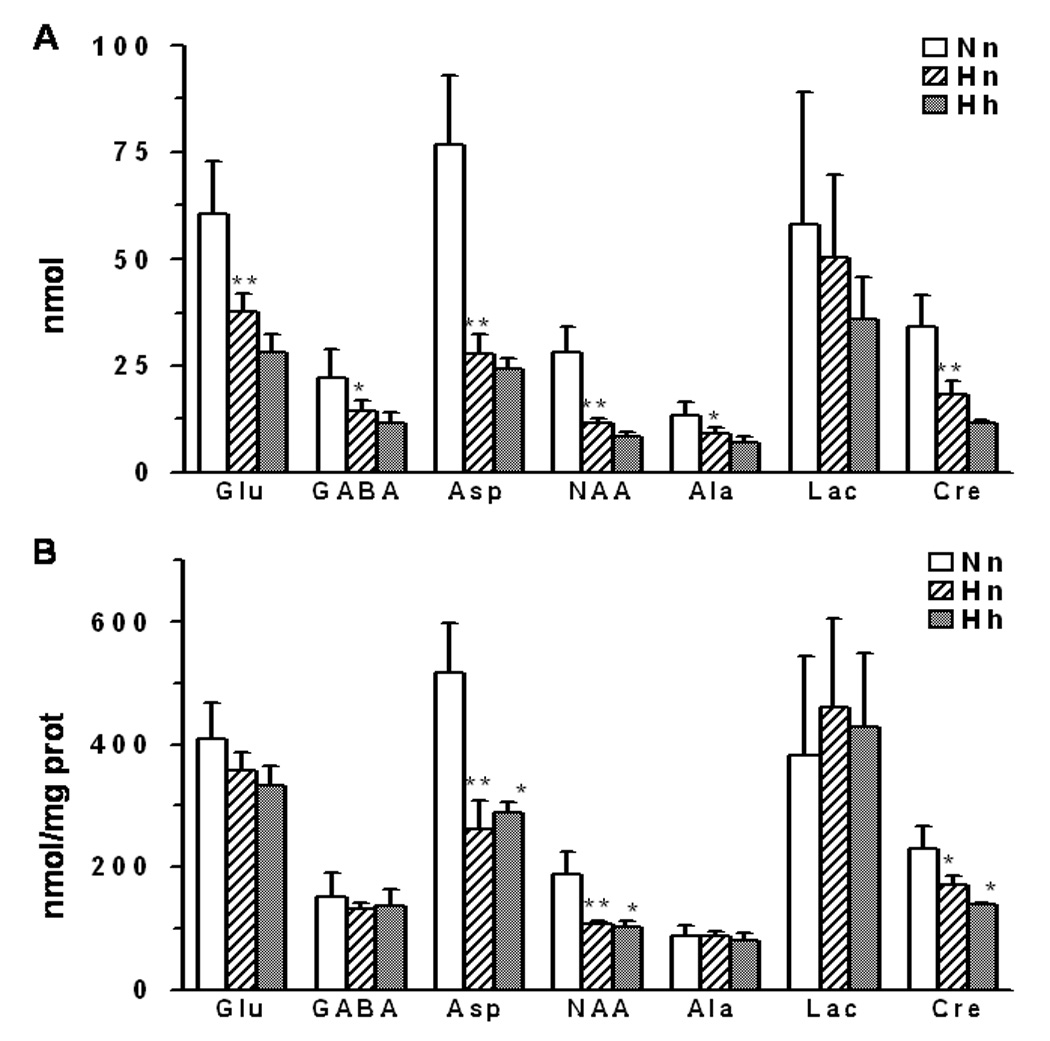
Metabolite concentrations (A) total (nmol), (B) normalized with protein (nmol/mg protein), in neurons subjected to normoxic or hypoxic conditions. Nn -normoxic neurons incubated under normoxic conditions; Hn - hypoxic neurons incubated under normoxic conditions; Hh - hypoxic neurons incubated under hypoxic conditions.Values are mean±SD, * - p<0.05, ** - p<0.01
Effect of Hypoxia on Rates of Glucose Utilization and TCA Cycle
Total glucose utilization in hypoxic neurons over the 45 min period was increased by 206% (Nn45 479±71 versus Hn45 1467±413 nmol/mg protein) compared to the normoxic neurons. The total glucose utilization was even more (Hn120 2523±80; Hh120 3859±359 nmol/mg protein) in hypoxia-treated neurons under hypoxic conditions at 2 hours. Lactate released into the medium increased with time for both hypoxic and normoxic neurons when incubated with [1-13C]glucose under normoxic conditions (Figure 5) although lactate release for hypoxia-treated neurons was significantly greater (525% and 278% of control at 45 and 120 min, respectively). The total lactate efflux increased (+354%) to 356 nmols/minute/mg protein, in surviving hypoxic neurons as compared to 79 nmols/minute/mg in normoxic neurons. Incubation of hypoxic neurons under hypoxic conditions (Hh) led to a further increase (450% of control) in the quantity of lactate released into the medium. Alanine was also elevated in the medium of hypoxia-treated neurons, but to a lesser degree than lactate (data not shown). The increased lactate (and alanine) release in hypoxia-treated neurons occurred under both normoxic and hypoxic conditions indicating that adaptation to the 3-day hypoxia treatment had occurred. The average percentage labeling of lactate-C3 in the medium was greater for hypoxic compared to normoxic neurons at 45 min (22.4 ± 1.1% verses 18.3 ± 1.3%) and 2 hours (21.0 ± 3.6% verses 18.0 ± 1.4%); however, both groups were lower than the expected 50% had metabolism occurred by glycolysis alone, suggesting substantial flux through the pentose phosphate pathway.
Figure 5.

Change in total lactate levels in medium in normoxic (N) and hypoxic (H) neurons during incubation with [1-13C]glucose indicating increase in glycolysis. Nn45 & Nn120: Normoxic cells incubated under normoxia for 45 & 120 min, respectively, Hn45 & Nn120: Hypoxic cells incubated under normoxia for 45 & 120 min, respectively, Hh120: Hypoxic cells incubated under hypoxia for 120 minutes. Each bar is represented by mean ± SD from at least three different experiments. * - p<0.0001 when comparing normoxic and hypoxic neurons at respective time points. $ - p<0.0001 when comparing normoxic and hypoxic neurons under normoxic incubation with hypoxic neurons under hypoxic incubation for 120 minutes.
Glucose oxidation in the mitochondrial TCA cycle was assessed by the 13Clabeling of the TCA cycle-linked amino acids, glutamate and GABA. [3-13C]pyruvate produced from [1-13C]glucose by glycolysis enters the TCA cycle as [2-13C]acetyl-CoA, generating [4-13C]α-ketoglutarate, which undergoes transport/exchange transamination with the larger cytosolic pool of glutamate producing [4-13C]glutamate (Fitzpatrick et al., 1990). Subsequent metabolism in the TCA cycle leads to labeling of [3-13C], [2-13C], and [1-13C]glutamate and is eventually lost as CO2 with continued turns of the cycle. Since glutamate is a precursor of GABA, [2-13C]GABA reflects TCA cycle activity and GABA synthesis in GABAergic neurons. 13C label incorporation into [4-13C]glutamate + [2-13C]GABA was lower in hypoxia-treated neurons at all time points assessed under normoxic or hypoxic conditions (Figure 6), indicating that steady-state TCA cycle flux was lower in the hypoxia-treated neurons when assessed under normoxic conditions, suggesting that a metabolic adaptation had occurred in the pathways of mitochondrial oxidation.
Figure 6.
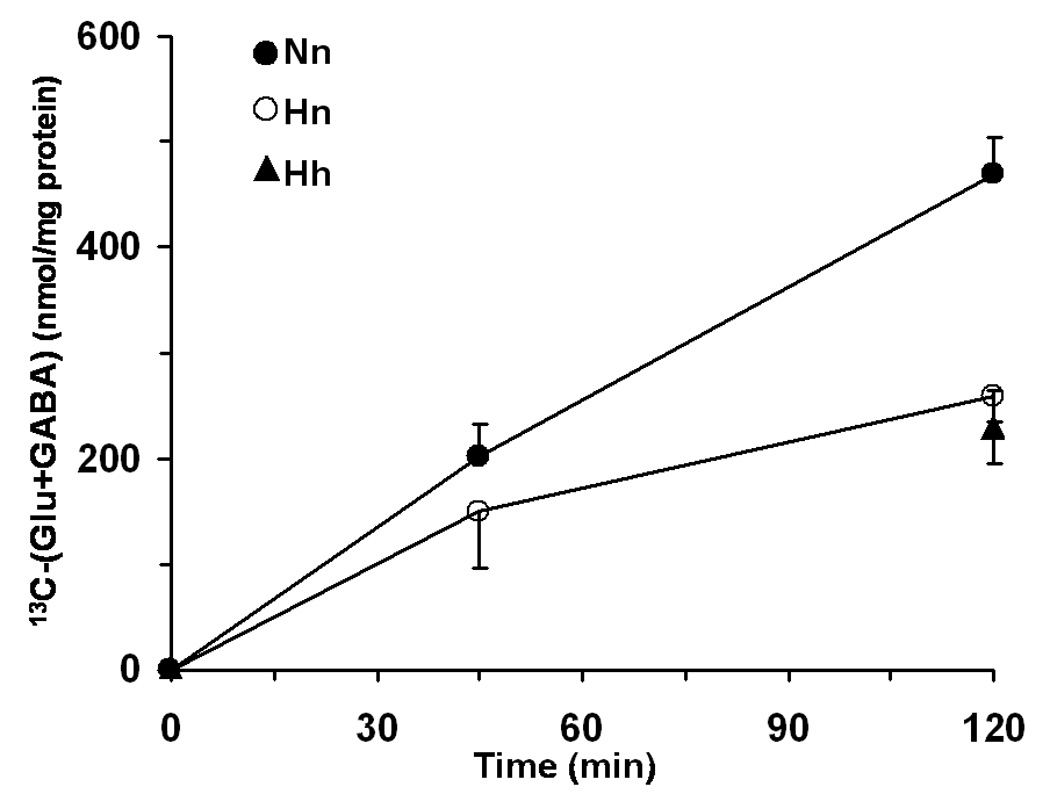
Time course of [4-13C]glutamate and [2-13C]GABA concentration in normoxic and hypoxic neurons during [1-13C]glucose incubation. All values represent mean ± SD.
3. Discussion
Our study demonstrates that continuous hypoxia (1% oxygen) in rat cerebro-cortical neuronal cultures led to substantial cell death associated with an up-regulation of glycolysis in the surviving neurons as demonstrated by the changes in the enzyme activities and total glycolytic flux rate. There was no apparent change in the TCA cycle flux even though the activities of CS and GDH decreased by 15–34% in the surviving neurons. The increase in the lactate dehydrogenase activity (194%) above control can be explained by the increase in the LDH-1 isoform protein expression (119%), which is the predominant isoform in the brain. These data demonstrate that the surviving neurons metabolically adapt to the continuous hypoxia and the adaptation could be genetically mediated as indicated by increased LDH protein expression.
The increases in activities for the three glycolysis related enzymes (ΔLDH>ΔPK>ΔHK), were greatest for the end of the pathway (LDH) and least for its beginning (HK). This pattern of change has been described previously (Kacser and Acerenza, 1993; Kacser, 1995; Fell, 1997) as a means of keeping fluxes along other branches from a main pathway constant (by maintaining the concentration of a shared substrate) while allowing flux along the main pathway to vary. The product of HK (glucose-6-phosphate) is also a substrate for glucose-6-phosphate dehydrogenase, the first enzyme of the pentose phosphate pathway. NADPH production in the pentose phosphate pathway (Kletzien et al., 1994; Almeida et al., 2002) contributes to the regulation of reduced glutathione (GSH), an important antioxidant; thus, tight homeostatic regulation of this pathway (both flux and intermediates/products) in the presence of large glycolytic fluxes could be beneficial. Concentrations of GSH and GSSG in ‘mature’ primary neurons are not affected by hypoxia, unlike combined glucose and oxygen deprivation, which increases GSSH at the expense of GSH (Almeida et al., 2002). Although a substantial flux through the pentose phosphate pathway (which removes the glucose-C1 label) was suggested by the reduced enrichment of lactate-C3 in both normoxic and hypoxic neurons, the greater 13C enrichment observed for the hypoxic neurons suggests that the increase in glucose utilization was due to an increase in glycolysis and not the pentose phosphate pathway.
In contrast to identified hypoxia response elements in the promoter regions of LDH, PK, and several other glycolytic enzymes (Semenza, 1996), similar sites have not been reported for HKI, the predominant brain isoform, suggesting that kinetic mechanisms may play a dominate role in brain HK regulation. A large fraction of brain HK is bound to mitochondria (Wilson, 1976; Clark and Lai, 1989) and studies indicate that the bound form (HKmito) utilizes ATP generated directly by oxidative phosphorylation (Wilson, 2003). Mitochondrial binding increases HK activity and glucose phosphorylation when energy demand is increased (Wilson, 2003); however, the effects of prolonged hypoxia and reduced mitochondrial function (including phosphorylation) on mitochondrial HK activity have not been reported. Of interest was the finding that _the increase in_ total lactate flux (366%) corresponded with the increase in LDH activity (194%) in the surviving neurons. The increase in glucose metabolism to lactate in neurons exposed to hypoxia can be partially explained by the increase in total LDH activity. The metabolic changes observed in this study are similar in some aspects to the response of astroglia and non-neuronal mammalian tissues (e.g., muscle) to hypoxia (Semenza et al., 1996; Iyer, 1998), as well as CNS tissues of anoxia tolerant organisms (Hochachka and Lutz, 2001). For example, increased activities of HK and LDH have been reported during hypobaric hypoxia (400 mm Hg for 14 and 28 days) in guinea pig heart (Barrie and Harris, 1976) and severe intermittent hypoxia (8.5% oxygen, 12 hours/day for 4 weeks) in rat gastronemius muscle (Pastoris et al., 1994, 1995). Similarly, exposure of mouse lung macrophage (LM) cells to hypoxia (pO2: 10–25 torr) for 96 hours led to increases in activities of glycolytic enzymes, including HK (⇑117%) and LDH (⇑151%) (Hance et al., 1980; Robin et al., 1984). The hypoxic treatment of rat myoblast (L8) cells resulted in increases in activities of all glycolytic enzymes investigated except HK (Hance et al., 1980). Thus, although the induction of LDH appears uniform in the response to hypoxia in different tissues (including brain), the effects of hypoxia on HK may be variable depending on the tissue and cell type. Hochachka and Lutz (2001) proposed that in anoxia tolerant tissues, increased glycolysis during anoxia does not compensate for loss of aerobic levels of ATP production but instead meets the needs of a new and lower energy state characterized by a balanced reduction in energy supply and demand. Whether this explanation holds for brain cells remains to be determined. ATP generation by glycolysis is inefficient, producing ~6% of that obtained by the complete oxidation of glucose. Even the three-fold increase in glycolysis observed in the hypoxic neurons in the present study would provide <17% of normoxic basal needs.
As clearly demonstrated in this study, culturing neurons for three days in 1% O2 led to substantial loss of neurons prior to their incubation with [1-13C]glucose. Thus, the measured rate changes must have been associated with a comparatively smaller percentage of surviving neurons in the culture dish under hypoxic conditions. The reason why some neurons survive and others die is not clear. It is possible that surviving neurons possess a more immature and thus more anoxia-tolerant phenotype.
Astrocytes in primary culture respond to hypoxic conditions by up regulation of glycolysis (Callahan et al., 1990; Tholey et al., 1991;Sochocka et al., 1994; Yager et al., 1994; Swanson and Benington, 1996; Niitsu et al., 1999; Marrif and Juurlink, 1999). This might aid in maintaining the intracellular ATP levels in hypoxic astrocytic cultures at levels sufficient for survival (Yager et al., 1994). Furthermore, hyperglycemia promotes survival of astrocytes exposed to hypoxia/ischemia (Callahan et al., 1990; Kelleher et al., 1993). Some studies have shown that neurons may actually be more resistant than astrocytes to hypoxic stress. Cultured cerebellar granule neurons enhance glycolysis more effectively than astrocytes during hypoxia (Sonnewald et al., 1994). Neuronal ATP levels in primary cultures of ‘mature’ phenotype are unchanged after 1 hr of anoxia (Almeida et al., 2002). Neuronal cultures exposed to glucose/oxygen free media (ischemia-like conditions) can rapidly restore their ATP and PCr pools upon recovery (Alves et al., 2000).
Continuous hypoxia had significant effect on mitochondrial function. The TCA cycle flux as determined by glutamate and GABA labeling was decreased in hypoxia-treated neurons and is consistent with the measured decrease in CS (15%) and GDH (34%) activity. We reported recently that 30 days of chronic postnatal hypoxia (10% FiO2) in rats led to reductions in CS and α-ketoglutarate dehydrogenase complex (KGDHC) activities in cortex and other brain regions (Lai et al., 2003), suggesting that mitochondrial enzymatic alterations may be more extensive than those noted in this study. Hypoxia may lead to increased oxidative stress and hydrogen peroxide accumulation reducing α-KGDHC activity (Chinipoulos et al., 1999; Tretter and Adam-Vizi, 2000) and mitochondrial respiration (Nulton-Presson and Szweda, 2001). Hypoxia has been linked with decreased mitochondrial enzymes (Murphy et al., 1984; Gibson et al. 2000), and reduced levels of membrane-bound enzymes and other proteins (Bruschi and Lindsay, 1994). Because N-acetylaspartate is synthesized in mitochondria (Madhavrao et al., 2003) and considered to reflect neuronal mitochondrial health, its loss may not be associated entirely with dead neurons but could be present in the surviving (and better hypoxia-adapted) neurons, possibly at lower levels. We conclude that under hypoxic exposure surviving neurons show a considerable degree of metabolic adaptation by enhancing glycolysis and decreasing oxidative metabolism. How these changes relate to or promote survival, as well as what factor(s) determine the path toward adaptation versus death remain important questions to be addressed.
4. Experimental Procedures
Chemicals
All the chemicals and cofactors were purchased from Sigma (St. Louis, MO) and Fisher Scientific (Fairlawn, NJ). The Western blot supplies were purchased from Bio-Rad laboratories (Hercules, CA). Anti-LDH-1 primary antibody was obtained from Abcam (Cambridge, MA). PVDF membrane was bought from Millipore (Bedford, MA). X-ray films were purchased from Kodak (Biomax, IL). Bicinchoninic acid (BCA) protein determination kit and SuperSignal West Pico Chemiluminescent Substrate kit for detection of HRP conjugated secondary antibody were bought from Pierce (Rockford, IL). [1-13C]Glucose (99 % atom) and deuterium oxide (99.6 atom %) were purchased from Cambridge Isotopes (Andover, MA).
Cell Culture Preparation
The primary cultures were prepared as previously described (Zhang et al., 2002). Pregnant Sprague-Dawley rats were obtained from Charles River Laboratories. The fetuses (embryonic day 17) were decapitated and cortical tissues collected under aseptic conditions. After dispersing, the tissue was passed through an 80 µm nylon mesh with the aid of a Teflon pestle. Cells were resuspended in the serum-free neurobasal medium supplemented with B-27, glutamine (0.5 mM), glutamate (25 µM), and a combination of penicillin (100 IU/ml) and streptomycin (100 µg/ml). The cells were plated onto poly-D-Lysine (100 µg/ml) coated 35 mm culture dishes at 1 × 10⁶ cells/ml. The culture dishes were kept in a humidified atmosphere of 95% (v/v) air and 5% (v/v) CO2 at 37°C, and the medium was changed every 4th day. Although the actual oxygen tension in room air is higher than in vivo oxygen tension, we will refer 95% (v/v) air and 5% (v/v) CO2 as normoxic as the aim of this study is to compare effects of lower oxygen levels (hypoxia) to higher oxygen levels. The neurons were exposed to either normoxic or hypoxic (1% O2:5% CO2:94% N2) conditions beginning at day 8 for 72 hours. Cultures were randomly divided into two above-mentioned groups. Four to five dishes were pooled per sample, and each set represented a mean of at least 4–5 of such samples. The dishes were rinsed and scraped using 1 ml of isolation medium (0.32 M sucrose, 1 mM EDTA-K, and 5 mM HEPES-Tris, pH 7.4) (Lai and Clark, 1989). The cells and incubation medium were frozen separately in liquid N2 and stored at −70°C until further used. Prior to enzyme assay the samples were homogenized in the pre-existing isolation medium using a Dounce homogenizer.
Enzyme and Protein Assays
All enzymatic assays were performed as described by Clark and Lai (1989). Activities of citrate synthase (CS, EC 4.1.3.7), glutamate dehydrogenase (GDH, EC 1.1.1.37), hexokinase (HK, EC 2.7.1.1), lactate dehydrogenase (LDH, EC 1.1.1.27), and pyruvate kinase (PK, EC 2.7.1.40) were measured at 25°C using a Perkin Elmer (400 Bio Series) spectrophotometer. All assays were performed at least in triplicate, using sufficient Triton X-100 as a detergent in the reaction mixture so that maximum enzymatic activity was detected. Activities of HK, GDH, PK and LDH were determined indirectly by measuring the absorbance at 340 nm indicating the change in NAD(P)H concentrations, where as CS activity was determined indirectly by measuring the absorbance of adduct formed between CoA released from acetyl CoA and DTNB at 412 nm. For detailed protocols see Clark and Lai (1989). All the enzyme activities were normalized to the amount of protein present in the homogenates. Protein determination was performed using the BCA protocol (Pierce, Rockford, IL) in a 96-well microtiter plate reader with the wavelength set at 562 nm.
Immunoblotting
Samples (5µg protein per well) were loaded and proteins separated on a 7.5% (w/v) SDS polyacrylamide gradient mini gel at 125 V for 80 minutes. Using the Mini-Trans Blot electrophoretic transfer cell, the separated proteins were transferred on to the PVDF membrane at 25 V for 150 minutes. The membranes were blocked with Tris-buffered saline (TBS) containing 0.05% (v/v) Tween 20 and 1% (w/v) milk powder for four hours at room temperature. The blots were then exposed to goat polyclonal anti-LDH-1 primary antibody (1:1000 dilution) for 48 hours at 4°C. After three washings with TBS containing 0.05% (v/v) Tween 20, the blots were incubated with peroxidase conjugated anti-goat secondary antibody (1:2000 dilution) for 2 hours at room temperature. The blots were again washed three times and the protein-antibody complexes were visualized using SuperSignal chemiluminescent substrate. After exposing the membranes to the Kodak films, the protein expression was detected by measuring the optical densities of the bands using NIH Image software from Eastman Kodak (Rochester, NY).
Preparation of Neurons for Flux Measurements
Metabolic (glycolytic and TCA cycle) fluxes were measured in neurons exposed under normoxic and hypoxic conditions for 72 hours as depicted in Figure 1. Cultured neurons dishes were rinsed with phosphate buffered saline (PBS) and incubated (t = 0) with PBS containing [1-13C]glucose (10 mM, 99 atom-%) for either 45 min or 2 hours under normoxic or hypoxic (2 hours only) conditions. The PBS was pre-equilibrated with 1%O2:5%CO2:94%N2 (hypoxia) or normoxic air. At the end of the incubation period, the PBS was decanted into 15 ml tubes, the neurons rinsed and scraped with 1 ml of PBS into collection tubes. Both fractions were stored separately at −70°C until further analysis.
Figure 1.
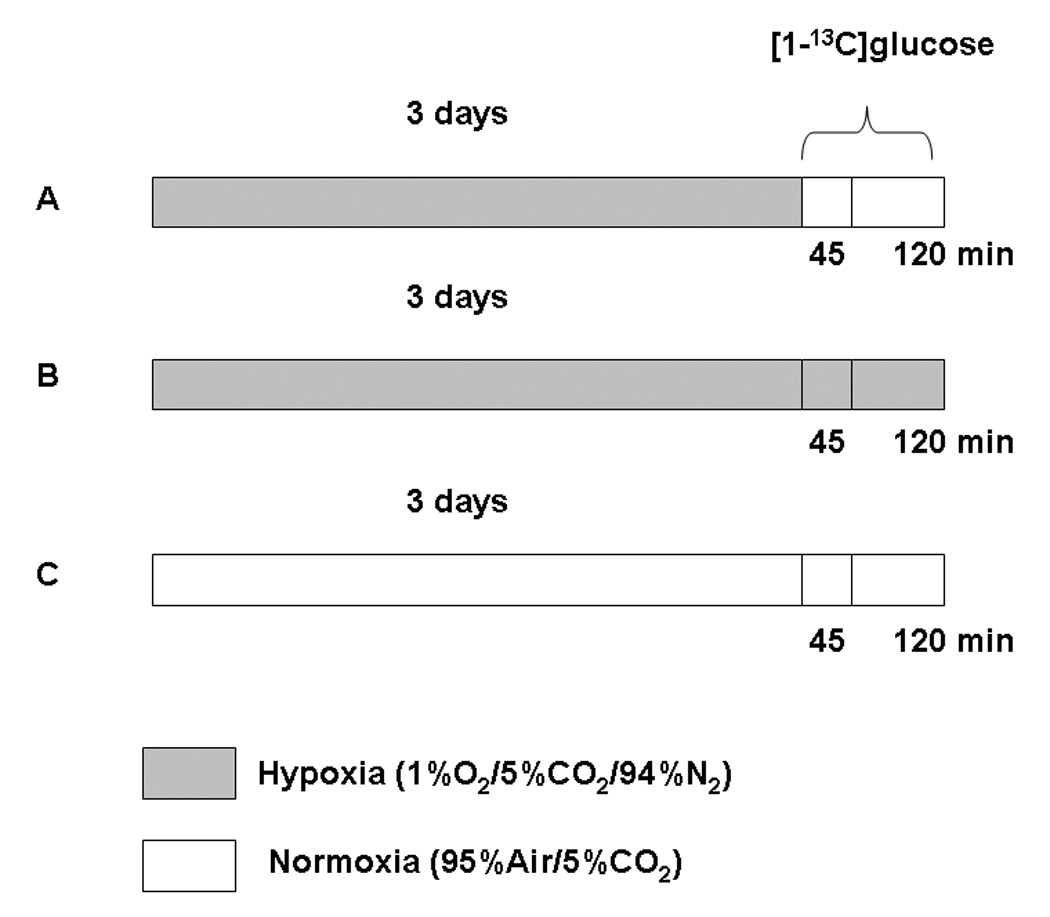
Experimental protocol for exposure of cultured neurons to hypoxia or normoxia followed by incubation with [1-13C]glucose. Three groups are: Nn - normoxic neurons incubated under normoxic conditions; Hn - hypoxic neurons incubated under normoxic conditions; Hh - hypoxic neurons incubated under hypoxic conditions.
Preparation of NMR Samples
Metabolites were extracted from the frozen neurons using ice-cold perchloric acid (1:6, vol:vol). [2-13C]Glycine (25 µL of 10 mM solution) was added as an internal concentration reference to correct for any losses occurring during the extraction procedure. The resulting suspension was frozen and thawed repeatedly to maximize cellular lysis and release of the metabolites into solution. The homogenate was clarified by centrifugation (20,000 × g) and the pellet retained for protein determination after solubilization in 1 M NaOH (Pierce protein assay). The supernatant was neutralized with 10 M KOH and centrifuged to remove precipitated potassium perchlorate. The resulting clear solution was lyophilized, and re-suspended in 500 µL of a phosphate-buffered (100 mM, pH 7) deuterium oxide solution containing 0.5 mM 3-trimethylsilyl[2,2,3,3-D4]-propionate (TSP), which served as a chemical shift reference. Frozen neuronal incubation medium was lyophilized and re-suspended in deuterium oxide (500 µL) containing TSP (0.5 mM) for 1H NMR analysis.
NMR Spectroscopy
Fully-relaxed 1H-{13C}-NMR spectra of the neuronal incubation medium and cellular extracts were acquired at 11.74 Tesla (AM500 Bruker AVANCE) using adiabatic pulses for 1H and 13C excitation (de Graaf et al., 2003). The concentrations of metabolites were determined both in neurons and neuronal medium relative to a known concentration of [2-13C]glycine, added during tissue extraction as an internal standard. The 13C isotopic enrichments of [4-13C]glutamate and [2-13C]GABA in neuronal extracts were calculated from the ratio of the areas of their resonances in the 1H-{13C}-NMR difference spectrum (2 ×13C only) and the non-edited spectrum (12C+13C) as described previously (Fitzpatrick et al, 1990). The concentration and percent 13C enrichment of [3-13C]lactate and [3-13C]alanine in the neuronal medium was determined from the 1H-{13C}-NMR spectrum using a known amount of TSP. The percentage 13C enrichment of glucose-C1 in the neuronal incubation medium was determined from the fully-relaxed 1H NMR spectrum by dividing the intensities of the two 13C satellites with the total (12C+13C) intensity of CH1α (5.2 ppm).
Calculation of Metabolic Fluxes
The rate of total glucose utilization was estimated from the sum of the major 13C labeled metabolites accumulated in the medium and extracted cell pellet after 45 min of aerobic incubation with [1-13C]glucose. The 13C concentrations were calculated by multiplying the total concentration for each metabolite by its respective 13C fractional enrichment (%-enrichment/100) according to: (Glu-C4*[Glu] + GABA-C2*[GABA] + 0.5(Lac-C3*[Lac] + Ala-C3*[Ala]), where Lac and Ala represent their total concentrations in the medium and neuronal extract.
Acknowledgements
This study was supported by NIH grants (NICHD PO1 HD32573, NINDS RO1 NS34813, NIH-BRIN P20 RR16454, and R01 HD-34852). GHM-P was supported by a research fellowship funded by NIH-BRIN P20 RR16454.
Footnotes
Publisher's Disclaimer: This is a PDF file of an unedited manuscript that has been accepted for publication. As a service to our customers we are providing this early version of the manuscript. The manuscript will undergo copyediting, typesetting, and review of the resulting proof before it is published in its final citable form. Please note that during the production process errors may be discovered which could affect the content, and all legal disclaimers that apply to the journal pertain.
Abbreviations: HK, Hexokinase; PK, pyruvate kinase; LDH, lactate dehydrogenase; CS, citrate synthase; GHD, glutamate dehydrogenase; TCA cycle, tricarboxylic acid cycle; HIF, hypoxia-inducible factor; BCA, bicinchoninic acid; HRP, horse radish peroxidase; CO2, carbon dioxide; N2, nitrogen; DTNB, 5,5`-dithio-bis(2-nitrobenzoic acid); SDS, sodium dodecyl sulfate; TBS, Tris-buffered saline; PBS, phosphate buffered saline; PVDF, polyvinylidene fluoride; NaOH, sodium hydroxide; KOH, potassium hydroxide; TSP, 3-trimethylsilyl[2,2,3,3-D4]-propionate; glu, glutamate; lac, lactate; ala, alanine; asp, aspartate; NAA, N-acetyl-aspartate; GSH, reduced glutathione; PCr, phosphocreatine; α-KGDHC, α-ketoglutarate dehydrogenase complex.
REFERENCES
- Alves PM, Ponseca LL, Peixoto CC, Almeida AC, Carrondo MJ, Santos H. NMR studies on energy metabolism of immobilized primary neurons and astrocytes during hypoxia. NMR Biomed. 2000;13:438–448. doi: 10.1002/nbm.665. [DOI] [PubMed] [Google Scholar]
- Almeida A, Delgado-Esteban M, Bolanos JP, Medina JM. Oxygen and glucose deprivation induces mitochondrial dysfunction and oxidative stress in neurons but not in astrocytes in primary culture. J. Neurochem. 2002;81:207–217. doi: 10.1046/j.1471-4159.2002.00827.x. [DOI] [PubMed] [Google Scholar]
- Barrie SE, Harris P. Effects of chronic hypoxia and dietary restriction on myocardial enzyme activities. Am. J. Physiol. 1976;231:1308–1313. doi: 10.1152/ajplegacy.1976.231.4.1308. [DOI] [PubMed] [Google Scholar]
- Berger R, Garnier Y. Pathophysiology of perinatal brain damage. Brain Res Rev. 1999;10:107–134. doi: 10.1016/s0165-0173(99)00009-0. [DOI] [PubMed] [Google Scholar]
- Bittar PG, Charnay Y, Pellerin L, Bouras C, Magistretti PJ. Selective distribution of lactate dehydrogenase isoenzymes in neurons and astrocytes of human brain. J. Cereb. Blood Flow Metab. 1996;16:1079–1089. doi: 10.1097/00004647-199611000-00001. [DOI] [PubMed] [Google Scholar]
- Bruschi SA, Lindsay JG. Mitochondrial stress protein actions during chemically induced renal proximal tubule cell death. Biochem. Cell Biol. 1994;72:663–667. doi: 10.1139/o94-087. [DOI] [PubMed] [Google Scholar]
- Callahan DJ, Engle MJ, Volpe JJ. Hypoxic injury to developing glial cells: protective effect of high glucose. Pediatr. Res. 1990;27:186–190. doi: 10.1203/00006450-199002000-00020. [DOI] [PubMed] [Google Scholar]
- Chinopoulos C, Tretter L, Adam-Vizi V. Depolarization of in situ mitochondria due to hydrogen peroxide-induced oxidative stress in nerve terminals: Inhibition of α-ketoglutarate dehydrogenase. J. Neurochem. 1999;73:220–228. doi: 10.1046/j.1471-4159.1999.0730220.x. [DOI] [PubMed] [Google Scholar]
- Clark JB, Lai JCK. Glycolytic, tricarboxylic acid cycle, and related enzymes in brain. In: Boulton AA, Baker GB, Butterworth RF, editors. Neuromethods. Vol. 11. New Jersey: Humana; 1989. pp. 233–281. [Google Scholar]
- De Graaf RA, Brown PB, Mason GF, Rothman DL, Behar KL. Detection of [1,6-13C2]-glucose metabolism in rat brain by in vivo 1H-[13C]-NMR spectroscopy. Magn. Reson. Med. 2003;49:37–46. doi: 10.1002/mrm.10348. [DOI] [PubMed] [Google Scholar]
- Duffy TE, Kohle SJ, Vannucci RC. Carbohydrate and energy metabolism in perinatal rat brain: relation to survival in anoxia. J. Neurochem. 1975;24:271–276. doi: 10.1111/j.1471-4159.1975.tb11875.x. [DOI] [PubMed] [Google Scholar]
- Fell D. Frontiers in Metabolism 2. London: Portland Press; 1997. Understanding the Control of Metabolism. [Google Scholar]
- Firth JD, Ebert BL, Pugh CW, Ratcliffe PJ. Oxygen-regulated control elements in the phosphoglycerate kinase and lactate dehydrogenase A genes: similarities with the erythropoietin 3’ enhancer. Proc. Natl. Acad. Sci. USA. 1994;91:6496–6500. doi: 10.1073/pnas.91.14.6496. [DOI] [PMC free article] [PubMed] [Google Scholar]
- Fitzpatrick SM, Hetherington HP, Behar KL, Shulman RG. The flux from glucose to glutamate in the rat brain in vivo as determined by 1H-observed, 13C-edited NMR spectroscopy. J. Cereb. Blood Flow Metab. 1990;10:170–179. doi: 10.1038/jcbfm.1990.32. [DOI] [PubMed] [Google Scholar]
- Gibson GE, Park LCH, Sheu KFR, Blass JP, Calingasan NY. The α-ketoglutarate dehydrogenase complex in neurodegeneration. Neurochem. Int. 2000;36:97–112. doi: 10.1016/s0197-0186(99)00114-x. [DOI] [PubMed] [Google Scholar]
- Gu QX, Haddad GG. Decreased neuronal excitability in hippocampal neurons of mice exposed to cyclic hypoxia. J. Appl. Physiol. 2001;91:1245–1250. doi: 10.1152/jappl.2001.91.3.1245. [DOI] [PubMed] [Google Scholar]
- Haddad GG, Jiang C. O2 deprivation in the central nervous system: on mechanisms of neuronal response, differential sensitivity and injury. Prog. Neurobiol. 1993;40:277–318. doi: 10.1016/0301-0082(93)90014-j. [DOI] [PubMed] [Google Scholar]
- Hance AJ, Robin ED, Simon LM, Alexander S, Herzenberg LA, Theodore J. Regulation of glycolytic enzyme activity during chronic hypoxia by changes in rate-limiting enzyme content: Use of monoclonal antibodies to quantitate changes in pyruvate kinase content. J. Clin. Invest. 1980;66:1258–1264. doi: 10.1172/JCI109977. [DOI] [PMC free article] [PubMed] [Google Scholar]
- Hochachka PW, Buck LT, Doll CJ, Land SC. Unifying theory of hypoxia tolerance: molecular/metabolic defense and rescue mechanisms for surviving oxygen lack. Proc. Natl. Acad. Sci. USA. 1996;93:9493–9498. doi: 10.1073/pnas.93.18.9493. [DOI] [PMC free article] [PubMed] [Google Scholar]
- Hochachka PW, Lutz PL. Mechanism, origin, and evolution of anoxia tolerance in animals. Comp. Biochem. Physiol. 2001;130B:435–459. doi: 10.1016/s1096-4959(01)00408-0. [DOI] [PubMed] [Google Scholar]
- Iadecola C. Mechanisms of cerebral ischemic damage. In: Walz W, editor. Cerebral Ischemia: Molecular and Cellular Pathophysiology. New Jersey: Humana; 1999. pp. 3–32. [Google Scholar]
- Iyer NV, Kotch LE, Agani F, Leung SW, Laughner E, Wenger RH, Gassmann M, Gearhart JD, Lawler AM, Yu AY, Semenza GL. Cellular and developmental control of O2 homeostasis by hypoxia-inducible factor 1. Genes Dev. 1998;12:149–162. doi: 10.1101/gad.12.2.149. [DOI] [PMC free article] [PubMed] [Google Scholar]
- Janssens JP, Pautex S, Hilleret H, Michel JP. Sleep disordered breathing in elderly. Aging (Milano) 2000;12:417–429. doi: 10.1007/BF03339872. [DOI] [PubMed] [Google Scholar]
- Kass IS, Lipton P. Protection of hippocampal slices from young rats against anoxic transmission damage is due to better maintenance of ATP. J. Physiol. 1989;413:1–11. doi: 10.1113/jphysiol.1989.sp017638. [DOI] [PMC free article] [PubMed] [Google Scholar]
- Kacser H. Recent developments beyond metabolic control analysis. Biochem. Soc. Trans. 1995;23:387–391. doi: 10.1042/bst0230387. [DOI] [PubMed] [Google Scholar]
- Kacser H, Acerenza L. A universal method for achieving increases in metabolite production. Eur. J. Biochem. 1993;216:361–367. doi: 10.1111/j.1432-1033.1993.tb18153.x. [DOI] [PubMed] [Google Scholar]
- Kelleher JA, Chan PH, Chan TY, Gregory GA. Modification of hypoxia-induced injury in cultured rat astrocytes by high levels of glucose. Stroke. 1993;24:855–863. doi: 10.1161/01.str.24.6.855. [DOI] [PubMed] [Google Scholar]
- Kletzien RF, Harris PK, Foellmi LA. Glucose-6-phosphate dehydrogenase: a "housekeeping" enzyme subject to tissue-specific regulation by hormones, nutrients, and oxidant stress. FASEB J. 1994;8:174–181. doi: 10.1096/fasebj.8.2.8119488. [DOI] [PubMed] [Google Scholar]
- Kuroiwa T, Mies G, Hakamata Y, Hanyu S, Okeda R, Ito U. Mitochondrial dysfunction and maturation phenomenon in ischemic gerbil cortex. In: Ito U, Fieschi C, Orzi F, Kuroiwa T, Klatzo I, editors. Maturation Phenomenon in Cerebral Ischemia III. Germany: Springer-Verlag; 1999. pp. 237–241. [Google Scholar]
- Lai JCK, Clark JB. Isolation and characterization of synaptic and non-synaptic mitochondria from mammalian brain. In: Boulton AA, Baker GB, Butterworth RF, editors. Neuromethods. Vol. 11. New Jersey: Humana; 1989. pp. 43–98. [Google Scholar]
- Lai JCK, White BK, Buerstatte CR, Haddad GG, Novotny EJ, Jr, Behar KL. Chronic hypoxia in development selectively alters the activities of key enzymes of glucose oxidative metabolism in brain regions. Neurochem. Res. 2003;28:933–940. doi: 10.1023/a:1023235712524. [DOI] [PubMed] [Google Scholar]
- Madhavrao CN, Chinopoulos C, Chandrasekaran K, Namboodiri MA. Characterization of the N-acetylaspartate biosynthetic enzyme from rat brain. J. Neurochem. 2003;86:824–835. doi: 10.1046/j.1471-4159.2003.01905.x. [DOI] [PubMed] [Google Scholar]
- Marrif H, Juurlink BHJ. Astrocytes respond to hypoxia by increasing glycolytic capacity. J. Neurosci. Res. 1999;57:255–260. doi: 10.1002/(SICI)1097-4547(19990715)57:2<255::AID-JNR11>3.0.CO;2-6. [DOI] [PubMed] [Google Scholar]
- Mathur R, Cox IJ, Oatridge A, Shepard DT, Shaw RJ, Taylor-Robinson SD. Cerebral bioenergetics in stable chronic obstructive pulmonary disease. Am. J. Respir. Crit. Care Med. 1999;160:1994–1999. doi: 10.1164/ajrccm.160.6.9810069. [DOI] [PubMed] [Google Scholar]
- Munns SE, Meloni BP, Knuckey NW, Arthur PG. Primary cortical neuronal cultures reduce cellular energy utilization during anoxic energy deprivation. J. Neurochem. 2003;87:764–772. doi: 10.1046/j.1471-4159.2003.02049.x. [DOI] [PubMed] [Google Scholar]
- Murphy BJ, Robin ED, Tapper DP, Wong RJ, Clayton DA. Hypoxic regulation of mitochondrial enzymes in mammalian cells. Science. 1984;223:707–709. doi: 10.1126/science.6320368. [DOI] [PubMed] [Google Scholar]
- Niitsu Y, Hori O, Yamaguchi A, Bando Y, Ozawa K, Tamatani M, Ogawa S, Tohyama M. Exposure of cultured primary rat astrocytes to hypoxia results in intracellular glucose depletion and induction of glycolytic enzymes. Brain Res. Mol. Brain Res. 1999;74:26–34. doi: 10.1016/s0169-328x(99)00245-4. [DOI] [PubMed] [Google Scholar]
- Nulton-Persson AC, Szweda LI. Modulation of mitochondrial function by hydrogen peroxide. J. Biol. Chem. 2001;276:23357–23361. doi: 10.1074/jbc.M100320200. [DOI] [PubMed] [Google Scholar]
- Pastoris O, Dossena M, Arnaboldi R, Gorini A, Villa RF. Age-related alterations of skeletal muscle metabolism by intermittent hypoxia and TRH-analogue treatment. Pharmacol. Res. 1994;30:171–185. doi: 10.1016/1043-6618(94)80008-1. [DOI] [PubMed] [Google Scholar]
- Pastoris O, Dossena M, Foppa P, Arnaboldi R, Gorini A, Villa RF, Benzi G. Modifications by chronic intermittent hypoxia and drug treatment on skeletal muscle metabolism. Neurochem. Res. 1995;20:143–150. doi: 10.1007/BF00970538. [DOI] [PubMed] [Google Scholar]
- Robin ED, Murphy BJ, Theodore J. Coordinate regulation of glycolysis by hypoxia in mammalian cells. J. Cell Physiol. 1984;118:287–290. doi: 10.1002/jcp.1041180311. [DOI] [PubMed] [Google Scholar]
- Semenza GL. Hypoxia-inducible factor 1: control of oxygen homeostasis in health and disease. Pediatr. Res. 2001;49:614–617. doi: 10.1203/00006450-200105000-00002. [DOI] [PubMed] [Google Scholar]
- Semenza GL, Jiang BH, Leung SW, Passantino R, Concordet JP, Maire P, Giallongo A. Hypoxia response elements in the aldolase A, enolase I, and lactate dehydrogenase A gene promoters contain essential binding sites for hypoxia-inducible factor 1. J. Biol. Chem. 1996;271:32529–32537. doi: 10.1074/jbc.271.51.32529. [DOI] [PubMed] [Google Scholar]
- Sochocka E, Juurlink BH, Code WE, Hertz V, Peng L, Hertz L. Cell death in primary cultures of mouse neurons and astrocytes during exposure to and ‘recovery’ from hypoxia, substrate deprivation and simulated ischemia. Brain Res. 1994;638:21–28. doi: 10.1016/0006-8993(94)90628-9. [DOI] [PubMed] [Google Scholar]
- Sonnewald U, Muller TB, Westergaard N, Unsgard G, Petersen SB, Schousboe A. NMR spectroscopic study of cell cultures of astrocytes and neurons exposed to hypoxia: compartmentation of astrocyte metabolism. Neurochem. Int. 1994;24:473–483. doi: 10.1016/0197-0186(94)90095-7. [DOI] [PubMed] [Google Scholar]
- Swanson RA, Benington JH. Astrocyte glucose metabolism under normal and pathological conditions in vitro. Dev. Neurosci. 1996;18:515–521. doi: 10.1159/000111448. [DOI] [PubMed] [Google Scholar]
- Taylor DL, Edwards AD, Mehmet H. Oxidative metabolism, apoptosis and perinatal brain injury. Brain Pathol. 1999;9:93–117. doi: 10.1111/j.1750-3639.1999.tb00213.x. [DOI] [PMC free article] [PubMed] [Google Scholar]
- Tholey G, Roth-Schechter BF, Mandel P. Activity and isoenzyme pattern of lactate dehydrogenase in neurons and astroblasts cultured from brain of chick embryos. J. Neurochem. 1981;36:77–81. doi: 10.1111/j.1471-4159.1981.tb02379.x. [DOI] [PubMed] [Google Scholar]
- Tholey G, Copin JC, Ledig M. Hypoxia induced metabolism dysfunction of rat astrocytes in primary cell cultures. Neurochem. Res. 1991;16:423–428. doi: 10.1007/BF00965561. [DOI] [PubMed] [Google Scholar]
- Tretter L, Adam-Vizi V. Inhibition of Krebs cycle enzymes by hydrogen peroxide: A key role of α-ketoglutarate dehydrogenase in limiting NADH production under oxidative stress. J. Neurosci. 2000;20:8972–8979. doi: 10.1523/JNEUROSCI.20-24-08972.2000. [DOI] [PMC free article] [PubMed] [Google Scholar]
- Vannucci RC, Duffy TE. Carbohydrate metabolism in fetal and neonatal rat brain during anoxia and recovery. Am. J. Physiol. 1976;230:1269–1275. doi: 10.1152/ajplegacy.1976.230.5.1269. [DOI] [PubMed] [Google Scholar]
- Venkov L, Rosental L, Manolova M. Subcellular distribution of LDH isoenzymes in neuronal and glial-enriched fractions. Brain Res. 1976;109:323–333. doi: 10.1016/0006-8993(76)90533-3. [DOI] [PubMed] [Google Scholar]
- Yager JY, Kala G, Hertz L, Juurlink BH. Correlation between content of high-energy phosphates and hypoxic-ischemic damage in immature and mature astrocytes. Brain Res. Dev. Brain Res. 1994;82:62–68. doi: 10.1016/0165-3806(94)90148-1. [DOI] [PubMed] [Google Scholar]
- Webster KA. Regulation of glycolytic enzyme RNA transcriptional rates by oxygen availability in skeletal muscle cells. Mol. Cell Biochem. 1987;77:19–28. doi: 10.1007/BF00230147. [DOI] [PubMed] [Google Scholar]
- Wilson JE, Wilkin GP, Balázs R. Metabolic properties of a purified preparation of large fragments of the cerebellar glomeruli: glucose metabolism and amino acid uptake. J Neurochem. 1976;26:957–965. doi: 10.1111/j.1471-4159.1976.tb06478.x. [DOI] [PubMed] [Google Scholar]
- Wilson JE. Isozymes of mammalian hexokinase: structure, subcellular localization and metabolic function. J. Exp. Biol. 2003;206(Pt 12):2049–2057. doi: 10.1242/jeb.00241. [DOI] [PubMed] [Google Scholar]
- Zhang J, Gibney GT, Zhao P, Xia Y. Neuroprotective role of delta-opioid receptors in cortical neurons. Am. J. Physiol. Cell Physiol. 2002;282:C1225–C1234. doi: 10.1152/ajpcell.00226.2001. [DOI] [PubMed] [Google Scholar]