

Abstract
Characterization of tissue elasticity (stiffness) and viscosity has important medical applications because these properties are closely related to pathological changes. Quantitative measurement is more suitable than qualitative measurement (i.e., mapping with a relative scale) of tissue viscoelasticity for diagnosis of diffuse diseases where abnormality is not confined to a local region and there is no normal background tissue to provide contrast. Shearwave dispersion ultrasound vibrometry (SDUV) uses shear wave propagation speed measured in tissue at multiple frequencies (typically in the range of hundreds of Hertz) to solve quantitatively for both tissue elasticity and viscosity. A shear wave is stimulated within the tissue by an ultrasound push beam and monitored by a separate ultrasound detect beam. The phase difference of the shear wave between 2 locations along its propagation path is used to calculate shear wave speed within the tissue. In vitro SDUV measurements along and across bovine striated muscle fibers show results of tissue elasticity and viscosity close to literature values. An intermittent pulse sequence is developed to allow one array transducer for both push and detect function. Feasibility of this pulse sequence is demonstrated by in vivo SDUV measurements in swine liver using a dual transducer prototype simulating the operation of a single array transducer.
I. Introduction
Characterization of tissue mechanical properties, particularly the elasticity or tactile hardness of tissue, has important medical applications because these properties are closely linked to tissue state with respect to pathology [1]. For this reason, many methods have been developed to provide noninvasive estimates of tissue mechanical properties. These techniques are based on either ultrasound or magnetic resonance (MR) imaging [2]–[6]. Ultrasound based techniques typically use an ultrasound transducer at the body surface to collect tissue information within the body and therefore require an acoustic window. Applications in obese patients or organs deep within the body are limited by the penetration depth of ultrasound. Although MR elastography (MRE) is not subjected to these fundamental limitations, MR-based techniques are more expensive, thus less likely to see wide clinical practice. Unlike MRE, ultrasound-based elastography includes many different methods, and developments of new techniques are still very active. A brief introduction of some representative ultrasound elastography techniques is provided below.
The elasticity imaging methods first developed, such as those proposed by the groups of Parker, Ophir, Greenleaf, and Nightingale, typically form a 2-D image providing a relative mapping of tissue viscoelasticity [7]–[10]. Although these methods are useful in detecting abnormal lesions, they are inadequate for assessing diffuse diseases such as liver fibrosis, where abnormality is not confined to a local region and there is no normal background tissue to provide contrast. Such circumstances require quantitative methods, where tissue elasticity is inversely solved in unit of Pascal. Considerable efforts have been directed to developing quantitative methods in recent years. Several groups have proposed the use of shear wave propagation speed for quantifying tissue stiffness [1], [11]–[13]. However, tissue viscosity is neglected in these methods, and this omission can cause bias in the estimation of tissue elasticity. In addition, important information about tissue state may be lost due to the neglect of viscosity because recent studies suggest that viscosity is another useful index of tissue health [14], [15]. Supersonic shear imaging has the potential to solve quantitatively both tissue elasticity and viscosity [16], [17]. However, this technique requires super fast imaging (with a frame rate up to 5000 frames per second), which is not compatible with current commercial ultrasound scanners. In summary, there is still a need for practical techniques that quantitatively resolve both tissue elasticity and viscosity.
Toward this aim, we have proposed a new method that quantifies both elasticity and viscosity from the frequency dispersion of shear wave propagation speed [18]. We call this method shearwave dispersion ultrasound vibrometry (SDUV). Initial results obtained with gelatin phantoms showed good match to independent validations. However, shear waves were detected in this pilot study by an optical method, which cannot be applied in tissues. This paper reports further development of SDUV as summarized below. Pulse echo ultrasound is used to detect shear wave propagation, and its feasibility is demonstrated in bovine muscle in vitro. A new pulse sequence that may potentially make SDUV compatible with current ultrasound scanners is also developed. Feasibility of this pulse sequence for SDUV measurements in vivo, in the presence of respiratory and cardiac motions, is tested within the liver of an anesthetized swine. These results show that SDUV is a promising method to quantify tissue elasticity and viscosity.
II. Methods
A. Principle of SDUV
The principle of SDUV has been described in our previous paper [18] and is briefly summarized here. For a homogeneous Voigt medium, the shear wave propagation speed cs depends on the frequency of shear wave ωs (i.e., “dispersive”):
| (1) |
where ρ, μ1, and μ2 are the density, shear elasticity, and shear viscosity of the medium, respectively. The density of various soft tissues shows very little variance and can be assumed to be 1000 kg/m3. Therefore, the variation of cs versus frequency can be measured in the studied medium and fit by (1) to inversely solve for elasticity and viscosity. As shown in Fig. 1, the “push” transducer transmits a continuous amplitude modulated (AM) ultrasound beam to generate harmonic vibration (typically in the range of hundreds of Hertz) within the studied medium at the transducer focus. Monochromatic shear wave of frequency ωs propagating outward from the vibration center can be monitored by the “detect” transducer in pulse-echo mode at 2 locations along the propagation path. The propagation speed of the shear wave at ωs is estimated by tracking the phase change of the wave over the distance it propagates:
| (2) |
where Δφs = φ1 − φ2 is the phase change over the traveled distance Δr. Alternatively, one can keep the detect beam fixed in space and move the push beam laterally to obtain 2 phase measurements Δr apart for shear wave speed estimation with (2). The frequency of shear wave can be changed by controlling the modulation frequency of the AM ultrasound, and shear speed measurements are made one frequency at a time to quantify dispersion. The dispersion characteristic of the studied tissue thus measured is fit with (1) to solve for tissue elasticity and viscosity. It is important to note that SDUV is not a 2-D imaging method, but provides “virtual biopsy” of tissue viscoelasticity at any selected location of measurement within the studied tissue.
Fig. 1.
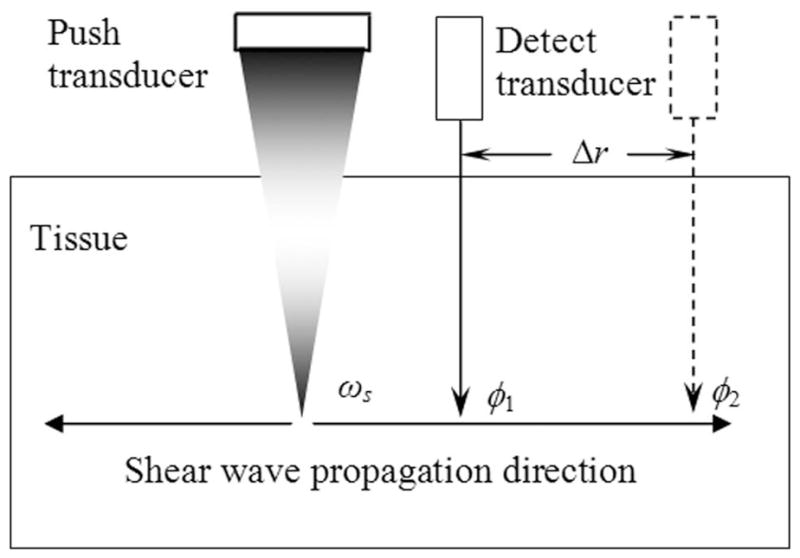
Principle of SDUV. A harmonic shear wave is produced by a “push” ultrasound beam, and its propagation is monitored by a separate “detect” ultrasound beam. The shear wave speed is calculated from its phase (φ1 and φ2) measured at 2 locations (separated by Δr) along its traveling path.
B. Detection of Shear Wave by Pulse Echo Ultrasound
As mentioned above, detection of shear wave with ultrasound is important for medical applications where optical methods are not feasible. The challenge is that vibration caused by the push ultrasound beam is usually small and can be affected by various environmental noises such as body, breathing, and cardiovascular motions. Because the vibration is a pure tone and its frequency is known, one can apply Kalman filtering to extract the vibration phase only at the shear wave frequency and reject all out-of-band noises. More specifically, ultrasound pulses are repeatedly transmitted to the same detection location with a pulse repetition frequency (PRF) of several kilohertz. A fixed time point in the echo corresponding to a selected tissue region along the ultrasound beam is demodulated across all echoes to obtain the vibration versus time record as the shear wave passes that tissue region. A Kalman filter is then applied to the vibration-time record to lock-in and extract only the signal at the shear wave frequency. Although estimates of both amplitude and phase of tissue vibration are provided by the Kalman filter, only phase is used by SDUV. Then the detect ultrasound beam is focused at another location along the shear wave propagation path to obtain a second shear wave phase at the same shear wave frequency. Shear wave speed at this frequency is calculated from the phase shift and distance between these 2 locations. The whole process is repeated for several shear wave frequencies to characterize dispersion. Details about shear wave detection with ultrasound can be found in the paper by Zheng et al. [19].
C. SDUV with a Single Transducer
The SDUV setup in Fig. 1 requires 2 separate transducers: one push transducer to generate shear waves and one detect transducer to monitor shear wave propagation. This can be rather cumbersome and limit the clinical applications of SDUV. An intermittent pulse sequence that may allow SDUV measurements using one commercial array transducer is proposed to avoid this limitation. This important development makes SDUV potentially compatible with current ultrasound scanners. If implemented on a clinical scanner, the envisioned application of SDUV is described as the following. A B-mode scan of the patient will be first conducted to provide image guidance for SDUV measurements. A location of interest can then be selected within the B-mode image and the machine will be temporally switched to SDUV mode for “virtual biopsy” of tissue elasticity and viscosity at the specified location. Each SDUV measurement takes about 0.1 s; therefore, this interactive process can be repeated quickly at multiple locations to provide a comprehensive evaluation of the studied organ.
The intermittent pulse sequence for SDUV has both spatial and temporal features. As illustrated in Fig. 2, the push beam and the detect beam are focused at different locations. Current commercial array transducers can electronically steer the ultrasound beam to different locations without mechanically moving the transducer. The push beam is used to generate a shear wave within the studied tissue. The detect beam is in pulse echo mode to monitor and record shear wave propagation. Furthermore, the detect beam needs to be steered to at least 2 different locations to obtain a phase difference for shear wave speed estimation using (2) (only one detect location is shown in Fig. 2 to avoid making the figure too busy).
Fig. 2.
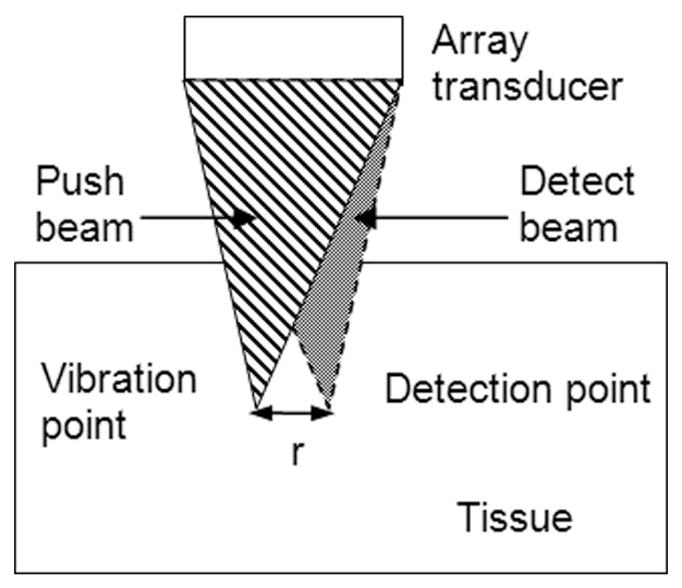
Illustration of the spatial relationship between the push beam and the detect beam. The push and detect beams are focused at 2 different lateral locations separated by distance r. This is achieved by steering the ultrasound beams electronically while the transducer remains fixed in space during the measurement.
The timing of the pulse sequence is illustrated in Fig. 3. The push-and-detect beams are shade-coded the same way as in Fig. 2. The push sequence and detect sequence in Fig. 3 are focused at different locations (refer to Fig. 2). Each push toneburst has a duration of several hundred microseconds and is repeated at a pulse repetition frequency of PRFp = 100 Hz. A push sequence typically consists of 10 tonebursts, exerting a force of constant amplitude, every 10 ms, to the same tissue region at the transducer focus. The spectrum of such repeated on/off push sequence contains the fundamental frequency at 100 Hz and its harmonics at 200, 300, and 400 Hz etc. Shear waves produced by this push sequence contains multiple pure-tone frequencies, and all frequency components can be detected simultaneously. Therefore, dispersion information can be obtained with only one push sequence: repeating the push sequence at different frequencies (as required by the AM push beam in Fig. 1) is not necessary. As a result, SDUV measurement time is reduced and heating by ultrasound to tissue is also minimized. Shear waves above 500 Hz generated by this on/off push sequence are typically very weak and quickly attenuated when propagating outward. Therefore, dispersion measurement is limited up to about 400 Hz.
Fig. 3.

Timing of the push beam and detect beam shown in Fig. 2. The push and detect beams are interspersed in the time domain such that there is no interference between the push and detect beams. Push toneburst repeated at frequency PRFp produces shear wave at PRFp and its harmonics. The push beam and detect beam are focused at different locations as shown in Fig. 2.
III. Experiments
A. In Vitro Experiment
An in vitro experiment was conducted in striated bovine muscle to test the feasibility of SDUV measurements in real tissue. Pulse echo ultrasound was used to detect the propagation of shear waves within the tissue. Instead of an ultrasound push beam, a mechanical actuator was used in this experiment to generate shear waves. This setup avoided interference to pulse echo motion detection from the push beam and therefore allowed the study of pure-tone, monochromatic shear waves (shear waves produced by the pulse sequence in Fig. 3 are multitone). A bovine muscle measuring 8 × 15 × 5 cm had a through hole cut at its center and a glass rod with a diameter of 6 mm was glued in the hole throughout the thickness (5 cm) of the sample. The glass rod was driven by the mechanical actuator to introduce monochromatic shear waves ranging from 200 to 500 Hz in the tissue. Shear wave of 100 Hz was not used in this experiment due to concerns about resonance of the muscle-rod-actuator system. Each frequency was interrogated independently (i.e., one frequency at a time). Due to the inherent frequency response of the actuator, displacement of the rod in this experiment was measured to be 9.2, 4.6, 2.4, and 1.4 microns for 200, 300, 400, and 500 Hz, respectively. For all frequencies tested, the rod was vibrated for 50 ms (i.e., 10 cycles for 200 Hz, 15 cycles for 300 Hz, and so on) during shear wave measurements. The propagation of the shear wave was tracked by a focused ultrasound transducer in pulse-echo mode over a range of 1 cm at different locations separated by 2 mm intervals. Measurements were made both along and across muscle fibers. Vibration amplitude of the rod remained the same for measurements in both directions. The transducer has a center frequency of 10 MHz and focused at about 4 cm. Ultrasound echoes were digitized at 100 MHz and processed by the method detailed in [19] to estimate the phase of the shear wave. The propagation speed of the shear wave was then calculated by (2) and dispersion measurements at multiple frequencies were then fit by (1) to solve for tissue elasticity and viscosity.
B. In Vivo Experiment
A pilot in vivo experiment was performed in swine liver to test the feasibility of the intermittent SDUV sequence in the presence of breathing and cardiac motions. Two separate transducers were used in this experiment to simulate a single array transducer because currently we have no access to control the operation of a commercial array transducer. The push transducer operated by the push pulses and the detect transducer operated by the detect pulses followed the exact timing shown in Fig. 3. Therefore, results obtained with this arrangement should be a reliable indication of the pulse sequence’s performance on a single array transducer.
The experiment conformed to the policy of the Institutional Animal Care and Use Committee at Mayo Clinic. A farm pig was anesthetized with an infusion of ketamine (2 mg/kg/h), fentanyl (0.02 mg/kg/h), and etomidate (0.08 mg/kg/h) and mechanically ventilated. B-mode imaging of the liver was performed to find suitable locations for SDUV measurements. A water bath was formed on the abdomen of the pig. SDUV measurements of the liver were then performed through the pig abdominal wall with one push transducer and one detect transducer in the water bath, as shown in Fig. 4. The push transducer was a narrow band air-backed transducer with a diameter of 4.4 cm, a center frequency of 3 MHz, and focused at 7 cm. The detect transducer was a broadband image transducer with a diameter of 2.1 cm, a center frequency of 5 MHz, and focused at 9 cm. The push transducer and the detect transducer were aligned co-focally with pulse echo technique using a small sphere as a point target. The operation of these 2 transducers followed the timing shown in Fig. 3, with PRFp equal to 100 Hz and PRFd equal to 1.6 kHz. Each push toneburst had a duration of 0.3 ms, and 10 tonebursts were transmitted to the same push location to generate multitone shear waves. The detect beam had a center frequency of 5 MHz, and echoes were recorded at 100 MHz sampling rate. Mechanical ventilation was temporarily suspended during data aquisition and electrocardiographic (ECG) signal was used to trigger SDUV measurements when cardiac motion was minimum during a heart cycle. The push transducer was moved laterally by a scanner motor with micrometer precision to change the shear wave propagation distance. Measurements were made at initial position (0 mm) and when the push transducer moved away by 1 mm, 2 mm, 3 mm, and 4 mm laterally. Measurements at different locations were automated by the scanner motor. Acquisition at consecutive locations was delayed by 2 s and triggered by ECG (all locations were measured within one breath hold of 10–15 s). Shear wave phase at locations 0 and 4 mm was used to calculate shear wave speed using (2). Nine SDUV measurements were repeated with the push/detect transducers aiming at the same spatial location. Repeated measurements were made with different breath holds. The actual measurement positions within the liver should be confined to a relatively small region from one breath hold to another.
Fig. 4.

Experimental setup for in vivo measurements in porcine liver. A water bath was formed on the pig’s abdomen. The push transducer (left) and the detect transducer (right) were co-focused in space. The push transducer was automatically moved by a scanner motor to change the propagation distance of shear wave.
IV. Results
Fig. 5 shows the shear wave propagation speed as a function of frequency measured along (circles) and across (crosses) the fibers of the bovine muscle. The solid lines are the least mean square (LMS) fits from (1) that give a shear elasticity of μ1 = 29 kPa and a viscosity of μ2 = 9.9 Pa·s along the fibers; and μ1 = 12 kPa and μ2 = 5.7 Pa·s across the fibers.
Fig. 5.
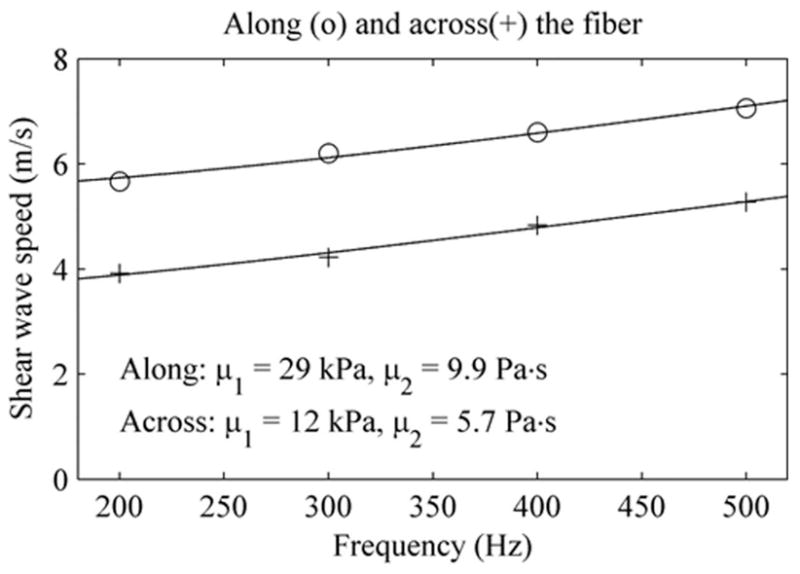
Shear wave speed measured along (circles) and across (pluses) the bovine muscle tested. Solid lines are LMS fits from the Voigt dispersion model, which gives estimates of stiffness and viscosity shown at the bottom of this figure.
Fig. 6 (a) and (b) are examples of shear waves measured at 0 and 2 mm. One can clearly see the fundamental frequency (100 Hz) as well as its higher harmonics (200, 300, 400 Hz, and so on). Phase shift due to propagation is small but visible. The phases of shear waves at frequencies 100 to 400 Hz can be estimated from these vibration-time records by the Kalman filter. Fig. 6(c) demonstrates that the shear wave phase changes linearly with propagation distance for all frequencies studied. Shear wave speed, shown as circles in Fig. 6(d), are calculated using phase information at location 0 mm and 4 mm in Fig. 6(c). The solid line is the LMS fit by (1), which gives μ1 = 2.4 kPa and μ2 = 2.1 Pa·s.
Fig. 6.

A typical in vivo SDUV measurement in liver: (a) vibration-time record at location 0 mm, (b) vibration-time record at location 2 mm, (c) vibration phase vs. location calculated from vibration-time records from 5 locations, and (d) shear wave speeds calculated from locations 0 mm and 4 mm in (c).
The means and standard deviations of elasticity and viscosity obtained from 9 different SDUV measurements are μ1 = 2.2 ± 0.63 kPa and μ2 = 1.96 ± 0.34 Pa·s. We are not aware of previous literature reports on elasticity and viscosity measured in vivo in swine liver. However, these results are comparable to in vivo values reported for normal human liver (μ1 = 2.06 ± 0.26 kPa and μ2 = 1.72 ± 0.15 Pa·s) and normal rat liver (μ1 = 1.76 ± 0.37 kPa and μ2 = 0.51 ± 0.04 Pa·s) [14], [15]. Fig. 7 provides a visual summary of this comparison.
Fig. 7.

Means and standard deviations of in vivo elasticity and viscosity measurements made in livers of normal swine by SDUV, human by MRE, and rat by MRE.
V. Discussion
This study shows promising SDUV results for quantitative measurements of elasticity and viscosity in bovine striated muscle and swine liver tissue. Currently, there is no gold standard for elasticity and viscosity measurements in soft tissues. The in vitro bovine muscle results are similar to those reported in another in vitro study in bovine muscles: μ1 = 49 kPa, μ2 = 15 Pa·s along the fibers and μ1 = 25 kPa, μ2 = 3.3 Pa·s across the fibers [20]. The difference in the values reported by these 2 studies may be due to natural variations between bovine muscle obtained from different anatomic locations and due to variations in length of time post mortem before the measurements were made. The values along and across the fibers are different because muscle is known to be anisotropic. Muscle filaments can slide along each other, and this weak coupling between filaments may be the reason that muscle demonstrates lower stiffness across fibers than along fibers.
The feasibility of SDUV measurements with one array transducer is demonstrated by an in vivo animal experiment using a dual transducer prototype. SDUV uses high-intensity ultrasound in the push beam, therefore, potential risks associated with this method need to be assessed. For diagnostic ultrasound, the FDA limit is 1.9 for mechanical index (MI), which is an indication of potential cavitation generated by ultrasound [21]. Thermal index (TI) is a more appropriate indication of potential tissue heating than the spatial peak temporal average intensity (Ispta) for short duration, high-intensity ultrasound pulses as are used in acoustic radiation force imaging (ARFI) or SDUV [10]. The current FDA limit for TI is 6. The acoustic output of the push transducer used in the in vivo animal experiment was measured by a calibrated PVDF bilaminar shielded membrane hydrophone (GEC-Marconi, with an active element of 1.0 mm) in a water tank. Using a derating factor of 0.3 dB/cm/MHz, the values of MI.3 and Isptp.3 are estimated to be 2.8 and 1300 W/cm2, respectively. A worst-case estimate of the potential temperature increase can be calculated by solving the bioheat equation and ignoring heat convection and blood perfusion [22]: ΔT = 2αIt/γ, where ΔT is temperature increase, α is the absorption coefficient of ultrasound, I is the acoustic intensity of ultrasound, t is the application time of ultrasound, and γ is the volume specific heat for tissue. Using this approach, the upper limit of tissue heating for one push sequence is estimated to be 0.32°C (α = 0.173 Np/cm (i.e., 0.5 dB/cm/MHz at 3 MHz), I = 1300 W/cm2, t = 3 ms (i.e., 10 repeated pushes each lasts 0.3 ms), γ= 4.2 J/cm3/°C). Because the push beam was move laterally during the SDUV measurements, heating at different push locations did not accumulate. Therefore, the maximum heating of one SDUV measurement was still 0.32°C, corresponding to a TI of 0.32. The MI used in the in vivo experiment was over the FDA limit. However, it is important to note that SDUV measurements can be made at lower MI. The acoustic output was measured after the in vivo experiment. If we had known the acoustic output in advance, a push beam of lower MI could have been used to obtain the in vivo measurements (we have made good measurements with lower MI in other experiments). For example, a push beam of higher ultrasound frequency would be able to produce a similar amount of tissue motion at lower MI. Alternatively, a push beam with lower peak-negative-pressure (thus lower MI) can be used. Tissue displacement will be approximately half of that shown in Fig. 6 if an MI of 1.9 is used through this approach. It is expected that SDUV measurements will still be reliable under such situations: a study by Urban et al. [26] indicates that even submicron motions can be accurately detected in SDUV applications. In addition, tissue displacement can be increased by using push tonebursts of longer duration while MI is kept below 1.9 (tissue experiments indicate that displacement increases about linearly with push duration when the acoustic level of push beam is fixed). Therefore, it is expected that SDUV measurements can be reliably made within current FDA regulatory limits.
The intermittent pulse sequence in Fig. 3 generates multitone shear waves, and all frequency components are detected simultaneously. There remains a question whether SDUV measurements using multitone shear waves and pure-tone shear waves (measured one frequency at a time) would yield the same result. A comparison experiment was performed in a uniform gelatin phantom to answer this question. Measurements using the multitone approach (with the same push and detect transducers as the in vivo liver experiment) and pure-tone approach (with the same mechanical actuator and rod as the in vitro muscle experiment) were repeated at 8 different locations across the same test phantom. Results of multitone SDUV are μ1 = 3.38 ± 0.29 kPa and μ2 = 0.79 ± 0.14 Pa·s. Results of pure-tone SDUV are very similar: μ1 = 3.61 ± 0.52 kPa and μ2 = 0.77 ± 0.27 Pa·s. Standard deviations of these measurements include variations caused by the measurement system and by small inhomogeneity of stiffness and viscosity within the phantom. Therefore, these results also provide information about precision of the method.
The shear wave dispersion equation, (1), used in SDUV is based on a Voigt model. There are other choices of rheological models such as a Maxwell model. It is not yet clear which one is the best model to describe the response of soft tissues. The Voigt model is widely used in MRE for soft tissues. A recent paper compares the Voigt and Maxwell models and concludes that the Voigt model is better for the agar-gelatin phantom and bovine muscle studied [20]. The excellent fits between (1) and shear wave speed dispersion measured in muscle and liver (Fig. 5 and 6) also suggest that the Voigt dispersion model is sufficient at least for the frequency range used in SDUV.
SDUV is capable of providing quantitative measurements of tissue viscosity, in addition to elasticity, and has several beneficial features. First, shear wave propagation is governed by material properties but is independent of the ultrasound intensity and beam shape at the focus. Therefore, SDUV is not affected by these unknown factors, and measurements are device independent. Second, shear waves generated by the push ultrasound beam in SDUV have small amplitudes and decay quickly when propagating through soft tissue. Therefore, the risk of interference caused by shear wave reverberation is minimized. Finally, each SDUV acquisition takes about 0.1 s; therefore, measurements can be selectively placed at a time window during the heart cycle when tissue motion due to cardiac activity is minimum at the measurement sites, if found necessary. Short acquisition time also allows fast acquisition of multiple measurements at different locations within the organ of interest to get a comprehensive assessment of tissue state.
SDUV also has its limitations. For example, this technique provides a single point measurement. Although 2-D imaging is theoretically possible by repeating measurements one location at a time, this would be time consuming with the current SDUV approach. In addition, penetration of SDUV is limited by whether enough ultrasound intensity can be delivered to the depth of measurement to generate sufficient tissue vibration. It is expected that SDUV measurements are feasible at depths 5 to 7 cm from the body surface using modern array transducers. Whether measurements in obese patients are possible remains to be tested. This is a common limitation shared by all ultrasound elasticity imaging techniques. Finally, SDUV assumes local homogeneity for the measurement site and therefore cannot be applied to very small lesions. Shear wave phases measured at 2 locations a few millimeters apart are required with the current SDUV setup. Future research is needed to investigate the minimum lesion size that SDUV can be applied to.
It is important to note that ARFI [12] uses transient shear waves and SDUV uses periodic shear waves, which leads to several differences between these 2 methods. First, shear wave speed is estimated from the arrival time of the shear wave front in ARFI, but from phase differences in SDUV. Second, shear wave speed is estimated from a transient wave front in ARFI, as opposed to multiple cycles of shear wave vibration in SDUV. Therefore, SDUV may be more advantageous when tissue displacement or SNR is low. Third, dispersion of shear wave velocity is used in SDUV to solve for viscosity, whereas currently this is not studied by ARFI [12].
There are numerous potential clinical applications for quantifying tissue elasticity and viscosity using SDUV. One such application is for liver fibrosis staging. Liver fibrosis/cirrhosis can be caused by various chronic liver diseases and thus has high prevalence (hundreds of millions incidences worldwide and around 900,000 patients in the United States) [23]. Liver biopsy is currently the gold standard for the diagnosis and staging of liver fibrosis, but it is invasive and can cause significant complications. Recently, it has been demonstrated that liver elasticity (i.e., stiffness) can be used for fibrosis staging [14], [24], [25]. Liver fibrosis is a diffuse disease and therefore requires quantitative measurements. SDUV as described above would have an ideal application as “virtual biopsy” of liver stiffness and viscosity using ultrasound.
VI. Conclusions
This study demonstrates that the frequency dispersion characteristic of shear wave speed in tissue as measured by SDUV can be used to quantify both tissue elasticity and viscosity. Shear waves can be generated and detected reliably within porcine liver tissue using ultrasound push beam and detect beam. Feasibility of an intermittent pulse sequence that may potentially make SDUV compatible with current ultrasound scanners is demonstrated with in vivo experiments using a dual transducer prototype simulating the operation of a single array transducer.
Acknowledgments
This study was supported by NIH grant EB02167.
The authors would like to thank Steve Krage and Jill L. Anderson for help with animal experiments.
Footnotes
Disclosure: Dr. Chen and Dr. Greenleaf have a potential financial interest in SDUV, and patent applications have been filed for the technology.
References
- 1.Sarvazyan AP, Rudenko OV, Swanson SD, Fowlkes JB, Emelianov SY. Shear wave elasticity imaging: A new ultrasonic technology of medical diagnostics. Ultrasound Med Biol. 1998 Nov;24(9):1419–1435. doi: 10.1016/s0301-5629(98)00110-0. [DOI] [PubMed] [Google Scholar]
- 2.Gao L, Parker KJ, Lerner RM, Levinson SF. Imaging of the elastic properties of tissue—A review. Ultrasound Med Biol. 1996;22(8):959–977. doi: 10.1016/s0301-5629(96)00120-2. [DOI] [PubMed] [Google Scholar]
- 3.Ophir J, Alam SK, Garra B, Kallel F, Konofagou E, Krouskop T, Varghese T. Elastography: Ultrasonic estimation and imaging of the elastic properties of tissues. Proc Inst Mech Eng [H] 1999;213(3):203–233. doi: 10.1243/0954411991534933. [DOI] [PubMed] [Google Scholar]
- 4.Greenleaf JF, Fatemi M, Insana M. Selected methods for imaging elastic properties of biological tissues. Annu Rev Biomed Eng. 2003 Apr;5:57–78. doi: 10.1146/annurev.bioeng.5.040202.121623. [DOI] [PubMed] [Google Scholar]
- 5.Parker KJ, Taylor LS, Gracewski S, Rubens DJ. A unified view of imaging the elastic properties of tissue. J Acoust Soc Am. 2005 May;117(5):2705–2712. doi: 10.1121/1.1880772. [DOI] [PubMed] [Google Scholar]
- 6.Muthupillai R, Lomas DJ, Rossman PJ, Greenleaf JF, Manduca A, Ehman RL. Magnetic resonance elastography by direct visualization of propagating acoustic strain waves. Science. 1995;269(5232):1854–1857. doi: 10.1126/science.7569924. [DOI] [PubMed] [Google Scholar]
- 7.Lerner RM, Huang SR, Parker KJ. Sonoelasticity images derived from ultrasound signals in mechanically vibrated tissues. Ultrasound Med Biol. 1990;16(3):231–239. doi: 10.1016/0301-5629(90)90002-t. [DOI] [PubMed] [Google Scholar]
- 8.Ophir J, Cespedes I, Ponnekanti H, Yazdi Y, Li X. Elastography: A quantitative method for imaging the elasticity of biological tissues. Ultrason Imaging. 1991 Apr;13(2):111–134. doi: 10.1177/016173469101300201. [DOI] [PubMed] [Google Scholar]
- 9.Fatemi M, Greenleaf JF. Ultrasound-stimulated vibroacoustic spectrography. Science. 1998 Apr;280:82–85. doi: 10.1126/science.280.5360.82. [DOI] [PubMed] [Google Scholar]
- 10.Nightingale KR, Palmeri ML, Nightingale RW, Trahey GE. On the feasibility of remote palpation using acoustic radiation force. J Acoust Soc Am. 2001 Jul;110(1):625–634. doi: 10.1121/1.1378344. [DOI] [PubMed] [Google Scholar]
- 11.Sandrin L, Tanter M, Gennisson JL, Catheline S, Fink M. Shear elasticity probe for soft tissues with 1-D transient elastography. IEEE Trans Ultrason Ferroelectr Freq Control. 2002 Apr;49(4):436–446. doi: 10.1109/58.996561. [DOI] [PubMed] [Google Scholar]
- 12.Nightingale K, McAleavey S, Trahey G. Shear-wave generation using acoustic radiation force: In vivo and ex vivo results. Ultrasound Med Biol. 2003 Dec;29(12):1715–1723. doi: 10.1016/j.ultrasmedbio.2003.08.008. [DOI] [PubMed] [Google Scholar]
- 13.Wu Z, Taylor LS, Rubens DJ, Parker KJ. Sonoelastographic imaging of interference patterns for estimation of the shear velocity of homogeneous biomaterials. Phys Med Biol. 2004 Mar;49(6):911–922. doi: 10.1088/0031-9155/49/6/003. [DOI] [PubMed] [Google Scholar]
- 14.Huwart L, Peeters F, Sinkus R, Annet L, Salameh N, ter Beek LC, Horsmans Y, Van Beers BE. Liver fibrosis: Non-invasive assessment with MR elastography. NMR Biomed. 2006 Apr;19(2):173–179. doi: 10.1002/nbm.1030. [DOI] [PubMed] [Google Scholar]
- 15.Salameh N, Peeters F, Sinkus R, Abarca-Quinones J, Annet L, Ter Beek LC, Leclercq I, Van Beers BE. Hepatic viscoelastic parameters measured with MR elastography: Correlations with quantitative analysis of liver fibrosis in the rat. J Magn Reson Imaging. 2007 Oct;26(4):956–962. doi: 10.1002/jmri.21099. [DOI] [PubMed] [Google Scholar]
- 16.Bercoff J, Muller M, Tanter M, Fink M. Study of viscous and elastic properties of soft tissues using supersonic shear imaging. presented at the IEEE Int. Ultrasonics Symp; 2003. [Google Scholar]
- 17.Bercoff J, Tanter M, Fink M. Supersonic shear imaging: A new technique for soft tissue elasticity mapping. IEEE Trans Ultrason Ferroelectr Freq Control. 2004 Apr;51(4):396–409. doi: 10.1109/tuffc.2004.1295425. [DOI] [PubMed] [Google Scholar]
- 18.Chen S, Fatemi M, Greenleaf JF. Quantifying elasticity and viscosity from measurement of shear wave speed dispersion. J Acoust Soc Am. 2004 Jun;115(6):2781–2785. doi: 10.1121/1.1739480. [DOI] [PubMed] [Google Scholar]
- 19.Zheng Y, Chen SG, Tan W, Kinnick R, Greenleaf JF. Detection of tissue harmonic motion induced by ultrasonic radiation force using pulse-echo ultrasoundand Kalman filter. IEEE Trans Ultrason Ferroelectr Freq Control. 2007 Feb;54(2):290–300. doi: 10.1109/tuffc.2007.243. [DOI] [PubMed] [Google Scholar]
- 20.Catheline S, Gennisson JL, Delon G, Fink M, Sinkus R, Abouelkaram S, Culioli J. Measurement of viscoelastic properties of homogeneous soft solid using transient elastography: An inverse problem approach. J Acoust Soc Am. 2004 Dec;116(6):3734–3741. doi: 10.1121/1.1815075. [DOI] [PubMed] [Google Scholar]
- 21.Abbott JG. Rationale and derivation of MI and TI—A review. Ultrasound Med Biol. 1999 Mar;25(3):431–441. doi: 10.1016/s0301-5629(98)00172-0. [DOI] [PubMed] [Google Scholar]
- 22.Nightingale K, Soo MS, Nightingale R, Trahey G. Acoustic radiation force impulse imaging: In vivo demonstration of clinical feasibility. Ultrasound Med Biol. 2002 Feb;28(2):227–235. doi: 10.1016/s0301-5629(01)00499-9. [DOI] [PubMed] [Google Scholar]
- 23.Friedman SL. Liver fibrosis–From bench to bedside. J Hepatol. 2003;38(Suppl 1):S38–S53. doi: 10.1016/s0168-8278(02)00429-4. [DOI] [PubMed] [Google Scholar]
- 24.Sandrin L, Fourquet B, Hasquenoph JM, Yon S, Fournier C, Mal F, Christidis C, Ziol M, Poulet B, Kazemi F, Beaugrand M, Palau R. Transient elastography: A new noninvasive method for assessment of hepatic fibrosis. Ultrasound Med Biol. 2003 Dec;29(12):1705–1713. doi: 10.1016/j.ultrasmedbio.2003.07.001. [DOI] [PubMed] [Google Scholar]
- 25.Yin M, Talwalkar JA, Glaser KJ, Manduca A, Grimm RC, Rossman PJ, Fidler JL, Ehman RL. Assessment of hepatic fibrosis with magnetic resonance elastography. Clin Gastroenterol Hepatol. 2007;5(10):1207–1213. e2. doi: 10.1016/j.cgh.2007.06.012. [DOI] [PMC free article] [PubMed] [Google Scholar]
- 26.Urban MW, Chen S, Greenleaf JF. Harmonic motion detection in a vibrating scattering medium. IEEE Trans Ultrason Ferroelectr Freq Control. 2008;55(9):1956–1974. doi: 10.1109/TUFFC.887. [DOI] [PMC free article] [PubMed] [Google Scholar]