

INTRODUCTION
The prevalence of pediatric asthma in the United States has been increasing in recent years, particularly in urban areas.1 Additionally, asthma is one of the leading causes of school absenteeism responsible for an estimated 12.8 million school days missed in 2003.2 Multiple environmental factors such as pollution, cigarette smoke, and allergen exposure have been implicated in contributing to this rise. It is clear that home exposure to common indoor allergens such as pets, dust mites, mice, and cockroaches contributes to asthma exacerbations in children sensitized to these allergens.3-7 However, the role of allergen exposure in other commonly encountered settings, such as schools, is unclear. While the majority of exposure to indoor allergens occurs in homes, children spend a large portion of their day at school. More importantly, elementary school-aged children spend a large amount of time in a single classroom. Interventions focusing on environmental allergen reduction in the school setting could potentially benefit a large number of children.
To date, there are no US studies comparing allergen levels in homes versus schools for children with asthma. The purpose of this study was to evaluate indoor allergen levels in 4 elementary schools in an urban city in Northeastern United States and to compare these levels with home allergen levels from a subset of students attending these schools. We also identified students with asthma and obtained information on absenteeism due to asthma. Our primary goal was to determine if exposure to allergens in the school were significantly different from exposures found in the home, particularly among asthmatic children. This focus on asthmatic children has not yet been published in the United States.
METHODS
Four public elementary schools were selected from a major urban area in the Northeastern U.S. All of the schools were within 5 miles of each other. Permission to obtain environmental samples was obtained from the school department superintendent and the principal of each individual school. The study was approved by the Institutional Review Board of Children's Hospital, Boston.
Vacuum-collected settled dust samples were obtained from different rooms in each school. In addition to classrooms, samples were also taken from cafeterias, gymnasiums, auditoriums, and libraries. All rooms had hardwood floors or tiles with some small area rugs. Samples were collected by trained professionals using a hand-held vacuum (model BB870-AD;Orek Corporation, New Orleans, Louisiana), with a dust collector (Dust Collector, Johns Hopkins University, Baltimore, Maryland) fitted into the inlet hose of the vacuum using a standardized protocol.8 The school room was vacuumed for a total of 6 minutes per sample, 3 minutes on the floor and 3 minutes on other surfaces (desks, chairs) in a standard manner as in previous school studies.9
In addition to school samples, home dust samples were also collected. These samples were collected from the bedrooms of students with corresponding classroom dust samples. The participating students electively volunteered to have home sampling performed. Home dust samples were collected in the same manner as in the school, but from the bedroom floor. A total of 38 bedroom dust samples were obtained.
After the dust samples were collected, the dust was sifted through a 40-mesh metal sieve (>425 micron particle exclusion), weighed, and aliquoted into screw-top microcentrifuge tubes which were then stored at −20°C until extraction. Fine dust was then extracted in borate buffered saline with Tween 20 (50 mg dust/ml buffer) for analysis of selected indoor allergens.
Enzyme-Linked ImmunoSorbent Assays (ELISA) were used to measure allergens from cockroach (Bla g 2), cat dander (Fel d 1), dog dander (Can f 1), mouse urinary protein (MUP), and dust mite (Der p 1 and Der f 1). These assays are two-site monoclonal antibody ELISAs (cat), a monoclonal/polyclonal sandwich ELISAs (cockroach and dog allergens), and a polyclonal assay for MUP, and have been previously described.10-12 The lower limits of detection (LLOD) are 0.016 μg/g of dust for Bla g 2, 0.012 μg/g for Fel d 1, 0.05 μg/g for Can f 1, 0.25 μg/g of for MUP, 0.03 μg/g for Der f 1 and Der p 1.
Questionnaires regarding asthma history and demographics were distributed to students with instructions to take the questionnaires home to be completed by the students' parents. Questionnaires were given to an equivalent number of classrooms in each school. At each school, 3 classrooms from grades 4-6 were included in the questionnaire portion of the study. The questionnaires were voluntarily returned. Although all four schools had dust samples collected, we only distributed questionnaires in 3 of the 4 schools (Schools 1, 2, and 3). All classes given questionnaires had a corresponding classroom dust sample collected. These questionnaires ascertained information about history of physician-diagnosed asthma, wheezing history, and number of days missed from school in the previous year due to asthma. Questionnaires also asked sociodemographic information such as gender, age, race or ethnicity, and the annual household family income (< $30,000, $30,000 to $49,999, and > $50,000).
STATISTICAL ANALYSIS
Geometric means were calculated for each allergen in schools compared to homes. Values below the lower limit of detection were assigned the limit of detection for calculation of geometric means as previously performed in similar studies.10, 13 Geometric means were also calculated for allergen levels from paired classroom and bedroom dust samples of children with asthma. The Wilcoxon rank-sum test (Mann-Whitney U) or Wilcoxon signed-rank test were used to compare independent and paired populations, respectively.
Furthermore, comparisons were made between the 3 schools whose students completed asthma questionnaires. The geometric mean of MUP levels and the mean numbers of school days missed due to asthma were compared among these schools using the Kruskal Wallis Test. Subsequently, pairwise comparisons using Wilcoxon rank-sum test (Mann-Whitney U) were analyzed in regards to MUP levels and school days missed.
Finally, a comparison was made between classrooms with higher MUP levels (greater than the median MUP level) to classrooms with lower MUP levels (equal to or less than the median MUP level), regardless of the school. The mean number of school days missed due to asthma was compared in these two groups using the Wilcoxon rank-sum test (Mann-Whitney U).
RESULTS
The four schools were located within the same urban area and ranged from 50 years old to 75 years old. Basic demographic data as reported by the schools is provided. (see Table 1).
Table 1.
Overall Comparison of Schools Participating in Study
| SCHOOL 1 | SCHOOL 2 | SCHOOL 3 | SCHOOL 4 | |
|---|---|---|---|---|
| School Characteristics (All Students) |
N=303 | N=914 | N=376 | N= 232 |
| Location of School | Urban | Urban | Urban | Urban |
| Age of School (Years) | 71 | 51 | 76 | 71 |
| Number of Classrooms | 11 | 35 | 16 | 9 |
| Race or Ethnicity of Students | ||||
| White | 82 (27.0%) | 317 (34.7%) | 260 (69.1%) | 10 (4.3%) |
| Black | 196 (64.7%) | 302 (33.0%) | 103 (27.3%) | 108 (46.5%) |
| Hispanic | 19 (6.2%) | 70 (7.7%) | 9 (2.4%) | 91 (39.2%) |
| Asian/ Other | 6 (2.0%) | 225 (24.6%) | 4 (1.0%) | 23 (9.9%) |
A total of 46 vacuum-collected settled dust samples were obtained from the schools. Samples were mostly taken from classrooms (n=33; 72%), but also from cafeterias (n=7; 15%), gymnasium/auditoriums (n=4; 9%), and libraries (n=2; 4%). Each school had at least 5 classrooms and 6 total rooms sampled. Figure 1 shows the geometric means of each of the six indoor allergens in schools compared to homes for all dust samples measured. Levels of most of the allergens measured were similar between schools and homes. However, there were significantly higher levels of mouse allergen in schools versus homes (Geometric Mean Schools = 1.66 μg/g; range: LLOD to 238 μg/g; versus Geometric Mean Homes = 0.41 μg/g; range: LLOD to 6.97 μg/g; p < 0.001; Wilcoxan rank-sum test), and significantly higher levels of Der f 1 in homes versus schools (Geometric Mean Homes = 0.66 μg/g; range of LLOD to 26 μg/g; versus Geometric Mean Schools = 0.05 μg/g; range of LLOD to 0.46 μg/g; p < 0.001; Wilcoxan rank-sum test).
Figure 1.
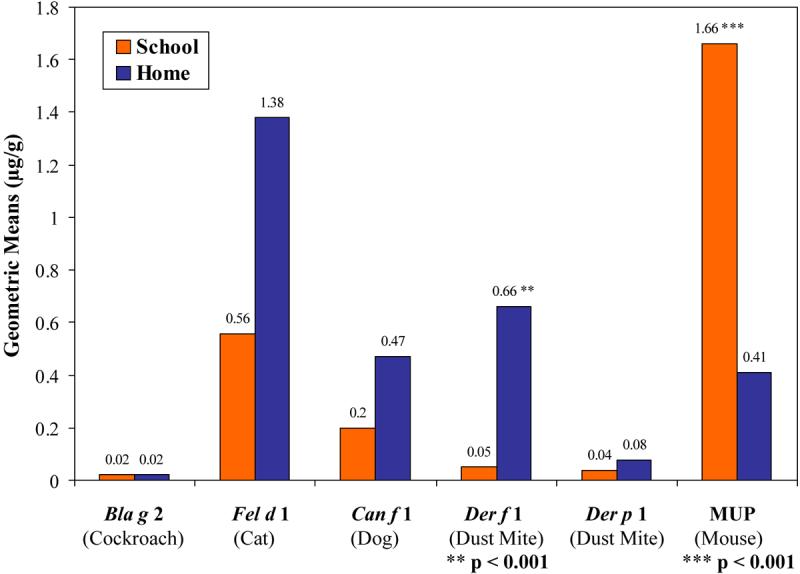
Geometric Means of Antigen Levels in All Samples (School vs. Home).
Figure 2 shows the distribution of MUP in schools compared to homes. School MUP levels, as taken from dust samples, ranged from below the lower limit of detection to 238 μg/g. Home MUP levels ranged from below lower limit of detection to 6.97 μg/g. The majority (61%) of school dust samples were greater than 0.5 μg/g, with 39% of samples being greater than 2 μg/g. In contrast, only 23% of home dust samples were greater than 0.5 μg/g, with only 6% of samples greater than 2 μg/g. The highest MUP level (238 μg/g) was noted in a cafeteria. However, the other high MUP levels (> 20 μg/g) were evenly distributed among one cafeteria, one library, and three classrooms. The three highest classroom MUP levels were 109.0 μg/g, 79.1 μg/g, and 46.4 μg/g.
Figure 2.

Distribution of Levels of MUP Measured in All Samples. Each bar represents the percentage of samples with corresponding MUP levels μg/g (School vs. Home).
Of the 38 students with both classroom and home samples, 23 students reported a diagnosis of asthma on questionnaires. For this subset of 23 children, there were differences between the allergen levels measured in their respective classrooms compared to the levels measured in their bedrooms (see Table 2). The highest geometric means for these students were 6.45 μg/g for MUP in their classrooms and 1.31 μg/g for Fel d 1 in their bedrooms. In this particular subgroup, significant differences were noted between the geometric means of Der f 1 and MUP. For Der f 1, the classroom geometric mean of 0.04 μg/g (range from LLOD to 0.07 μg/g) was significantly lower than the home geometric mean of 0.66 μg/g (range from LLOD to 26 μg/g); p < 0.001; Wilcoxan signed-rank test. For MUP, the classroom geometric mean of 6.45 μg/g (range from 0.31 μg/g to 46.36 μg/g) was significantly higher than the home geometric mean of 0.44 μg/g (range from LLOD to 6.97 μg/g); p < 0.001; Wilcoxan signed-rank test.
Table 2.
Allergen Levels in Paired Classrooms and Bedrooms for a Subset of Children with Asthma in the 3 Schools Completing Asthma Questionnaires
| Allergen | Location | Samples | Range | Geometric Mean | (25th to 75th Percentile) |
|---|---|---|---|---|---|
| Bla g 2 | Bedroom | 23 | < LLOD | <LLOD | All values were <LLOD |
| Classroom | 23 | < LLOD – 0.024 | 0.017 | (<LLOD – <LLOD) | |
| Fel d 1 | Bedroom | 23 | <LLOD – 104.00 | 1.31 | (0.16 – 16.92) |
| Classroom | 23 | 0.17 – 4.36 | 1.04 | (0.23 – 3.45) | |
| Can f 1 | Bedroom | 23 | <LLOD – 102.00 | 0.43 | (<LLOD – 2.68) |
| Classroom | 23 | <LLOD – 2.88 | 0.35 | (0.16 – 0.66) | |
| Der f 1 | Bedroom | 23 | <LLOD – 26.00 | 0.66 | (0.08 – 6.27) p < 0.001 |
| Classroom | 23 | <LLOD – 0.07 | 0.04 | (<LLOD – 0.06) | |
| Der p 1 | Bedroom | 23 | <LLOD – 27.55 | 0.08 | (<LLOD – 0.07) |
| Classroom | 23 | <LLOD – 0.04 | 0.03 | (<LLOD – 0.03) | |
| MUP | Bedroom | 23 | <LLOD – 6.97 | 0.44 | (<LLOD – 0.82) |
| Classroom | 23 | 0.31 – 46.36 | 6.45 | (2.42 – 12.10) p < 0.001 | |
p – values were calculated using the Wilcoxan signed-rank test for comparison of paired sets of non-parametric data
A summary of the asthma questionnaire data returned from three schools is provided (Table 3). Of those who returned the questionnaires, we identified 21, 10, and 19 students with a parental report of physician-diagnosed asthma in each of the 3 schools respectively. Of the 50 total students identified with asthma, we obtained paired classroom and bedroom samples for 23 of these students, as reported previously. A comparison of the three schools completing asthma questionnaires demonstrated that these schools had similar and almost undetectable levels of Bla g 2, Der f 1, and Der p 1. School 3 had the lowest levels of Fel d 1 and Can f 1.
Table 3.
Comparison of Students with Reported Asthma Based on School
| SCHOOL 1 | SCHOOL 2 | SCHOOL 3 | |
|---|---|---|---|
| Basic Demographics (Students with Asthma) | n = 21 | n = 10 | n = 19 |
| AGE | |||
| Median Age in Years (Range) | 10.5 (9-12) | 11.0 (10-12) | 10.7 (9-12) |
| SEX n (%) | |||
| Male | 8 (38.1%) | 7 (70%) | 13 (68.4%) |
| RACE or ETHNICITY n (%) | |||
| White | 8 (38.1%) | 1 (10%) | 8 (42.1%) |
| Black | 11 (52.4%) | 5 (50%) | 7 (36.8%) |
| Hispanic | 0 (0%) | 4 (40%) | 3 (15.8%) |
| Asian/Other | 2 (9.5%) | 0 (0%) | 1 (5.3%) |
| FAMILY INCOME n (%) | |||
| < $30,000 | 3 (14.3%) | 3 (30%) | 2 (10.5%) |
| $30,000 - $49,000 | 6 (28.6%) | 4 (40%) | 6 (31.6%) |
| > $ 50,000 | 7 (33.3%) | 1 (10%) | 9 (47.4%) |
| Don't Know | 3 (14.3%) | 1 (10%) | 1 (5.3%) |
| Refuse to Say | 2 (9.5%) | 1 (10%) | 1 (5.3%) |
| Asthma Severity Per Report | |||
|
Missed School Days due to Asthma (Mean Days per Year) |
1.57 | 2.30 | 3.58 |
| School Allergen Levels Geometric Mean (μg/g) | |||
| Cockroach (Bla g 2) | 0.02 | 0.02 | 0.02 |
| Cat (Fel d 1) | 1.08 | 1.60 | 0.17 |
| Dog (Can f 1) | 0.27 | 0.59 | 0.11 |
| Dust Mite (Der f 1) | 0.05 | 0.04 | 0.04 |
| Dust Mite (Der p 1) | 0.05 | 0.03 | 0.03 |
| Mouse (MUP) | 0.94 | 0.96 | 8.36 |
A comparison of MUP levels in these three schools was performed. School 1 and School 2 had MUP levels of 0.94 μg/g and 0.96 μg/g, respectively, while School 3 had a geometric mean MUP of 8.36 μg/g. These three levels were different (p = 0.005; Kruskal Wallis Test). Pairwise testing demonstrated that MUP levels from School 1 and School 2 were not statistically different from each other (p=0.427; Wilcoxan rank-sum test). However, MUP levels from School 1 (p=0.002; Wilcoxan rank-sum test) and School 2 (p=0.023; Wilcoxan rank-sum test) were different from School 3 when compared individually to School 3.
Similarly, a comparison of mean missed days due to asthma was performed for these three schools. Parents of students in School 1 and School 2 reported 1.57 and 2.30 mean missed school days per year due to asthma, while School 3 reported 3.58 days per year per student with reported asthma (p = 0.057; Kruskal Wallis Test). Pairwise comparison showed that days missed due to asthma were statistically different in School 1 compared with School 3 (p = 0.018; Wilcoxan rank-sum test). A comparison of the missed days of school due to asthma in relation to the school MUP levels is presented in Table 4.
Table 4.
MUP Levels (by school) compared with Days Absent (due to asthma)
| School | Samples (MUP) |
Range (MUP) |
Geometric Mean (MUP) |
(25th to 75th Percentile) (MUP) |
Students with Asthma |
Mean Days Absent due to Asthma |
|---|---|---|---|---|---|---|
| School 1 | 20 | 0.25 – 30.30 | 0.94 | (0.25 – 4.51) | 21 | 1.57 |
| School 2 | 6 | 0.35 – 8.19 | 0.96 | (0.36 – 3.86) | 10 | 2.30 |
| School 3 | 14 | 0.42 – 238.00 | 8.36 | (0.61 – 80.03) | 19 | 3.58 |
| * p = 0.005 | ** p = 0.057 | |||||
GM of MUP: Kruskal Wallis of all three schools
Mean days absent due to asthma: Kruskal Wallis of all three schools
Comparison of classrooms, regardless of school, revealed that students in classes with higher MUP levels missed 3.13 days per year due to asthma compared to students in lower MUP classrooms who missed 1.88 days per year (p = 0.099; Wilcoxan rank-sum test).
DISCUSSION
Our school study is the first in the United States to compare classroom and school allergen levels with home allergen levels in children with asthma. In this study of four urban Northeastern US schools, we discovered high mouse allergen levels, moderate cat allergen levels, low dog allergen levels, and primarily undetectable levels of dust mite and cockroach allergens in our sampled schools. In classrooms of a subset of students with asthma, we found significantly higher levels of MUP compared to their bedrooms.
The difference in MUP levels was the most important finding of this study. These data indicate that, in our study, there was a subset of children with asthma who were exposed to significantly higher levels of mouse allergen in schools compared to their homes. It does not appear that students were bringing this allergen from their homes as it was found in very low levels throughout all homes in this area. This demonstrates that school 3 provided an exposure of mouse allergen that was independent of homes. This may play an important role in asthma morbidity for students with asthma attending this school. This study was not powered to evaluate allergen exposure and asthma morbidity, but we found that in a school with higher levels of MUP (school 3), parents of students with asthma reported trends towards these students having higher mean number of missed school days due to asthma. While we were not powered to fully adjust for confounders, schools and classrooms with higher mouse allergen levels did not appear to have more non-white students or lower reported household incomes. The main results of this study demonstrate that students may be exposed to allergens in school that they are not necessarily exposed to in the home. Further larger studies evaluating allergen levels in schools and homes of children with asthma may be helpful in understanding the role of allergen exposure specific to the classroom and asthma morbidity.
Previous studies have shown that cat and dog allergens are transported into schools on students clothing.14-19 Our study showed similar results with a high percentage of classrooms reporting detectable levels of cat and dog allergens. On the contrary, the majority of our sampled schools had undetectable levels of dust mite allergen. Other studies have also shown the relative absence of dust mite allergens in schools.17, 20, 21 Our findings also agree with other studies that have shown higher dust mite allergen levels in students homes compared to corresponding classrooms.22
The absence of detectable levels of cockroach in our school and home samples was unique, especially for an inner city environment in the US. This is in contrast to other studies which have documented a high prevalence of cockroach allergen in urban schools and homes in inner cities such as New York City, Baltimore, Maryland, and Birmingham, Alabama.10, 13, 21, 23, 24 In contrast, a recent study from early childhood education centers in Arkansas reported relatively few centers with detectable cockroach allergen.25 Studies from other countries such as Sweden and New Zealand have reported very low levels of cockroach allergens in schools and day care centers.14, 17 It is possible that different cities, even within the United States, have different levels of indoor allergens.
We found a significant difference between MUP levels in the schools and MUP levels in the homes of students in these schools. The majority (89%) of sampled school rooms contained measurable MUP with a geometric mean of 1.66 μg/g. Other studies, in other parts of the US, have reported a high prevalence of mouse allergens in urban schools. Chew et al found mouse allergen (MUP) to be prevalent in 81% of dust samples collected from urban schools, with 78% of classrooms reporting high levels (≥ 2 μg/g) on at least one occasion.10 Amr et al reported a mean level of mouse allergen (Mus m 1) of 6.24 μg/g in collected school dust samples.21 Perry et al reported detectable levels of mouse allergens in 100% of studied early education centers.25 Similar studies evaluating home environments alone have found mouse allergens prevalent in urban homes.13, 26 In our study, most of the studied homes did not have any detectable levels of MUP. Our study shows that a subset of students in the Northeast may encounter allergens, such as MUP, in other environments that are not present in the home.
While there are many studies on allergen exposures in schools, there are relatively few studies which evaluate the effect on asthma morbidity. In Sweden, children with asthma were evaluated as they returned to school after summer vacation. Specifically, children with an allergy to cat, but no current cat exposure, were evaluated. It was demonstrated that these children had an increase in asthma symptoms, an increase in asthma medication use, and a decrease in peak expiratory flows after returning to school if their classroom had a significant number of children from homes with cats.27 Similarly, children with asthma have reported increased asthma symptoms when attending schools with higher levels of dog allergen.15 Mouse allergen was not analyzed in these studies. The only United States study evaluating asthma prevalence and school allergens was performed in Baltimore. This study showed a positive correlation between asthma prevalence by health department report and school cockroach allergen levels.21 While it is unclear what levels of mouse allergen are truly associated with asthma morbidity, particularly in schools and school-aged children, there is some suggestion that levels greater than 0.5 μg/g in homes of preschool children are associated with asthma morbidity if sensitized.3 Our study was not designed to fully evaluate the role between classroom and school mouse allergen levels and asthma.
We realize that our study had several limitations. Our study may have included selection bias as participation for both home sampling and completing the asthma questionnaire were voluntary. Additionally, we did not have measures of potential confounders such as smoke and pollution exposure, upper respiratory infections, weather, and degree of atopy. It is possible that the profile of allergen levels, both in schools and homes, may differ if more schools and more students were studied. Our findings may be due to markers of socioeconomic status; however, schools and classrooms with higher mouse allergen levels did not appear to have more non-white students or lower reported household incomes. Despite the potential for misclassification in physician or parental report of asthma (physicians may not be present when a child wheezes), parental report is a standard outcome in American Thoracic Society (ATS) and International Study of Asthma and Allergies in Childhood (ISAAC) questionnaires, and in many US studies is highly predictive of asthma,28 slower lung function growth,29 and methacholine reactivity.30 While other rodent allergens such as rat (Rat n 1) or guinea pig (Cav c 1) were not measured in our study, our assay was specific for the major mouse allergen and previous studies do not show cross-reactivitiy between the major allergens of these rodents.31-33 Furthermore, we did not have information regarding allergen sensitization, specifically mouse, on the children with asthma enrolled in our study.
In summary, our results demonstrate that children with asthma encounter varying levels of allergens in environments outside the home, such as schools. In addition, we found higher levels of mouse allergen in the schools we evaluated compared to the homes that we evaluated from students in these schools. Allergen exposure outside of the home may be a potentially important trigger for asthma and should be further investigated.
Acknowledgments
Declaration of Funding: Dr. Sheehan is supported by an NIH NRSA grant (T32-AI-007512). Dr. Phipatanakul is supported by an NIH K-23 grant (AI-054972) and an NIH R-01 grant (AI-073964).
REFERENCES
- 1.Wood RA. Pediatric asthma. Jama. 2002;288:745–7. doi: 10.1001/jama.288.6.745. [DOI] [PubMed] [Google Scholar]
- 2.Akinbami L. The State of Childhood Asthma, United States, 1980-2005. 2006 [PubMed] [Google Scholar]
- 3.Matsui EC, Eggleston PA, Buckley TJ, Krishnan JA, Breysse PN, Rand CS, et al. Household mouse allergen exposure and asthma morbidity in inner-city preschool children. Ann Allergy Asthma Immunol. 2006;97:514–20. doi: 10.1016/S1081-1206(10)60943-X. [DOI] [PubMed] [Google Scholar]
- 4.Rosenstreich DL, Eggleston P, Kattan M, Baker D, Slavin RG, Gergen P, et al. The role of cockroach allergy and exposure to cockroach allergen in causing morbidity among inner-city children with asthma. N Engl J Med. 1997;336:1356–63. doi: 10.1056/NEJM199705083361904. [DOI] [PubMed] [Google Scholar]
- 5.Ingram JM, Sporik R, Rose G, Honsinger R, Chapman MD, Platts-Mills TA. Quantitative assessment of exposure to dog (Can f 1) and cat (Fel d 1) allergens: relation to sensitization and asthma among children living in Los Alamos, New Mexico. J Allergy Clin Immunol. 1995;96:449–56. doi: 10.1016/s0091-6749(95)70286-5. [DOI] [PubMed] [Google Scholar]
- 6.Phipatanakul W, Litonjua AA, Platts-Mills TA, Naccara LM, Celedon JC, Abdulkerim H, et al. Sensitization to mouse allergen and asthma and asthma morbidity among women in Boston. J Allergy Clin Immunol. 2007 doi: 10.1016/j.jaci.2007.05.010. [DOI] [PMC free article] [PubMed] [Google Scholar]
- 7.Sporik R, Chapman MD, Platts-Mills TA. House dust mite exposure as a cause of asthma. Clin Exp Allergy. 1992;22:897–906. doi: 10.1111/j.1365-2222.1992.tb02062.x. [DOI] [PubMed] [Google Scholar]
- 8.Mitchell H, Senturia Y, Gergen P, Baker D, Joseph C, McNiff-Mortimer K, et al. Design and methods of the National Cooperative Inner-City Asthma Study. Pediatric Pulmonology. 1997;24:237–52. doi: 10.1002/(sici)1099-0496(199710)24:4<237::aid-ppul3>3.0.co;2-h. [DOI] [PubMed] [Google Scholar]
- 9.Smedje G, Norback D, Edling C. Asthma among secondary schoolchildren in relation to the school environment. Clin Exp Allergy. 1997;27:1270–8. [PubMed] [Google Scholar]
- 10.Chew GL, Correa JC, Perzanowski MS. Mouse and cockroach allergens in the dust and air in northeastern United States inner-city public high schools. Indoor Air. 2005;15:228–34. doi: 10.1111/j.1600-0668.2005.00363.x. [DOI] [PubMed] [Google Scholar]
- 11.Ingram JM, Sporik R, Rose G, Honsinger R, Chapman MD, Platts-Mills TA. Quantitative assessment of exposure to dog (Can f 1) and cat (Fel d 1) allergens: relation to sensitization and asthma among children living in Los Alamos, New Mexico. Journal of Allergy and Clinical Immunology. 1995;96:449–56. doi: 10.1016/s0091-6749(95)70286-5. [DOI] [PubMed] [Google Scholar]
- 12.Phipatanakul W, Gold DR, Muilenberg M, Sredl DL, Weiss ST, Celedon JC. Predictors of indoor exposure to mouse allergen in urban and suburban homes in Boston. Allergy. 2005;60:697–701. doi: 10.1111/j.1398-9995.2005.00825.x. [DOI] [PMC free article] [PubMed] [Google Scholar]
- 13.Chew GL, Perzanowski MS, Miller RL, Correa JC, Hoepner LA, Jusino CM, et al. Distribution and determinants of mouse allergen exposure in low-income New York City apartments. Environ Health Perspect. 2003;111:1348–51. doi: 10.1289/ehp.6124. [DOI] [PMC free article] [PubMed] [Google Scholar]
- 14.Oldfield K, Siebers R, Crane J. Endotoxin and indoor allergen levels in kindergartens and daycare centres in Wellington, New Zealand. N Z Med J. 2007;120:U2400. [PubMed] [Google Scholar]
- 15.Kim JL, Elfman L, Mi Y, Johansson M, Smedje G, Norback D. Current asthma and respiratory symptoms among pupils in relation to dietary factors and allergens in the school environment. Indoor Air. 2005;15:170–82. doi: 10.1111/j.1600-0668.2005.00334.x. [DOI] [PubMed] [Google Scholar]
- 16.Munir AK, Einarsson R, Schou C, Dreborg SK. Allergens in school dust. I. The amount of the major cat (Fel d I) and dog (Can f I) allergens in dust from Swedish schools is high enough to probably cause perennial symptoms in most children with asthma who are sensitized to cat and dog. J Allergy Clin Immunol. 1993;91:1067–74. doi: 10.1016/0091-6749(93)90221-z. [DOI] [PubMed] [Google Scholar]
- 17.Perzanowski MS, Ronmark E, Nold B, Lundback B, Platts-Mills TA. Relevance of allergens from cats and dogs to asthma in the northernmost province of Sweden: schools as a major site of exposure. J Allergy Clin Immunol. 1999;103:1018–24. doi: 10.1016/s0091-6749(99)70173-9. [DOI] [PubMed] [Google Scholar]
- 18.Berge M, Munir AK, Dreborg S. Concentrations of cat (Fel d1), dog (Can f1) and mite (Der f1 and Der p1) allergens in the clothing and school environment of Swedish schoolchildren with and without pets at home. Pediatr Allergy Immunol. 1998;9:25–30. doi: 10.1111/j.1399-3038.1998.tb00296.x. [DOI] [PubMed] [Google Scholar]
- 19.Almqvist C, Larsson PH, Egmar AC, Hedren M, Malmberg P, Wickman M. School as a risk environment for children allergic to cats and a site for transfer of cat allergen to homes. J Allergy Clin Immunol. 1999;103:1012–7. doi: 10.1016/s0091-6749(99)70172-7. [DOI] [PubMed] [Google Scholar]
- 20.Instanes C, Hetland G, Berntsen S, Lovik M, Nafstad P. Allergens and endotoxin in settled dust from day-care centers and schools in Oslo, Norway. Indoor Air. 2005;15:356–62. doi: 10.1111/j.1600-0668.2005.00381.x. [DOI] [PubMed] [Google Scholar]
- 21.Amr S, Bollinger ME, Myers M, Hamilton RG, Weiss SR, Rossman M, et al. Environmental allergens and asthma in urban elementary schools. Ann Allergy Asthma Immunol. 2003;90:34–40. doi: 10.1016/S1081-1206(10)63611-3. [DOI] [PubMed] [Google Scholar]
- 22.Dungy CI, Kozak PP, Gallup J, Galant SP. Aeroallergen exposure in the elementary school setting. Ann Allergy. 1986;56:218–21. [PubMed] [Google Scholar]
- 23.Abramson SL, Turner-Henson A, Anderson L, Hemstreet MP, Bartholomew LK, Joseph CL, et al. Allergens in school settings: results of environmental assessments in 3 city school systems. J Sch Health. 2006;76:246–9. doi: 10.1111/j.1746-1561.2006.00105.x. [DOI] [PMC free article] [PubMed] [Google Scholar]
- 24.Sarpong SB, Wood RA, Karrison T, Eggleston PA. Cockroach allergen (Bla g 1) in school dust. J Allergy Clin Immunol. 1997;99:486–92. doi: 10.1016/s0091-6749(97)70074-5. [DOI] [PubMed] [Google Scholar]
- 25.Perry TT, Vargas PA, Bufford J, Feild C, Flick M, Simpson PM, et al. Classroom aeroallergen exposure in Arkansas head start centers. Ann Allergy Asthma Immunol. 2008;100:358–63. doi: 10.1016/S1081-1206(10)60599-6. [DOI] [PubMed] [Google Scholar]
- 26.Phipatanakul W, Eggleston PA, Wright EC, Wood RA. Mouse allergen. I. The prevalence of mouse allergen in inner-city homes. The National Cooperative Inner-City Asthma Study. J Allergy Clin Immunol. 2000;106:1070–4. doi: 10.1067/mai.2000.110796. [DOI] [PubMed] [Google Scholar]
- 27.Almqvist C, Wickman M, Perfetti L, Berglind N, Renstrom A, Hedren M, et al. Worsening of asthma in children allergic to cats, after indirect exposure to cat at school. Am J Respir Crit Care Med. 2001;163:694–8. doi: 10.1164/ajrccm.163.3.2006114. [DOI] [PubMed] [Google Scholar]
- 28.Ly NP, Soto-Quiros ME, Avila L, Hunninghake GM, Raby BA, Laskey D, et al. Paternal asthma, mold exposure, and increased airway responsiveness among children with asthma in costa rica. Chest. 2008;133:107–14. doi: 10.1378/chest.07-2130. [DOI] [PubMed] [Google Scholar]
- 29.Dockery DW, Pope CA, 3rd, Xu X, Spengler JD, Ware JH, Fay ME, et al. An association between air pollution and mortality in six U.S. cities. N Engl J Med. 1993;329:1753–9. doi: 10.1056/NEJM199312093292401. [DOI] [PubMed] [Google Scholar]
- 30.Tepas EC, Litonjua AA, Celedon JC, Sredl D, Gold DR. Sensitization to aeroallergens and airway hyperresponsiveness at 7 years of age. Chest. 2006;129:1500–8. doi: 10.1378/chest.129.6.1500. [DOI] [PubMed] [Google Scholar]
- 31.Perry T, Matsui E, Merriman B, Duong T, Eggleston P. The prevalence of rat allergen in inner-city homes and its relationship to sensitization and asthma morbidity. J Allergy Clin Immunol. 2003;112:346–52. doi: 10.1067/mai.2003.1640. [DOI] [PubMed] [Google Scholar]
- 32.Phipatanakul W. Rodent allergens. Curr Allergy Asthma Rep. 2002;2:412–6. doi: 10.1007/s11882-002-0075-1. [DOI] [PubMed] [Google Scholar]
- 33.Swanson MC, Agarwal MK, Yunginger JW, Reed CE. Guinea-pig-derived allergens. Clinicoimmunologic studies, characterization, airborne quantitation, and size distribution. Am Rev Respir Dis. 1984;129:844–9. doi: 10.1164/arrd.1984.129.5.844. [DOI] [PubMed] [Google Scholar]