

Abstract
Despite the functional importance of the medial geniculate body (MGB) in normal hearing, many aspects of its projections to auditory cortex are unknown. We analyzed the MGB projections to thirteen auditory areas in the cat using two retrograde tracers to investigate thalamocortical nuclear origins, topography, convergence, and divergence. MGB divisions and auditory cortex areas were defined independently of the connectional results using architectonic, histochemical, and immunocytochemical criteria. Each auditory cortex area received a unique pattern of input from several MGB nuclei; and these patterns of input identify four groups of cortical areas distinguished by their putative functional affiliations: tonotopic, non-tonotopic, multisensory, and limbic. Each family of areas received projections from a functionally related set of MGB nuclei; some nuclei project to only a few a few areas (e.g., the MGB ventral division to tonotopic areas), and others project to all areas (e.g., the medial division input to every auditory cortical areas and to other regions). Projections to tonotopic areas had fewer nuclear origins than those to multisensory or limbic-affiliated fields. All projections were organized topographically, even those from non-tonotopic nuclei. The few divergent neurons (mean: 2%) are consistent with a model of multiple segregated streams ascending to auditory cortex. The expanded cortical representation of MGB auditory, multisensory, and limbic affiliated streams appears to be a primary facet of forebrain auditory function. The emergence of several auditory cortex representations of characteristic frequency may be a functional multiplication of the more limited maps in the MGB. This expansion suggests emergent cortical roles consistent with the divergence of thalamocortical connections.
Keywords: divergence, convergence, nuclear origins
INTRODUCTION
The medial geniculate body (MGB) is the main thalamic source of auditory input to cortical (Winer et al., 1977) and subcortical (Shinonaga et al., 1994) targets. It has vital roles in signal transformation (Creutzfeldt et al., 1980; Miller et al., 2001), attentional modulation (Steriade et al., 1998), and intracortical communication (Sherman and Guillery, 1996, 1998) that underscore its broad functional impact (Winer, 2006; Winer and Lee, 2007). Lemniscal and non-lemniscal nuclei within the MGB code (Winer and Morest, 1983) and carry streams of high fidelity (Miller et al., 2002), broadly tuned (Calford, 1983), multimodal (Bordi and LeDoux, 1994), and limbic (Clascá et al., 1997) information to primary and non-primary auditory areas, respectively (Andersen et al., 1980). How many such areas exist and their relation with MGB subdivisions is unknown, and is the subject of this study. Despite progress in understanding the areal and laminar distribution of thalamocortical projections using anterograde methods (Huang and Winer, 2000), fundamental connectional questions remain, such as the limits of auditory cortex as related to thalamic connectivity and to the topography of input to the several non-primary areas of auditory cortex. We address these issues with sensitive retrograde tracers and a strategy designed to reveal even highly divergent and convergent thalamocortical projections to remote areas.
Among the thirteen auditory areas now recognized in cat auditory cortex, only five have a tonotopic organization (Imig and Reale, 1980; Reale and Imig, 1980). Eight other areas are regarded as auditory based upon the responsiveness of their cells to acoustic input (Woolsey, 1960; Schreiner and Cynader, 1984; Clarey and Irvine, 1990; He et al., 1997), their connections to MGB divisions (Woolsey, 1960) whose principal brain stem input is from the inferior colliculus (Calford and Aitkin, 1983), by virtue of their projections to the MGB (Winer et al., 2001) and inferior colliculus (Winer et al., 1998), and the effects of behavior-ablation studies that reveal auditory 4 integrative deficits (Cranford and Igarashi, 1977). However, many of these non-tonotopic areas have little apparent role in spatial localization (Jenkins and Merzenich, 1984; Lomber et al., 2007) or frequency analysis (Cranford et al., 1976) and must therefore have other functional assignments. Our goal is to re-examine thalamocortical origins using sensitive tracers to better establish the connectional patterns among all auditory cortical areas, to discern the limits of the MGB projection to the cortex, and to document relations between groups of thalamic nuclei and their cortical targets.
A related question is the relative contribution of different MGB divisions to cortical activity. Several thalamic nuclei project convergently to each area (Winer et al., 1977; Niimi and Matsuoka, 1979), and the salience of each contribution is likely nucleus-and area-specific. Such inputs contribute to receptive field construction (Miller et al., 2001), and may support areal differences based on their relative synaptic impact (Hackett et al., 1998). Numerical estimates of thalamic input weights are not yet available for cat auditory cortex, and they are necessary to specify the functional relationships within and between areas. The construction of such semiquantitative profiles requires a systematic comparison of input that might best begin using retrograde tracers. The most complete studies of feline thalamocortical relations (Winer et al., 1977; Niimi and Matsuoka, 1979) used tracers demonstrably less sensitive than those now available (Llewellyn-Smith et al., 1990; Luppi et al., 1990; Ruigrok et al., 1995) and which we have used here. Moreover, since these studies appeared, new subdivisions of both the MGB (Winer and Morest, 1983, 1984) and of auditory cortex (Winer, 1992; Winer and Lee, 2007) have been recognized; their impact on understanding the thalamocortical system remains to be determined.
A further issue is whether individual thalamic cells project to more than one cortical region. At first glance, such projections might seem an optimal device for enhancing synchrony between cortical areas and among multiple regions with comparatively few thalamic neurons. Anterograde studies show that the breadth of such projections are unexpectedly extensive, occupying ~200 mm2 of cortex after relatively focal thalamic tracer deposits (de Venecia and McMullen, 1994; Huang and Winer, 2000) and at odds with thalamocortical models of point-to-point connectivity (Brandner and Redies, 1990). Such branching might be expected to be even more common in non-tonotopic regions, prospectively supporting their broader and overlapping responses which blur any map of characteristic frequency (Aitkin and Dunlop, 1968). Thus, a systematic comparison of axonal branching within and across auditory areas must precede principled theories of thalamic information distribution.
These issues of thalamocortical connectivity were addressed with two retrograde tracers injected either within an area or in different areas of cat auditory cortex (Fig 1; Table 1). The ensuing labeling patterns were analyzed with respect to the nuclear origins, topography, and divergence of projections. These experiments formed part of a larger study integrating and comparing convergent inputs from thalamocortical (present results), corticocortical (Lee and Winer, 2008b), commissural (Lee and Winer, 2008a), and convergent (Lee and Winer, 2005) sources.
Fig. 1.
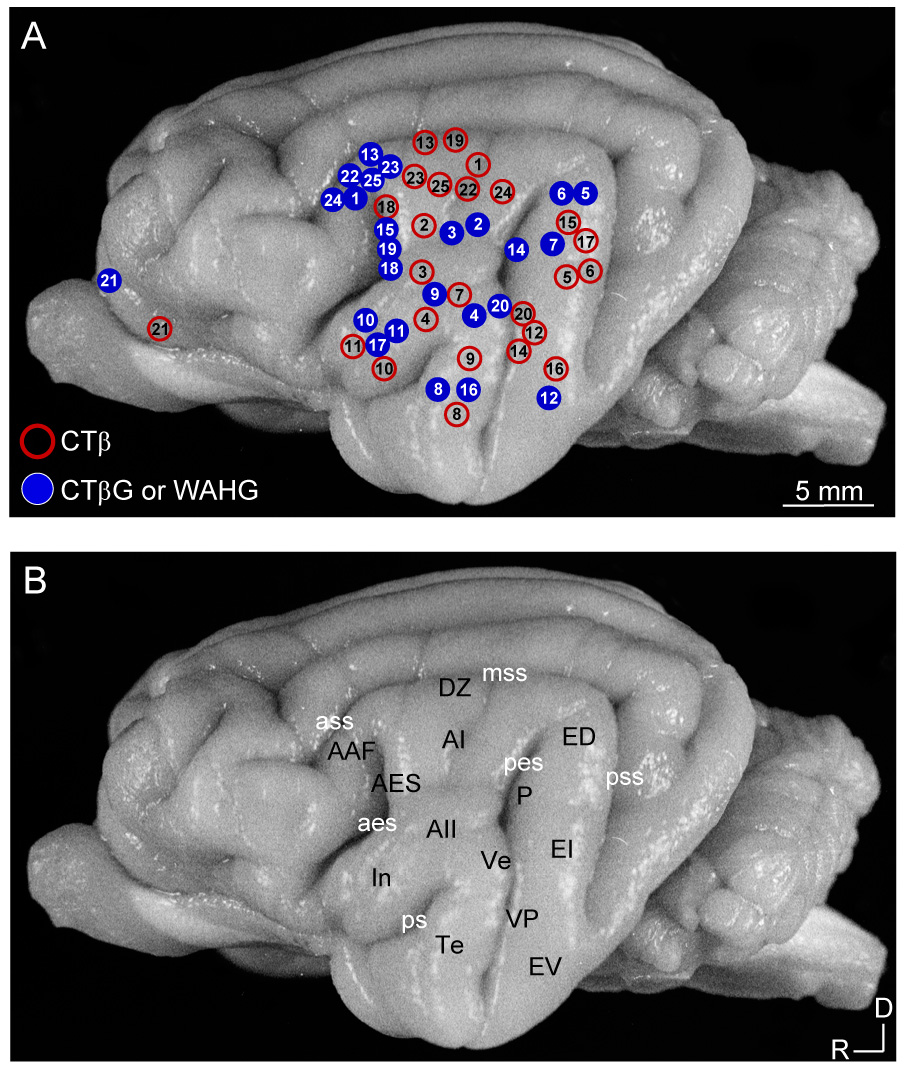
Tracer injection locations and auditory cortical areas. A: Cortical injection sites for twenty-five experiments using CTβ (red) or CTβG or WAHG (blue). Each circle denotes the relative location of injection centers on a standard hemisphere. Numbers in ovals represent the experiments in Table 1. Different retrograde tracers were injected either within an area or in two areas (see Methods). B: Cat auditory cortex areas (black) and principal sulci (white). Borders were determined in Nissl material and SMI-32 immunostained sections (Lee and Winer, 2008a). In four experiments, physiological maps confirmed the borders established with cytoarchitectonic markers (Lee et al., 2004b). For abbreviations, see the list.
TABLE 1.
Summary of Experiments
| Experiment1 | Case | CTβG/WAHG2 | CTβ | Survival (days) | Figure |
|---|---|---|---|---|---|
| 1 | 1436 | AAF2 | AI | 4 | |
| 2 | 1439 | AI2 | AI | 3 | |
| 3 | 1443 | AI2 | AII | 4 | 4 |
| 4 | 1444 | AII2 | AII | 4 | |
| 5 | 1447 | ED2 | EI | 5 | |
| 6 | 1469 | ED | EI | 4 | |
| 7 | 1488 | EI | AII | 3 | |
| 8 | 1499 | Te | Te | 3 | 10 |
| 9 | 1501 | AII | Te | 3 | |
| 10 | 1522 | In | In | 3 | |
| 11 | 1524 | In | In | 4 | |
| 12 | 1527 | EV | VP | 3 | 9 |
| 13 | 1537 | AAF | DZ | 3 | 5 |
| 14 | 1549 | P | VP | 3 | 6 |
| 15 | 1553 | AES | ED | 2 | 7 |
| 16 | 1555 | Te | EV | 3 | |
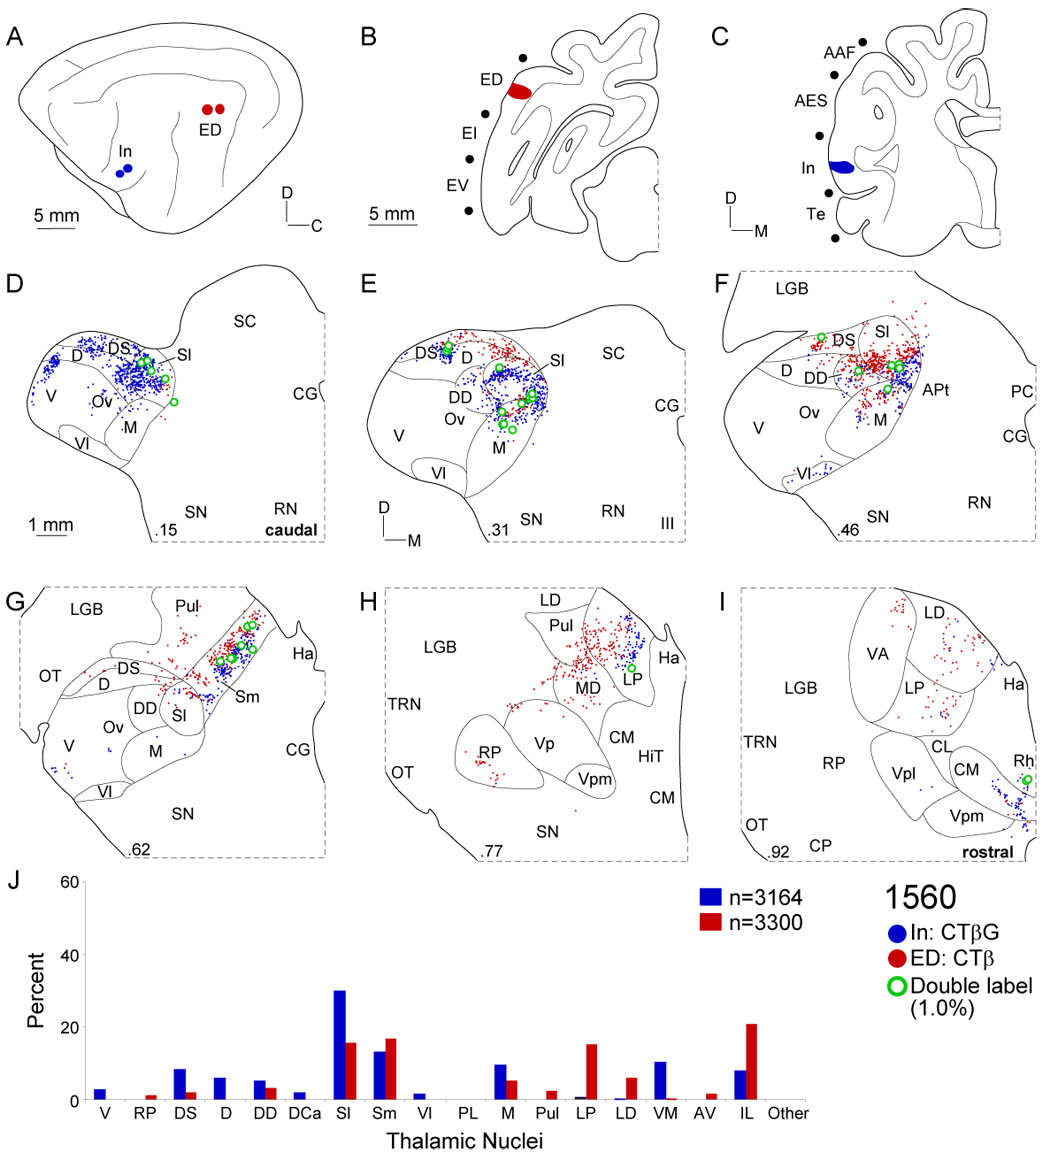
| 17 | 1560 | In | ED | 3 | 8 |
| 18 | 1569 | AES | AES | 3 | |
| 19 | 1579 | AES | DZ | 3 | |
| 20 | 1601 | Ve | VP | 3 | 3 |
| 21 | 1602 | PFC | PFC | 3 | |
| 223 | 1561 | AAF | AI | 3 | |
| 233 | 1568 | AAF | AI | 3 | |
| 243 | 1572 | AAF | AI | 3 | |
| 253 | 1599 | AAF | AI | 3 |
MATERIALS AND METHODS
Surgery
Twenty-five adult, female cats, weighing 2.8–3.5 kg and free of middle ear disease, were used. Surgical procedures were conducted using sterile technique and under veterinary supervision that followed guidelines of the University of California at Berkeley animal care and use committee and regulations of the National Institutes of Health. Four hemispheres were mapped physiologically (Lee et al., 2004a) before tract tracing studies, and twenty-one were studied only anatomically. Animals received acepromazine (0.2 mg/kg) preoperatively, were induced with isoflurane (1–3%; Vetus, Farmers Branch, TX), catheterized, intubated, and maintained at a consistent anesthetic plane. Body temperature was stabilized at 37°C with a heating pad, and hydration was provided with lactated Ringer’s solution (0.5–1.0 ml/min, i.v.). Physiological monitoring of the electrocardiogram, heart rate, blood pressure, and temperature was conducted continuously.
The head was supported in a custom device that allowed access to the entire temporal convexity. A midline scalp incision preceded blunt dissection of the temporalis muscle and removal of the overlying skull and dura. Sulcal fields (DZ, AES, P, VP, Ve) were exposed with expandable surgical spears (Merocel Corporation, Mystic, CT) to gently deflect the banks to allow an orthogonal approach for tracer injections (Fig. 2C,F,I). In experiments using unmapped animals, sulcal and vascular landmarks guided the injection of two retrograde tracers, cholera toxin beta subunit (CTβ) (Luppi et al., 1990) or cholera toxin beta subunit conjugated with gold (CTβG) (Llewellyn-Smith et al., 1990) (List Biological Laboratories, Campbell, CA), into different sites, either within the same area (9 cases) or in two different areas (16 cases) (Fig. 1; Table 1). In five cases, wheat-germ apo-horseradish peroxidase gold-conjugate (WAHG) (Basbaum and Menetrey, 1987) was used rather than CTβG; the results obtained with the different tracers were indistinguishable.
Fig. 2.

Representative cholera toxin beta fragment (CTβ) and gold conjugated cholera toxin beta fragment (CTβG) injection sites. Areal borders were determined from adjacent Nissl and SMI-32 antibody-stained sections (Lee and Winer, 2008a). A–C: CTβ injections spread 500–1000 µm. Two injections were usually made to ensure adequate coverage in each area. Representative AI (A), AII (B), and DZ (C) deposits. D–F: CTβG deposits likewise were focal, and spread less than CTβ injections. To equalize coverage, an additional CTβG injection was made. Experiments with WAHG produced similar results. Deposits shown are in areas ED (D), EV (E), and AES (F). G–I: Both tracers were visualized in each section, as shown in areas Te (G), In (H), and P/VP (I). For orthogonal penetrations in areas DZ (C), AES (F), and P/VP (I), the sulcal banks were retracted.
Tracers were pressure-injected with a nanoliter pump (World Precision Instruments, Sarasota, FL) through a glass pipette with a 20–30 µm tip diameter and containing mineral oil. For each penetration, a total of 55.2 nl tracer volume was deposited (4.6 nl/15 sec) at 500, 1000, and 1500 µm beneath the pia to saturate all layers. A 2 min interval allowed for tracer equilibration before removing the pipette. The exposure was closed with interrupted sutures and the animal recovered. During the 3–5 day post-operative survival (median: 3 days) buprenorphine (0.00875 mg/kg; s.c.) was given every 12 hours. The experiments are summarized in Table 1.
Perfusion and histology
Sodium pentobarbital (26 mg/kg, i.v., Abbott, Chicago, IL) was administered before transcardial perfusion with 0.1 M phosphate buffered saline (PBS; pH 7.4) for 2 min followed by 4% paraformaldehyde/0.1 M PBS for 20 min (wash volume: 200 ml; fixative volume: 2 l). After 1 h, 10% sucrose/4% paraformaldehyde/0.1 M PBS solution was perfused for cryoprotection (volume: 200 ml). The brain was blocked stereotaxically, dissected, photographed, and cryoprotected for 3 days in 30% sucrose/4% paraformaldehyde/0.1 M PBS.
Transverse sections were cut on a freezing microtome at 60 µm, and adjacent 1:6 series were processed, respectively, for each tracer, Nissl preparation, SMI-32 immunostaining, for retrograde labeling analysis, and for determining areal and nuclear boundaries. To visualize the tracers, the sections were processed for the gold-conjugated tracer (CTβG or WAHG) using silver-intensification, then rinsed in 50% EtOH, washed in double distilled H2O, silver intensified (Kierkegaard and Perry Laboratories, Gaithersburg, MD), washed in 1% sodium thiosulfate to reduce background, then rinsed in 0.1 M PBS. The CTβ labeled neurons were then revealed immunohistochemically. Tissue was blocked for 1 h in 5% normal rabbit serum/0.3% Triton X-100, incubated overnight in a 1:7500 solution of anti-CTβ goat primary antibody (List Biological Laboratories, Campbell, CA) in 0.1 M PBS, then processed with a goat Vectastain avidin-biotin-peroxidase kit (Vector Laboratories, Burlingame, CA) with diaminobenzidine as the chromogen. Sections were mounted on gelatin-coated slides, cleared, and coverslipped.
To define thalamic nuclear borders and cortical areas, adjacent series of sections were processed with either the Nissl stain or the SMI-32 antibody (Sternberger Monoclonal Inc., Baltimore, MD). The SMI-32 antibody was raised against the non-phosphorylated 200kD heavy neurofilament, which immunostains pyramidal neuron neurofilaments (Sternberger and Sternberger, 1983), and differentially immunostains cat auditory cortical areas (Van der Gucht et al., 2001; Mellott et al., 2005; Lee and Winer, 2008a).
Data analysis
Thalamic boundaries were drawn without knowledge of the labeling. Cytoarchitectonic boundaries were determined with reference to prior work (Winer, 1984b, 1985a). For cortical areas, the SMI-32 immunostaining (Mellott et al., 2005) and the present results were compared with the areas defined in prior architectonic studies (Rose, 1949; Winer, 1984a, 1984c, 1984d, 1985b; Winer and Prieto, 2001). Standard atlases were consulted as necessary (Snider and Niemer, 1961; Berman and Jones, 1982). The injection sites were reconstructed from adjacent sections. Photomicrographs were taken with a Nikon digital camera (Nikon, Melville, NY) using the appropriate software (ACT-1). Brightness and contrast adjustments were performed digitally using Canvas (Deneba Software Inc., Miami, FL). The data were conserved during all digital manipulations and the concordance between the plotted material and photomicrographs was high.
Retrogradely labeled thalamic neurons were charted using 10–25× objectives on a microscope equipped with the computerized Neurolucida image-analysis system (MicroBrightField, Colchester, VT). Neurons were counted only if somatic neural profiles contained a nucleus, and double labeling required both tracers to be coincident in the cell body at the same focal depth (Fig. 3F). This plot file was imported to Canvas (Deneba Software Inc., Miami, FL) and aligned with surface and vascular landmarks from adjacent Nissl-stained sections to superimpose thalamic boundaries. Quantitative analysis of neuronal distributions within nuclei was then conducted using the Neuroexplorer analysis software (MicroBrightField). Histograms of distributions were produced with Excel (Microsoft Corp., Redmond, WA), and statistical comparisons were made with Prism (GraphPad Software, San Diego, CA).
Fig. 3.
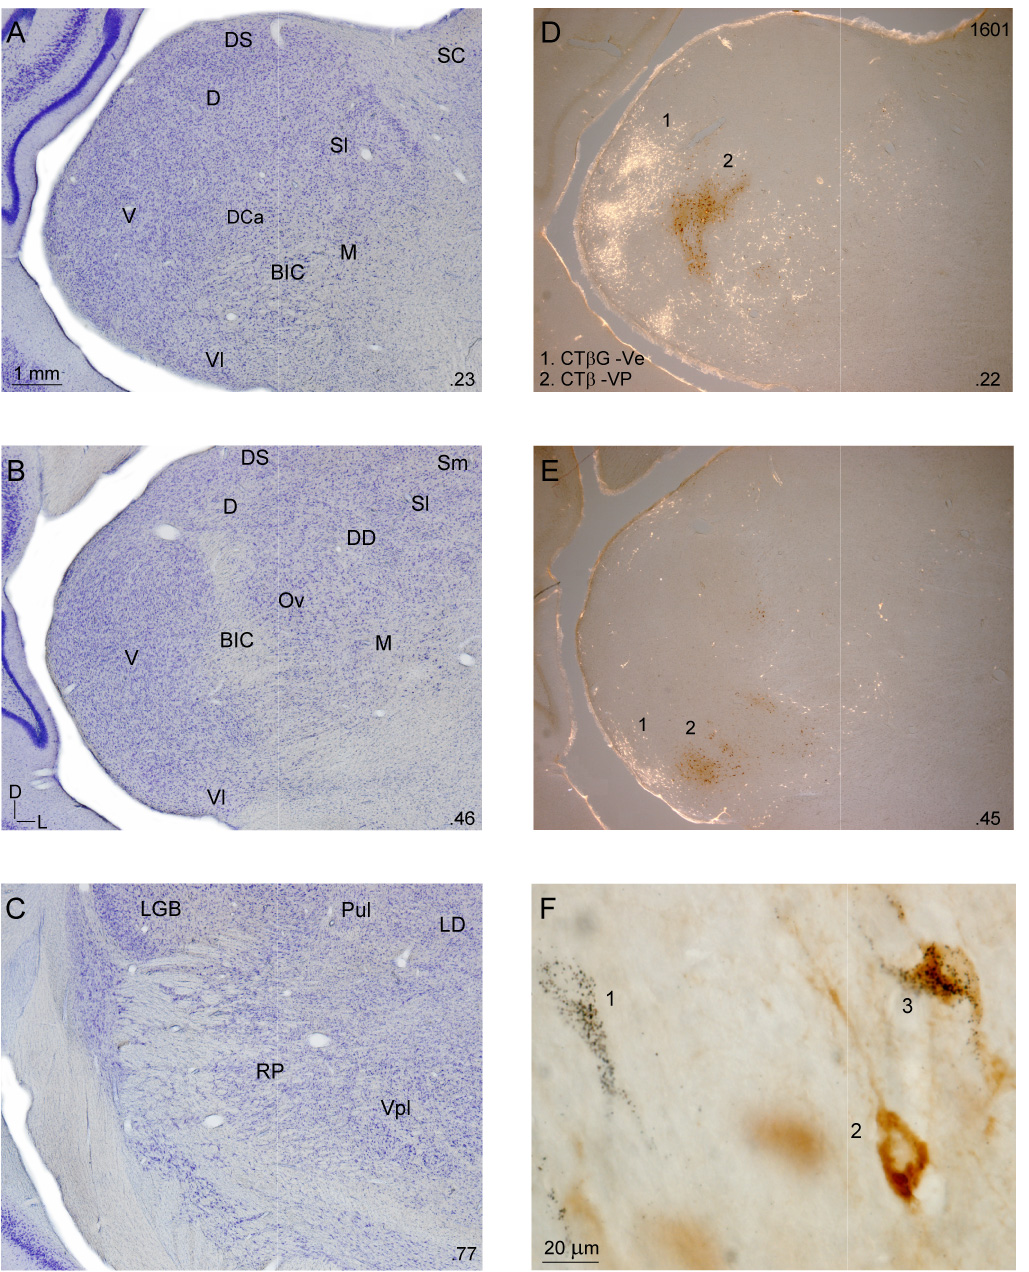
Thalamic cytoarchitecture and representative retrograde thalamic labeling. A–C: Nissl preparations at three caudorostral levels. Decimals (lower right), percent distance from the caudal tip of the MGB. A: Major divisions were present at 23% from the caudal tip. The pars lateralis of the ventral division (V) was conspicuous, with a characteristic laminar organization of dorsoventrally oriented neurons. The dorsal nucleus (D) had a lateral-to-medial arrangement and more densely packed neurons than the other dorsal division nuclei (the dorsocaudal (DCa), dorsal superficial (DS), ventrolateral (Vl), and lateral suprageniculate (Sl) nuclei). The dorsocaudal nucleus was receding by this level, while the dorsal superficial and ventrolateral nuclei had more dispersed cells and extended rostrally to ~70%. The lateral suprageniculate (Sl) had much larger neurons than other dorsal division nuclei and these are second in size to medial division (M) cells, which are sparser and form much of the MGB medial wall. B: Midway through the MGB, the brachium of the inferior colliculus (BIC) often divides the ventral division, with the pars ovoidea (Ov) medial to the brachium, and its laminar arrangement disrupted by it. The medial suprageniculate nucleus (Sm) extends from Sl to the dorsomedial thalamic border. C: At 77% from the caudal tip, the visual (LGN, Pul) and somatosensory (Vpl) thalamic nuclei border the MGB rostral pole. D–E: Representative retrograde labeling in bright-and darkfield illumination after injections in (1) ventral (Ve; CTβG) and (2) ventroposterior (VP; CTβ) areas. CTβG labeling (1: white cells). CTβ labeling (2: red-brown). Injections in VP and Ve labeled topographically segregated clusters in the ventral division (V), with lesser labeling in the dorsal nuclei and the medial division. F: CTβG (1), CTβ (2), and double-labeled (3) cells were readily distinguished.
RESULTS
To confirm the areal location of the deposits, injection sites were compared with cytoarchitectonic sections stained with Nissl (Rose, 1949; Winer, 1984a, 1984c, 1984d, 1985b; Winer and Prieto, 2001) or the SMI-32 antibody (Lee and Winer, 2008a). Nineteen deposits were in tonotopic regions (AI, AAF, P, VP, Ve) (Reale and Imig, 1980), eleven were in non-tonotopic regions (AII, DZ, AES) (Schreiner and Cynader, 1984; Clarey and Irvine, 1990; He et al., 1997), and twenty were in multisensory (ED, EI, EV) or limbic areas (Te, In) (Cavada and Reinoso-Suarez, 1985; Bowman and Olson, 1988; Shinonaga et al., 1994) (Table 1). Cases were included only if the injections were confined to an area and did not enter the white matter (Fig. 2). Multiple injections of each tracer were required because of limited tracer diffusion (~500–1000 µm), and to examine projection topography along an axis (Lee and Winer, 2005) (Fig. 2). Neurons labeled by each tracer were distinguished readily from one another (Fig. 3F).
Organization of the thalamocortical projections
Injections consistently produced retrograde labeling in several thalamic nuclei; the distribution of such cells was always topographic (Lee and Winer, 2005). Thalamic projections were ordered topographically in the anteroposterior dimension. Injections in more ventral cortical areas (e.g. Te, EV, VP) labeled cells in more caudal parts of the MGB, while those in more dorsal areas (e.g. AAF, DZ, ED) had MGB labeling clustered more rostrally. Each MGB division projected to more than one area and the medial division projected to all auditory areas (Fig. 11A) and likely beyond (Jones and Burton, 1974). Each area received a unique pattern of convergent input (Fig. 3–Fig. 11). Though single nuclei often projected to several areas, branched projections from single neurons were less than 2% of the total of labeled cells, with the largest values ensuing from injections separated by a few millimeters within the same field (maximum 6%) (Fig. 11B). Thus, multiple segregated thalamic pathways ascend to the different cortical regions.
Fig. 11.
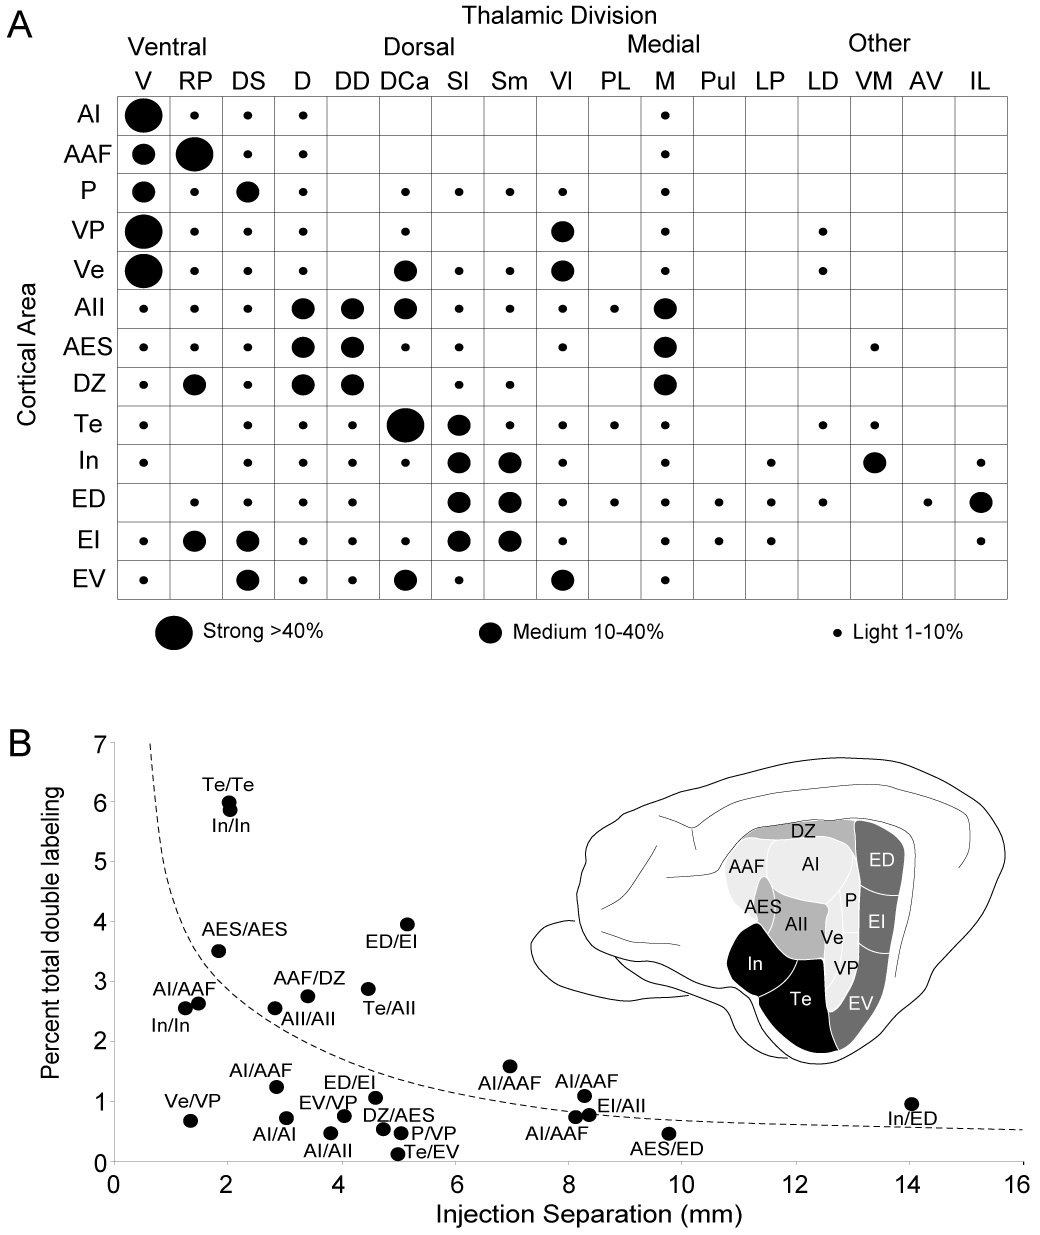
Summary of auditory thalamocortical projection patterns and proportion of branched projections. A: Relative strength of input to the thirteen auditory areas in the cat. Dot sizes, the percentage of the thalamic projection and the average percentage in all injections/area. Each region has a unique pattern of convergent thalamic input. Tonotopic areas (AI, AAF, P, VP, Ve) received strong projections mainly from the ventral division. Non-tonotopic areas (AII, AES, DZ) have primary input from the dorsal and deep dorsal nuclei. Limbic (In, Te) and multisensory areas (ED, EI, EV) are targets of the dorsal superficial, dorsocaudal, ventrolateral, suprageniculate, and extrageniculate and intralaminar input. B: Double-labeled cells in each experiment as a function of deposit separations. Double labeling was maximal (<6%) with injections in an area. Intraareal branching was strongest in limbic areas (~6%) and weakest in tonotopic regions (<0.5%). Interareal divergence averaged ~1% in all areas, even at 10–14 mm separations.
Tonotopic areas
The tonotopic areas, AI, AAF, P, VP, and Ve (Reale and Imig, 1980), each received substantial projections from the tonotopic MGB ventral division (V) (Imig and Morel, 1985); all but AI were lesser targets of the adjoining dorsal division nuclei. Each field also received input from the tonotopic rostral pole (RP) (Imig and Morel, 1985), a projection which was maximal for AAF. The MGB projections to tonotopic regions had broadly different origins than those to non-tonotopic areas (Fig. 4, Fig. 6, Fig. 9).
Fig. 4.
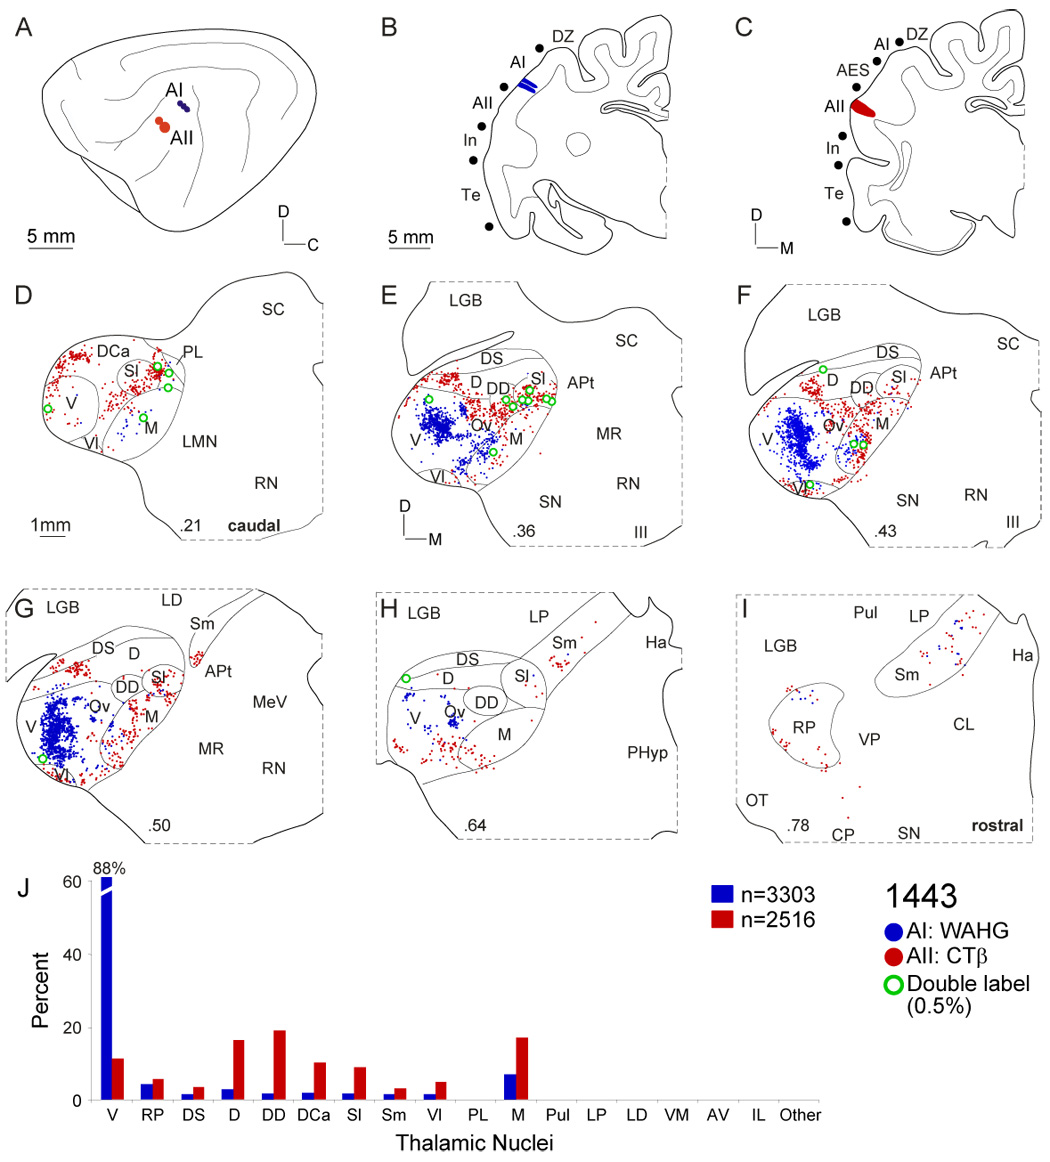
Thalamic projections to areas AI and AII. A: Lateral view of left hemisphere with three WAHG injections in AI (blue circles) and two CTβ deposits in AII (red circles). B: Coronal section through the center of injections near the ventral AI border. Deposits were <1 mm diameter. C: AII injections at the rostral border near AES. D: Thalamic input to AII (red dots) arose in more caudal regions than that to AI (blue dots). E: Both projection sets were topographically segregated. Input to AI came principally from the ventral division, and that to AII arose in various dorsal division nuclei (dorsal (D), dorsal superficial (DS) and lateral suprageniculate (Sl)). F: Thalamocortical foci of labeling to AI and AII were segregated. Medial division input was robust from the AII injection. G: The ventral division projection to AI was clustered along the dorsoventral axis. Double-labeled cells (green dots) were sparse and concentrated at the interface of the labeling. H: Beyond the MGB midpoint, only scattered labeling was present. I: Few rostral pole cells project to AI or AII. J: Contributions from each nucleus shows different AI and AII projection profiles. Most AI thalamic input arose from V, while AII received many dorsal and medial division projections.
Fig. 6.
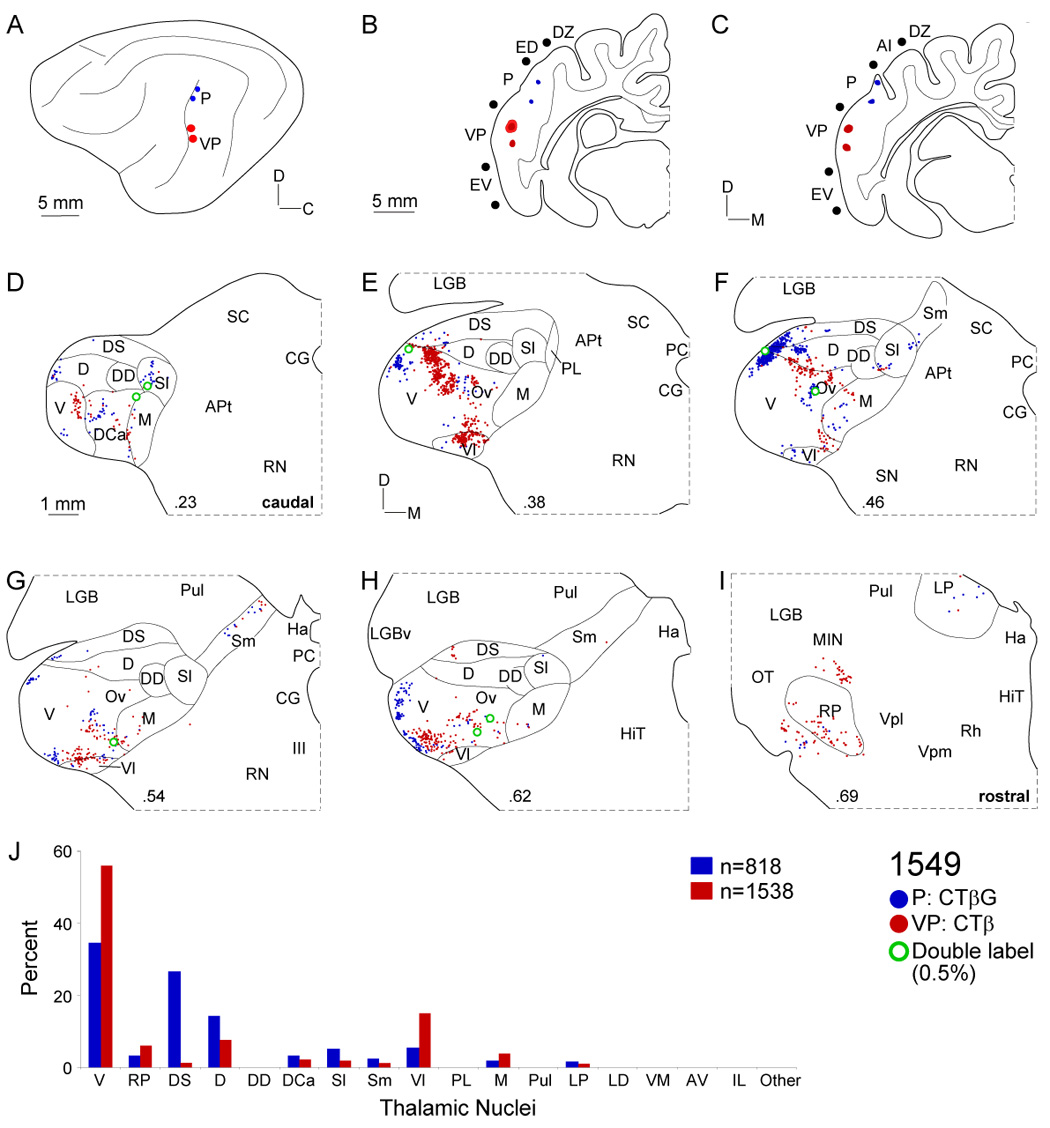
Thalamic input to areas P and VP. A: Deposits in areas P (blue circles) and VP (red circles) in the caudal posterior ectosylvian sulcus were ~5 mm apart. B: For injections along the caudal bank, the sulci were retracted. The largest VP injection (red ovals) spread <1 mm and both injections spanned the upper half of the area. C: The two area P deposits (blue ovals) were also in the upper half and each was <250 µm wide. D: Both fields had weak input from nuclei in the caudal quarter of the MGB. E: Most input to area VP (red dots) arose in the caudal ventral division as a cluster elongated dorsoventrally. F: Projections to area P (blue dots) skirted the MGB perimeter, involving ventral (V), dorsal (D), and dorsal superficial (DS) nuclei. Input to VP formed small clusters in the pars ovoidea (Ov). G: Each group of labeling was topographically segregated, despite similar origins. H: Input from the lateral edge of the MGB was also topographic, with scattered double-labeling (~0.5%). I: Small clusters of rostral pole cells project to P and VP. J: Input to P and VP had different origins in the dorsal superficial and ventral division, respectively.
Fig. 9.

Contrasting EV and VP projections. A: Deposits ~4 mm apart in the ventral posterior ectosylvian gyrus (blue circles) and the ventroposterior area (red circles). B: Discrete EV injections spread <1 mm. C: VP injections in the posterior ectosylvian sulcus were <1 mm wide. D: Area EV projections were segregated topographically from VP input, arising more caudally in the MGB dorsocaudal (DCa) and dorsal superficial (DS) nuclei, with clusters extending past the MGB midpoint. E: VP projections concentrated in the ventral division as a focal dorsoventral strip, which encroached upon the dorsal division (D). F: Clustered input from DS (at 34%) resembled that to areas In, Te, and ED. Further labeling extended from the ventrolateral nucleus into the medial division. G: At the MGB midpoint, ventrolateral nucleus labeling was prominent, with nearby, topographic projections to VP. H–I: The clustered ventrolateral nucleus labeling continued rostrally, with sparse ventral division input to VP. J: Areas EV and VP had different MGB input patterns, with VP receiving strong projections (~60%) from V, and EV dominated by DS, Vl, and DCa projections (~65% combined). Double labeling was sparse (<1%).
The primary auditory cortex (AI) was unique among the tonotopic areas, with >85% of its input originating in the ventral division (Fig. 4J: blue). Eight sets of injections were available for AI, four of which were physiologically targeted to specific characteristic frequency (CF) loci (Table 1) (Lee et al., 2004a). There was a systematic relationship between the anteroposterior location of the injections in AI and the lateromedial origin of the labeling, consistent with the CF organization (Merzenich et al., 1973; Reale and Imig, 1980; Imig and Morel, 1984). Injections in central AI (Fig. 4B) produced dorsoventrally elongated projections from ventral division cells extending from the caudal third to the rostral pole (Fig. 4E–G: blue dots). The banded labeling was clustered, confirming previous findings of multiple subdomains along an isofrequency contour (Middlebrooks and Zook, 1983; Velenovsky et al., 2003) (Fig. 4F,G: blue dots), and any finer clustering was likely obscured since injections may have spanned many auditory cortex (AC) subdomains. Lesser projections (<5%) arose from smaller clusters of cells labeled in the rostral pole, medial division, and dorsal division nuclei (Fig. 4E, F, I: blue dots).
In contrast, projections to the adjacent, non-tonotopic AII were topographically segregated from those to AI throughout the MGB (see below), forming clusters in areas that ringed the AI projection (Fig. 4D–H: red dots). This topographic segregation was supported by the very few divergent neurons connecting both fields (~0.3%) (Fig. 4D–I: green dots). Such interareal divergence is <2% even when it was presumably maximized, as in the frequency-matched injections in AI and AAF (Lee et al., 2004a).
The anterior auditory field (AAF) differs both physiologically and connectionally from AI (Lee et al., 2004a). Four of the six AAF deposits were physiologically characterized by CF (Table 1). An injection along the crest of the anterior suprasylvian sulcus did not reach the base of layer VI (Fig. 5C: blue). The thalamic labeling was concentrated in the MGB rostral pole (Fig. 5H: RP, blue dots, ~40% of the total projection), where it formed clusters and bands that extended to the most anterior quarter. An unexpectedly large dorsal division projection (Fig. 5E–G: D, blue dots, ~30%) was as focal and clustered as that from the RP. Smaller projections were scattered widely in the ventral and medial divisions (Fig. 5D–G: blue dots, <20% each). At the caudal MGB, ventral division labeling clustered dorsally and ventrally, while the pars ovoidea labeling was sometimes continuous with rostral pole projection (Fig. 5E–I: blue dots). This labeling pattern resembled that for area DZ, which also had large involvement of the dorsal and rostral pole nuclei (Fig. 5 D–I: red dots). In V and RP, the labeling varied systematically and topographically with injected CF; injections at lower frequency produced clustered ventrorostral labeling, and higher frequency deposits, more dorsocaudal projections. When similar frequency loci were injected in both AI and AAF, the labeling was segregated globally: AI received stronger projections from V (>85%), while AAF received moderate V (~30%) and RP (~40%) input. Even when labeling arose in the same nucleus, segregated clusters were still present. Coupled with the sparse double labeling (<2%), this suggests segregated processing streams to physiologically matched regions (Lee et al., 2004a).
Fig. 5.
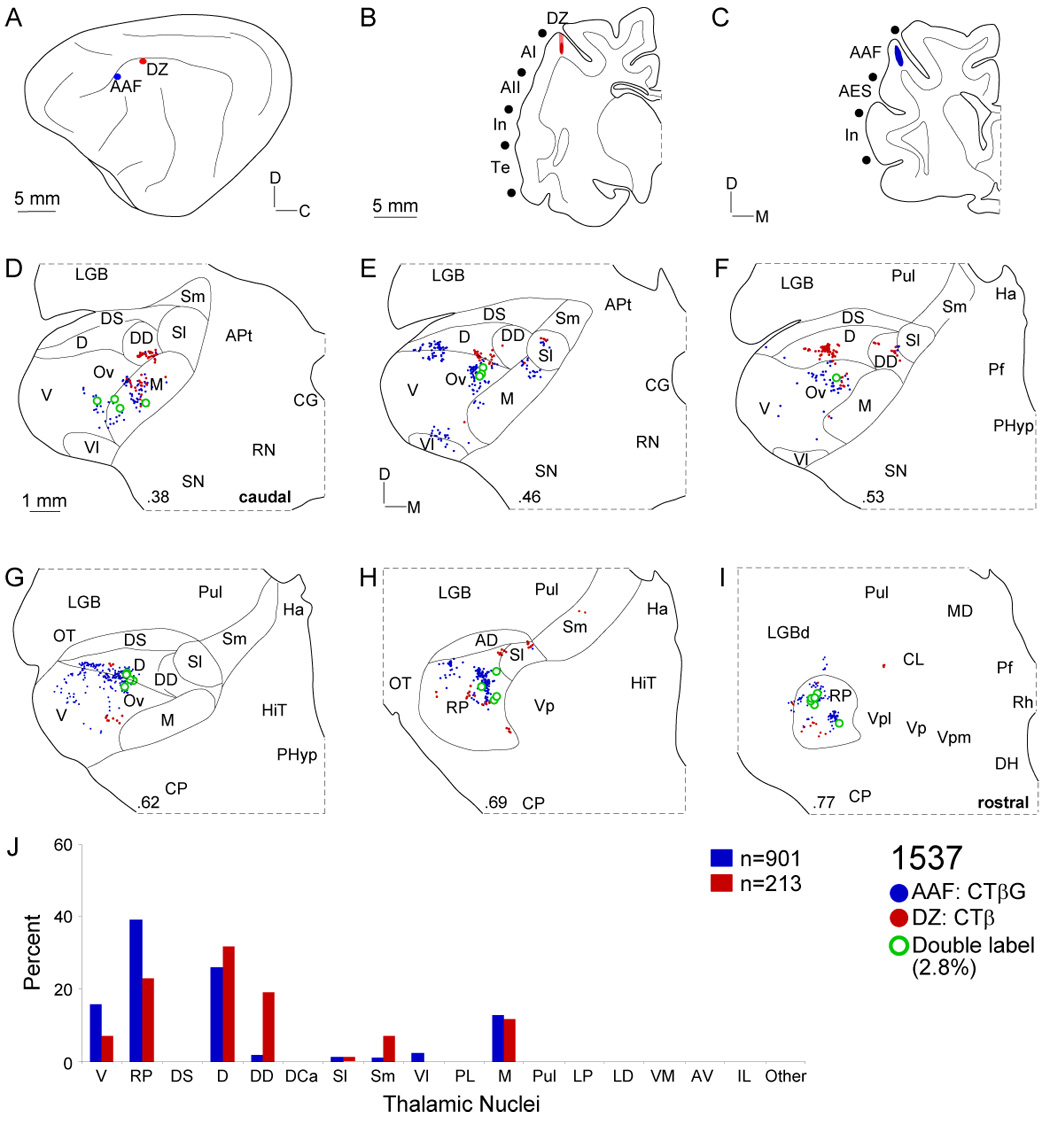
Thalamic input to AAF and DZ. A: AAF (blue circles) and DZ injections (red circle) were ~3 mm apart. B: The DZ deposit spread less than 250 µm in the ventral bank of the suprasylvian sulcus, beyond the gyral crest. C: The AAF injection was ~500 µm in diameter and at the crest of the anterior suprasylvian gyrus. D: Areas AAF (red dots) and DZ (blue dots) both received ~10% of input from the medial division, whose origins were overlapping and focal. E: AAF projections involved ventral division (V), chiefly the dorsal and ventral poles, and were segregated from dorsal division input to DZ. F: DZ had large dorsal (D) and deep dorsal (DD) inputs that were focal, discontinuous, and segregated from those in the pars ovoidea (Ov) to AAF. G: AAF projections at the dorsal division (D) border were continuous lateromedially. H–I: Both injections labeled rostral pole neurons, where most (~3%) of the double-labeled cells were found. J: Each area had substantial dorsal, rostral pole, and medial division projections, and differential ventral and deep dorsal nuclei input.
The posterior auditory field (P) lies along the dorsocaudal bank of the posterior ectosylvian sulcus, whose banks were retracted to allow an orthogonal approach (Fig. 6B–C). Thalamic projections to area P differed from those to AI and AAF, with larger input from dorsal superficial (DS) and ventrolateral (Vl) nuclei (Fig. 6: blue dots), which also projected substantially to limbic-related (Te, In) and non-primary (ED, EI, EV) areas (Fig. 7– Fig. 11). An injection in the dorsocaudal bank of the posterior ectosylvian sulcus (Fig. 6B–C: blue dots) labeled focal, dense, and clustered groups of cells in the ventral (V), dorsal (D), and dorsal superficial (DS) nuclei (Fig. 6D–I: blue dots). Lesser, scattered labeling was found in the caudal half of the MGB, in the dorsocaudal (DCa) and lateral suprageniculate (Sl) nuclei (Fig. 6D: blue dots). A large cluster of labeled cells at the ventral and dorsal division border (Fig. 6E–G: blue dots) recalled projections to multisensory (Fig. 9: EV) and limbic-affiliated (Fig. 8, Fig. 10: In, Te) areas. Rostrally (Fig. 6H), focal cell clusters lay in the lateral portion of the ventral division, suggesting a low-frequency deposit locus (Fig. 6H) (Morel and Imig, 1987). Sparse labeling was found at the rostral pole (Fig. 6I), which was labeled more prominently in a related study (Winer et al., 2001). Lesser (<5%) and more diffuse projections arose in the ventrolateral and the lateral posterior nuclei (Fig. 6H–I).
Fig. 7.
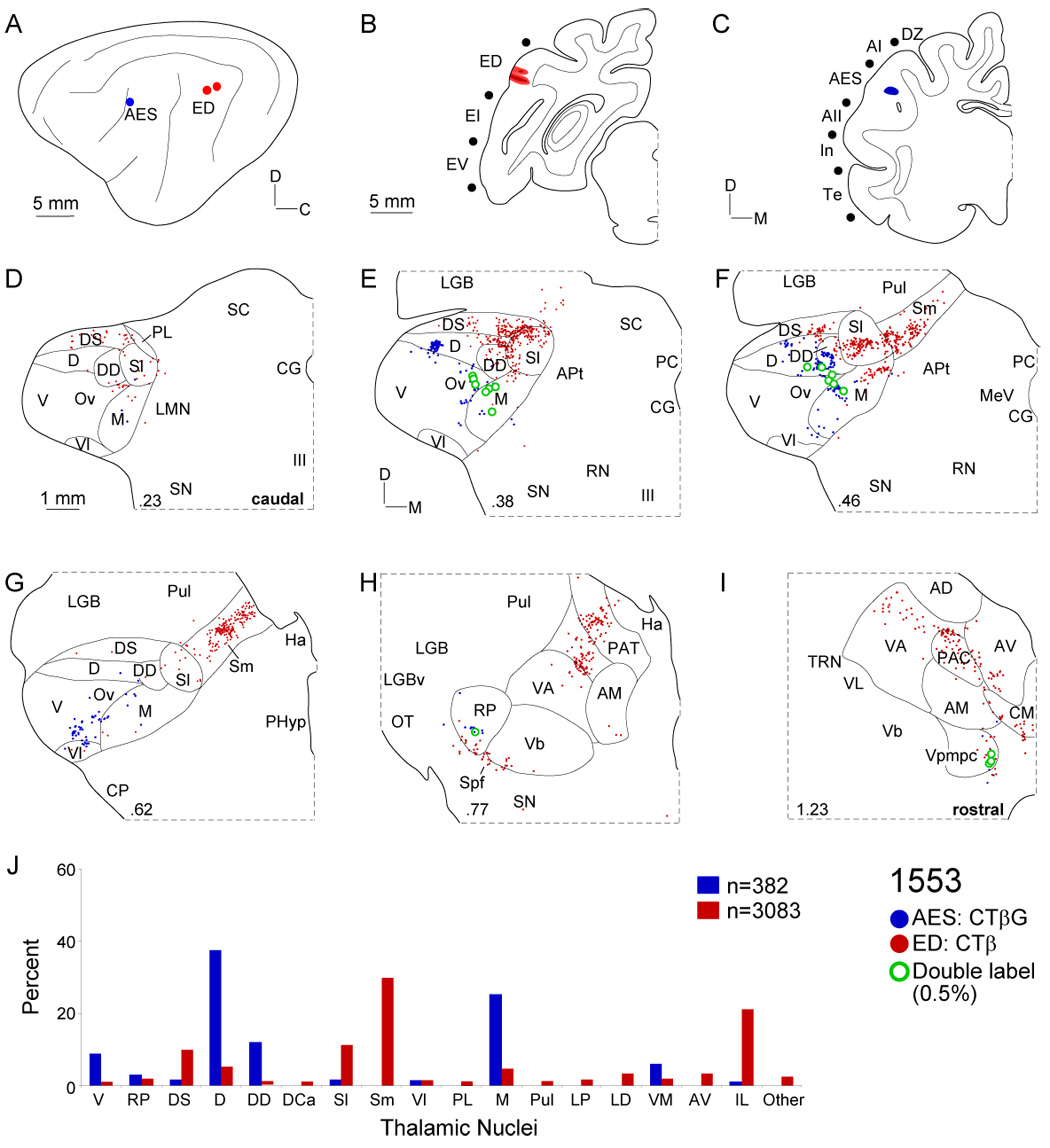
Thalamic projections to areas AES and ED. A: Deposits were ~10 mm apart in the caudal bank of the anterior ectosylvian sulcus (blue circle) and the dorsal posterior ectosylvian gyrus (red circles), respectively. B: Two ED injections each spread <1 mm. C: The AES injection were <1 mm in diameter and in the caudal bank. D: Afferents to ED arose more caudally than those to AES, and concentrated in dorsal superficial (DS) and lateral suprageniculate shell nuclei. E: AES input was topographically separate from that to ED, arising in the dorsal (D) and deep dorsal (DD) nuclei, and the medial (M) division. F: Lateral and medial suprageniculate labeling was clustered as was the main ED input (~50%). AES afferents concentrated in the deep dorsal nucleus and medial division. G: Rostrally, Sm input to ED arose as a strip extending toward the medial thalamic border, while AES projections were scattered in M and Vl, resembling AII input (Fig. 4G). H: Lesser input to both areas arose in the rostral pole (<3%) and extrageniculate sources including the ventroanterior (VA), parataenial (PAT), and ventrobasal (Vb) nuclei. I: Area ED received strong intralaminar projections (~20%) from the centromedial (CMN) and paracentral (PAC) nuclei. J: Inputs to area AES resembled those in other non-tonotopic regions (DZ, AII), arising in the dorsal and deep dorsal nuclei and the medial division, while ED received topographically segregated dorsal superficial, suprageniculate, and intralaminar nuclear afferents. Few MGB cells (<0.5%) projected to both.
Fig. 8.
Comparison of projections to areas In and ED. A: Two insular cortex deposits (blue circles) ~14 mm from two ED injections in the dorsal part of the posterior ectosylvian gyrus (red dots). B: ED injections spread <1 mm. C: The In deposits were <1 mm in diameter in the anterior sylvian gyrus near AII. D: Projections to both areas arose in many of the same nuclei, though those to In from the dorsal superficial (DS) and lateral suprageniculate (Sl) nuclei were more caudal, resembling limbic (Te) and association (EV) areas. E: At ~30%, ED clusters were separated from the In projections in DS and Sl nuclei and the medial (M) division. F: Both areas had substantial suprageniculate input, with few (~1%) double-labeled neurons at their interface. G: The suprageniculate nucleus was filled with strips of cells of origin clustered in the medial suprageniculate (Sm). H: The labeling involved the pulvinar (Pul), lateral posterior (LP), and mediodorsal (MD) thalamic nuclei. I: Both areas received intralaminar nuclear input from the centromedial (CMN) nucleus. J: Differential extrageniculate contributions distinguish otherwise similar In and ED input patterns.
Fig. 10.
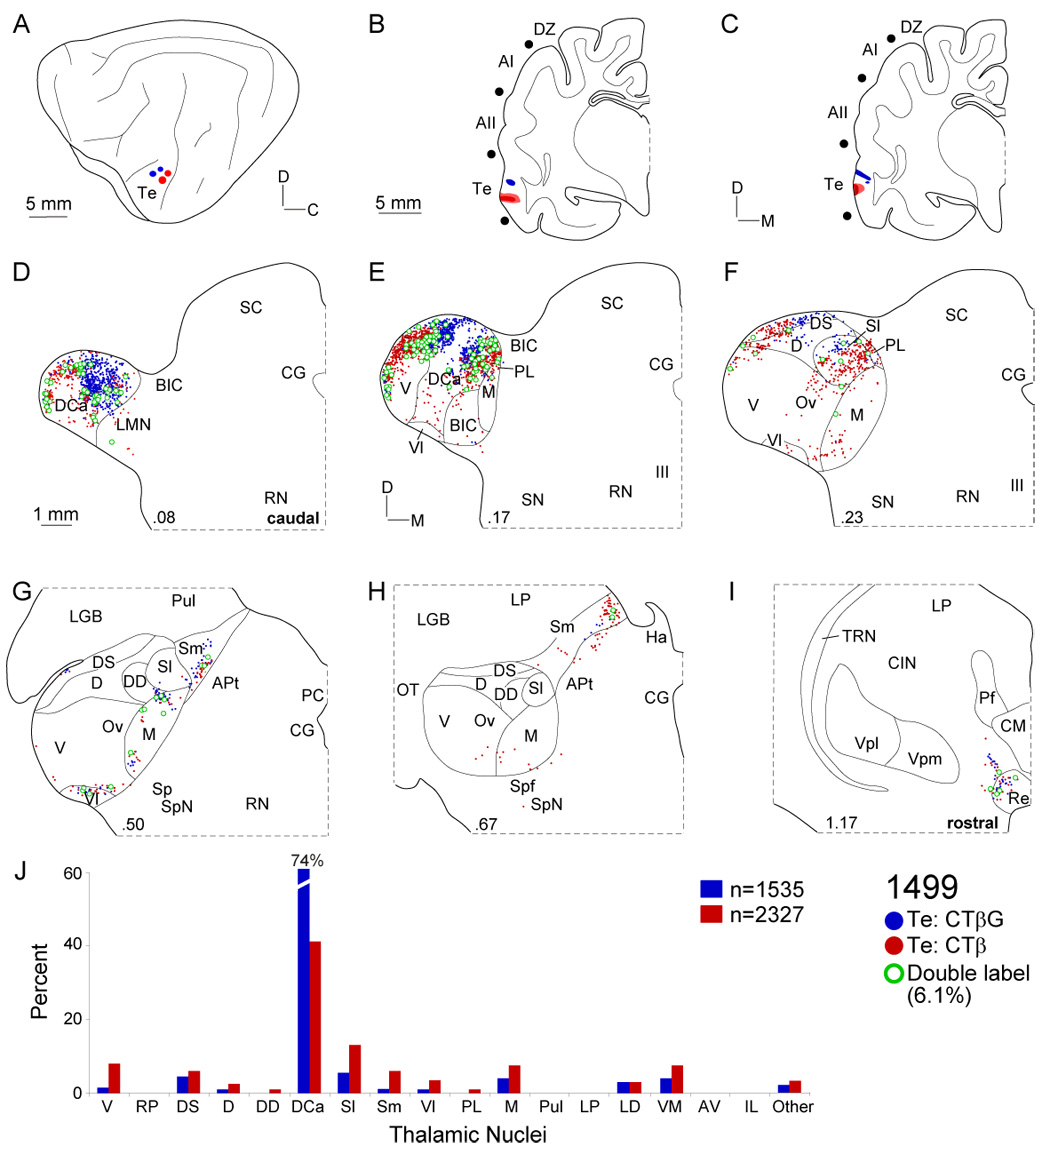
Thalamocortical projections to area Te. A: CTβG (blue circles) and CTβ (red circles) were injected ~2 mm apart. B: Two CTβ injections near the posterior ectosylvian sulcus. C: The CTβG injections were nearer the pseudosylvian sulcus. D: Te input arose from the most caudal MGB, contrasting with all other auditory cortex deposits. Labeled cells clustered in the dorsocaudal (DCa), dorsal superficial (DS), and lateral suprageniculate (Sl) nuclei, respectively. E: Inputs to the Te loci were focal. Double labeling was highest in this experiment (~6%). F: The concentrated caudal labeling declined rostrally, with small clusters in DS and Sl. G–H: Small clusters (<5%) were found rostrally, in the medial suprageniculate (Sm), ventrolateral (Vl) and medial (M) division nuclei. I: Extrathalamic input to area Te came from the reuniens (Re) nucleus. J: Te labeling was highly concentrated, with strong (>60%) dorsocaudal nucleus input, a projection second in size only to that of the ventral division input to AI.
The ventroposterior field (VP) is inferior to area P, abutting the posterior ectosylvian sulcus. Three injection sites were in the dorsal parts of VP, two in the caudal sulcal bank (Fig. 3, Fig. 6B–C), and one was at the sulcal crest (Fig. 9C). Deposits in dorsal VP in three cases produced highly similar thalamic labeling patterns (Fig. 3, Fig. 6, Fig. 9: red dots), suggesting modest interanimal thalamocortical variability. In contrast to other tonotopic regions, VP injections labeled more caudal parts of the MGB (Fig. 3D, Fig. 6E, Fig. 9E: red dots), forming clusters in the caudal ventral division (~60%). The dorsocaudal (DCa) nucleus (Fig. 3D, Fig. 6E, Fig. 9E: red dots) was sometimes involved, as it was after ventral area (Ve) injections (Fig. 3E). Input to VP formed small clusters elongated dorsoventrally, indicating a local suborganization and resembling other ventral division projection patterns. A smaller (~10%) focal and lateromedially elongated input was found often in the ventrolateral (Vl) nucleus, midway through the MGB (Fig. 3E, Fig. 6G, Fig. 9G: red dots). Tiny clusters of rostral pole labeling contributed <5% of total input. Scattered minor projections came from the medial division and the laterodorsal (LD) nucleus (Fig. 11A). Dual injections allowed direct comparison of input to two tonotopic (P: Fig. 6; Ve: Fig. 3) and multisensory (EV: Fig. 9) fields. The topographic pattern and nuclear origins of VP inputs resembled those to P (Fig. 6: blue dots) and Ve (Fig. 3: CTβG), and contrasted with those to area EV, which arose from distinct nuclei and topographic locations (Fig. 9: blue dots). Double labeling of ~0.5% was similar in each experiment (Fig. 11B).
The ventral area (Ve) along the rostral bank of the posterior ectosylvian sulcus abuts tonotopic (AI, P, VP), non-tonotopic (AII), and limbic (Te) fields. Projections to area Ve resembled those to VP (Fig. 3, Fig. 11), and are summarized briefly. Deposits in the rostral bank of the posterior ectosylvian sulcus resulted in ~60% of labeling in the ventral division, especially its caudal part. These labeled cells formed multiple dorsoventral clusters, reflecting a possible suborganization (Fig. 3D: CTβG). Smaller projections in the dorsocaudal (DCa), ventrolateral (Vl), medial (M), and lateral posterior (LP) nuclei were distributed more diffusely. A cardinal feature of Ve input was the dorsocaudal MGB labeling, which occupied a broader territory than that from VP deposits (Fig. 3D: CTβ).
Non-tonotopic areas
These areas are dominated by dorsal division projections, though some areas had connections in common with tonotopic fields, e.g. DZ vs. AAF (Fig. 5). In contrast, the multisensory and limbic regions had more input from the dorsal superficial and ventrolateral nuclei. While individual nuclei projected to more than one area, few neurons did so by way of branched axons (Fig. 11B).
The second auditory area(AII) embodies many of the preceding principles and its projections contrast sharply with those to AI. Both injections spanned the rostral third of AII (Fig. 4A: red dots), and labeled many cells in the dorsocaudal (DCa), dorsal (D), deep dorsal (DD) nuclei and in the medial (M) division (Fig. 4D–H: red dots). A similar outcome was seen in all five sets of AII injections. At the caudal pole, two labeled clusters lay in the dorsocaudal and suprageniculate nuclei, resembling temporal and insular cortical projections (Fig. 8D, Fig. 10E: blue dots). Rostrally, these patches merged across several dorsal division nuclei, and extended into the medial division (Fig. 4E–F: red dots). Labeling rostrally was sparser and discontinuous, with neurons scattered in the ventral division, rostral pole, and medial limb of the suprageniculate nucleus (Fig. 4G–I). The labeling locus varied systematically, with more caudal injections arising from ventrolateral parts of the dorsal division in as focal and clustered a manner as input to AI (Lee and Winer, 2005). The labeling encircled and abutted the ventral division, segregating input to AII from that to AI (Fig. 4). Such a distribution occurred in non-tonotopic regions AES and DZ (Fig. 5, Fig. 7). The few double-labeled neurons (~0.3%) were concentrated at the borders of clusters in the deep dorsal nucleus and medial division (Fig. 4E–F).
The dorsal auditory zone (DZ) (He et al., 1997) lies along the dorsomedial aspect of AI and extends from the gyral crest to midway down the sulcal bank. Much like input to areas AII and AES, DZ projections arose from focal clusters in the dorsal (D), deep dorsal (DD) and rostral pole (RP) nuclei. This pattern differed from adjoining tonotopic (AI, AAF) or multisensory (ED) areal connections, which lay in the more central or peripheral MGB regions. Injections were made in both AAF and DZ, the latter on the ventral bank of the suprasylvian gyrus (Fig. 5B). Thalamic labeling was concentrated in the caudal third of the deep dorsal (DD) nucleus and in the medial (M) division (Fig. 5D: red dots). Midway through the MGB, the labeling involved the dorsal (D) division (Fig. 5D–F: red dots). A substantial input (20–30%) arose in the rostral pole (RP) and resembled the AAF pattern (Fig. 5H–I: red dots). In another experiment (data not shown), the rostral pole contribution was even larger, forming a concentrated mass filling the caudal portion of the rostral pole. Interestingly, this distribution resembled features of the adjacent AAF projection (Fig. 5: blue dots). Despite common nuclear input to AAF and DZ, neurons projecting to both fields were segregated topographically and sparse (<3%).
The anterior ectosylvian sulcus (AES) region has several functional subdivisions, including an auditory part along the upper caudal bank (Clarey and Irvine, 1990; Meredith et al., 2006). Four experiments targeted this region. The gyri were retracted to permit orthogonal penetrations along the caudal bank (Fig. 7C). Patterns of input to the caudal bank of AES and AII were similar, with strong dorsal (D) and medial (M) division projections beginning at the caudal one-third of the MGB (Fig. 7E: blue dots). Small continuous clusters of labeling in the deep dorsal nucleus (DD) and medial (M) division ended by the rostral third (Fig. 7F–G: blue dots). In another experiment with tracers separated dorsocaudally in AES, dorsal division clusters were topographically segregated dorsoventrally (Lee and Winer, 2005). Smaller projections (<5%) were scattered in the ventrolateral (Vl), ventral (V), and rostral pole (RP) nuclei and resembled those to other non-tonotopic regions (AII, DZ). The AES labeling pattern resembled that of other non-tonotopic areas, and differed from that of tonotopic, limbic, and multisensory areas (Fig. 11A).
Multisensory areas
Several multimodal areas adjoin the tonotopic and non-tonotopic regions (Cornwell et al., 1998). The thalamocortical connections of multisensory fields of the posterior ectosylvian gyrus (ED, EI, EV), and the limbic-related insular (In) and temporal (Te) areas had their principal affiliations from regions at the perimeter of the MGB. They are distinguished by the topographic location of input, and by extrageniculate labeling patterns.
The posterior ectosylvian gyrus (EP) was subdivided into dorsal (ED), intermediate (EI), and ventral (EV) territories following differential patterns of corticogeniculate (Winer et al., 2001) and corticocollicular (Winer et al., 1998) projections. Each area had prominent input from the dorsal superficial nucleus (DS) (Fig. 7– Fig. 9) and unique input from other regions that substantiated the prior assignment made on the basis of corticofugal projections. ED had substantial medial suprageniculate (Sm) and intralaminar nuclear (Fig. 7, Fig. 8) projections; EI had greater involvement of the rostral pole (Fig. 11), and EV more input from the dorsocaudal (DCa) and ventrolateral (Vl) nuclei (Fig. 9). Thus, the posterior ectosylvian gyrus had a regional dorsoventral axis of organization.
The dorsal posterior ectosylvian gyrus (ED) was studied in four experiments. To compare ED and AES projections, two injections extended caudorostrally along the ectosylvian gyrus (Fig. 7B). Scattered thalamic labeling lay in the dorsal superficial (DS) and lateral suprageniculate (Sl) nuclei in the caudal quarter of the MGB (Fig. 7D). Rostrally, projections clustered in Sl were continuous with those in the medial suprageniculate (Sm) nucleus (Fig. 7F–G: red dots). In contrast, the AES labeling was more central in the dorsal (D) and deep dorsal (DD) nuclei (Fig. 7E–F: blue dots). Moreover, ED received projections from many midline and intralaminar nuclei, e.g., the lateral posterior (LP), laterodorsal (LD), and anteroventral (AV) nuclei (Fig. 7, Fig. 8, Fig. 11A: red dots), which formed multiple patches across nuclear borders. In the intralaminar nuclei, the elongated labeling distribution spanned several nuclei (Fig. 7I, Fig. 8I: red dots) and was highly conserved across experiments, as comparison of ED and In projections shows (Fig. 8). The labeling involved most of the same MGB nuclei as did the In deposits (Fig. 8D–I: blue dots), including the dorsal superficial nucleus, and the Sl and Sm nuclei, with elongated dorsoventral strips (Fig. 8D–I), suggesting an internal organization with an unexpected functional affiliation between these otherwise independent areas. Nevertheless, there were few divergent neurons (~1%) and little overlap between the projections, which were always segregated topographically.
The intermediate posterior ectosylvian gyrus (EI) projections resembled those of ED, as shown in three experiments (Fig. 11A). Besides the suprageniculate involvement, which was weaker than that of ED, area EI had more dorsal superficial (DS) and rostral pole (RP) input (Fig. 11). The latter was clustered ventrally, and also involved the subparafascicular nuclei (as in Fig. 7H). Inputs from the midline and intralaminar nuclei were also reduced and distinguished EI from ED.
The ventral posterior ectosylvian gyrus (EV) had projections distinct from those to ED and EI and was without strong suprageniculate, midline, and intralaminar input (Fig. 9: blue dots). EV deposits strongly label the MGB shell nuclei (Fig. 9B: blue dots). Unlike ED, input clustered caudally and extended to the dorsocaudal (DCa) nucleus (Fig. 9D: blue dots). Rostral labeling extended to the ventrolateral (Vl) nucleus as lateromedial strips (Fig. 9E–I: blue dots), as in the rostral pole projections to EI, implying a connectional continuum between these regions (Fig. 9I: blue dots). Like the other EP regions, a robust input from the dorsal superficial nucleus (DS) was seen (Fig. 9D–G: blue dots). Labeling was also clustered and scattered in caudal DS, and absent rostrally (Fig. 9F: blue dots). The clustered DS labeling after In, Te, and P injections implies that further parcellation of DS may be justified. EV is distinguished from the adjacent tonotopic area (VP) by the absence of strong ventral division projections (Fig. 9), and from the limbic cortex (Te) by the lack of suprageniculate and the abundant ventrolateral nucleus labeling (Fig. 10).
Limbic areas
The insular cortex (In) is subdivided on cytoarchitectonic and connectional grounds, with strong auditory input to the anterior sylvian gyrus rostral to AII (Clascá et al., 1997). Five experiments involving this area (Table 1) had similar labeling patterns. Thalamic input to area In closely resembled that to ED (Fig. 8). However, In projections were unique, arising more caudally in the dorsal superficial (DS) and suprageniculate (Sl) nuclei (Fig. 8D). DS nucleus labeling clustered along its dorsolateral edge after EV, Te, and P injections, and was sparse in the caudal third of the MGB. In contrast, the suprageniculate labeling was robust in the rostral quarter (Fig. 8G: blue dots). The focal projection from the lateral suprageniculate (Sl) formed thin patches medially (Sm), but rarely overlapped with ED labeling (Fig. 8D–G: blue dots). Clustered Sm labeling was the rule, and coincided with cytoarchitectonic clustering (data not shown). Suprageniculate projections were also segregated topographically after injections of two tracers at separate area In loci, recalling the topography in tonotopic and non-tonotopic regions (Lee and Winer, 2005). Insular cortex had unique extrageniculate input, including projections (~10%) from ventromedial (VM) and intralaminar nuclei (Fig. 8I–J: blue dots) that were clustered and crossed nuclear boundaries (Fig. 8I: blue dots). Projections to In did not arise from tonotopic nuclei (V, RP) or from nuclei projecting to non-tonotopic regions (D, DD), much like other limbic and multisensory projections.
The temporal cortex (Te) had among the most focal connections, with >70% arising in the dorsocaudal (DCa) nuclei, input as concentrated and topographic as that to tonotopic and non-tonotopic regions (Fig. 10) (Lee and Winer, 2005). Injections were centered between the pseudosylvian and posterior ectosylvian sulci and the tracers were separated by 2 mm (Fig. 10B–C). The ensuing labeling was similar but segregated topographically. Compared with other areas, Te input arose in the most caudal MGB, and was sparse rostral to 0.23 (Fig. 10D–I). The DCa projection formed a caudal mass and two groups rostrally (Fig. 10D–F). This labeling was continuous and extended laterally into the dorsal superficial nuclei, and into the suprageniculate and adjoining nuclei (Fig. 10F). This pattern became continuous rostrocaudally, forming a V-shaped mass with the vertex caudally (Fig. 10D–F). Caudal injections labeled clusters along the lateral and medial MGB perimeter, with more rostral injections labeling central parts (Fig. 10E). Double-labeled cells were maximal in this case (~6%), and may reflect deposit/tracer proximity (Fig. 11B). Small rostral projections in medial (M), ventrolateral (Vl), and medial suprageniculate (Sm) nuclei cluster like those to AII and In, though on a much reduced scale. Lesser projections arose in extrageniculate, ventromedial (VM) and reuniens (Re) nuclei, as for other limbic and association regions. Strong intralaminar nuclear projections were absent, distinguishing Te from areas In and ED. Thus, like other limbic and association regions, MGB shell nuclei provide most input, and the focal Te labeling pattern distinguished it.
Divergent projections
The maximum number of double-labeled neurons was <6%, after injections <4 mm apart in an area (Fig. 11B). With ~2–3 mm separations in an area, tonotopic areas had the least intraareal divergence (e.g. AI: ~0.5%) and limbic areas the most (e.g. In, Te: ~6%). Interareal divergence was <2%, and independent of the areas injected (ANOVA, p>0.05). The percentage of branched input common to tonotopic areas (AI and AAF) was indistinguishable from that to tonotopic and non-tonotopic areas (AI and AII). Even injections in physiologically matched AI and AAF loci designed to maximize double labeling were indistinguishable from physiologically unmatched deposits (matched vs. unmatched: 1.6 vs. 1%) (Fig. 11B). This sparse double labeling from injections up to 14 mm apart (In and ED) suggested a uniform and modest level of interareal branching for all auditory fields. As a further, positive control, mixtures of both tracers were injected at the same locus, which double labeled nearly all projection neurons, indicating that the uniformly sparse double labeling is not an artifact of differential tracer efficacy (Kishan et al., 2007).
DISCUSSION
Defining auditory cortex
The precise borders of cat auditory cortex and the number of areas in it are unknown, though it is likely far larger than earlier studies suggested (Rose and Woolsey, 1958). We used several criteria to specify areas we considered as auditory, but caution that other sulcal areas may exist and that the intersection of multisensory regions does not always permit borders to be specified with as much precision as in physiological studies, of which few outside the primary, tonotopic regions are available (Reale and Imig, 1980). Thus, each area identified here receives substantial input from the MGB (Winer et al., 1977; present results) and projects to it (Winer et al., 2001) and to the inferior colliculus (Winer et al., 1998), and each has a characteristic pattern of SMI-32 immunoreactivity (Mellott et al., 2005; Lee and Winer, 2008a). The denomination of an area as multisensory rests on the substantial projection to or from it that arises from thalamic or cortical regions with known extraauditory associations and/or the results of joint physiological-anatomical experiments, as in the visual-related fields of the posterior ectosylvian gyrus (Bowman and Olson, 1988) and the amygdaloid-related insular–temporal areas (Romanski and LeDoux, 1992) or the well documented limbic relations of cells in the MGB dorsal division (Shinonaga et al., 1994). Analogous arguments apply to our assignment of part of the suprageniculate nucleus as multisensory, e.g., on the basis of superior colliculus projections to suprageniculate regions that themselves project to insular cortex, which is an example of a joint multisensory and a limbic affiliation (Benedek et al., 1996). The other dimension for areal classification is the effects noted in lesion-behavior studies, which are consistent with the functional subdivision we propose here reviewed in (Winer 1992).
Methodological considerations
In this and related studies of the commissural (Lee and Winer, 2008a) and corticocortical (Lee and Winer, 2008b) projections, we used CTβ and CTβG to examine nuclear and laminar origins, topography, and projection divergence. These tracers are sensitive, compatible, have limited diffusion, and produce little labeling via cut fibers (Llewellyn-Smith et al., 1990; Luppi et al., 1990; Ruigrok et al., 1995). Focal injections were available in each area, often <1 mm in diameter (Fig. 2). Multiple injections in an area ensured ample opportunity for both single and double labeling. The limited diffusion and the deposit placements across several spatial (and unknown functional) axes validated this strategy and suggest that the results represent general patterns; more specific arrangements of input might emerge from deposits focused on one functional domain (Read et al., 2001). The focal labeling was readily related to deposit size. Different survival times yielded consistent and similar outcomes (Table 1), suggesting that tracer depletion from the deposit was not a significant factor in interpreting deposit sites.
The focal nature and limited diffusion of these tracers affects the interpretation of divergent projections. Since each group of injections occupied 1–3 mm2, the limits of any projection may be underestimated due to incomplete saturation of terminal fields (Huang and Winer, 2000). This underestimate is likely modest, since injections in physiologically matched loci, which should maximize double labeling, yielded comparably low numbers (Fig. 11B). Moreover, these tracers permit the unambiguous detection of both single-and double-labeled cells (Fig. 3F). The labeling patterns thus appear to accurately represent auditory thalamocortical projections.
Thalamocortical convergence
Multiple thalamic nuclei project to and converge in each auditory cortex subdivision; a given area receives variable inputs whose impact can reflect their relative numerical contributions (Fig. 11A) (Winer et al., 1977; Niimi and Matsuoka, 1979). The MGB labeling is proportionally much larger than that in the studies cited, which reflects the superior sensitivity of the newer tracers we used. This semiquantitative profile of thalamic input to cortical areas provides an anatomical basis for proposing thalamic and cortical families of areas (Hackett et al., 1998). Thus, classes of tonotopic, non-tonotopic, multisensory, and limbic regions have common nuclear projections, e.g. limbic and multisensory areas receive preferential dorsal division (DCa, DS, Vl, Sl, Sm) and extrageniculate input (Fig. 11A). Global nuclear and areal profiles reveal otherwise unexpected relations of unknown significance, such as the common thalamic input patterns to areas In and ED (Fig. 8). This provides a neural context for comparing and contrasting the physiological organization of multisensory (EP) and limbic association (In) areas, regions whose relationship to hearing is unclear. Other nuclei, such as the medial division, project to diverse functional groups and thus are uniquely situated to modulate auditory cortex activity even more widely.
Physiological work on the functional thalamocortical transformations finds essential MGB roles in cortical RF construction. Thus, faithful CF tuning of AI neurons is supported by large (>80%) ventral division contributions (Miller et al., 2001) (Fig. 4), which differs from the more diverse physiological responses in areas AAF (Schreiner and Urbas, 1986) or P (Loftus and Sutter, 2001) and which include extralemniscal contributions (Fig. 5, Fig. 6). The significance of the substantially larger dorsal division contribution to areas P, AAF and DZ than to VP is unknown. Perhaps area VP has more functionally in common with AI, and we predict that more temporally extended discharge sequences in P, AAF and DZ reflect input from dorsal division sources (He et al., 1997; He and Hashikawa, 1998). The broader neuronal responses in non-primary areas, such as AII (Schreiner and Cynader, 1984) and DZ (He et al., 1997), should reflect the convergent input of several non-lemniscal nuclei, especially the dorsal, deep dorsal, and medial divisions (Fig. 4, Fig. 5), each of which has distinctive laminar input (Huang and Winer, 2000), and from prospective local intrinsic circuits (Prieto et al., 1994).
The synaptic strength of these nuclear contributions should permit the differential termination patterns of individual neurons to modify the salience of nuclei with few projecting neurons. These differences in synaptic weights, terminal targets, and local circuitry may underlie convergence and inheritance (Miller et al., 2001), two fundamental mechanisms of the thalamocortical transformation (Winer et al., 2005). Future work can specify parallels and differences in the thalamocortical transformation within a pathway (e.g., contrasting the ventral and medial division input to AI) and those of parallel streams (e.g., to AAF and P). If the transformation is similar between these pathways, then the whole of AC may behave as multiple semi-independent representations of a sensory epithelium with regional modularity for functional specificity. If the transformations are area-specific, then organizing the continuity among different transformations may reflect and even require corticocortical operations. In either case, the differential thalamic contribution to specific areas is a key datum. Some otherwise unrelated fields (e.g. AII, AES, DZ) share common constellations of thalamic input (Fig. 11A) whose significance is unknown.
Branched projections
Single neuron divergence was <6%, in contrast with results from anterograde studies that show terminal boutons across large areal expanses of the cortex after relatively small thalamic deposits (Huang and Winer, 2000). We found few double-labeled cells, even to areas sharing nuclear projections (e.g. Fig. 8), with maximum values when both tracers were <2 mm apart and in the same area (Fig. 11B), which is well within the range of intrinsic projections (Matsubara and Phillips, 1988; Read et al., 2001). Even with injections at frequency-matched loci in two areas (AI/AAF), the proportion of double-labeled cells was sparse and indistinguishable from the value for unmatched injections (1.6% vs. 1%) (Fig. 11B). Thus, despite similar nuclear origins, single neuron divergence is unexpectedly low (Lee et al., 2004a). These results can be reconciled with the anterograde findings, since most thalamic nuclei have neural populations in adjoining subregions which project to different areas. Even small deposits of anterograde tracers can cross multiple nuclear projection domains, thus revealing extensive nuclear divergence, while labeling the terminal plexus presumably in its entirety. Any role that the limited divergence might have remains an open issue.
We speculate that thalamocortical synchrony driven by single neurons is most powerful in a zone ~2 mm-wide (Fig. 11B). This does not preclude more remote synchrony organized by other ensembles of thalamic cells since local projections spanning multiple auditory areas can coordinate larger neural ensembles (Huang et al., 1999; Cetas et al., 2002). Divergent corticothalamic inputs also extend beyond strictly reciprocal domains (Winer et al., 2001), enabling interareal communication via a corticothalamocortical mechanism (Sherman and Guillery, 1998). Compared with single neuron divergence, these regimes distribute correlated signals widely, are tunable, and not limited to one signaling mode.
Widespread intraareal thalamocortical axonal branching even in primary areas confirms that pure point-to-point models of information processing do not capture the divergence and computational complexity (Brandner and Redies, 1990). In the visual system many types of neuron in the terminal field of thalamocortical afferents are postsynaptic (Davis and Sterling, 1979; Humphrey et al., 1985). Thus, a major thalamic role coordinating intracortical divergence in several systems (inter-and intralaminar, feedforward and feedback, etc.) on a concurrent basis is proposed, an idea consistent with thalamocortical spatial divergence and the breadth of its laminar targets (Huang and Winer, 2000).
Comparing anterograde and retrograde studies
Can the perspectives from axonal labeling and retrograde transport studies be reconciled to achieve a synthesis of thalamocortical organization? From the anterograde viewpoint, thalamic nuclei project divergently to many areas, with specific areal terminations that vary in laminar distribution and density. A focal (~1 mm3) ventral division injection of sensitive anterograde tracer labels all tonotopic regions (Huang and Winer, 2000). Conversely, the retrograde picture accentuates the relative weight and topographic origin of convergent input from multiple thalamic nuclei onto a given area, e.g. AI deposits reveal the dominant ventral division input (Fig. 11A). While anatomically derived weights do not always correlate with the synaptic weights (which themselves are often unknown), they are useful in establishing functionally related projection types (Sherman and Guillery, 1996) for comparing projection patterns among MGB subdivisions.
If an area received nuclear input proportional to its termination strength, then monaural and binaural MGB cells or thalamic subpopulations with different spike discharge patterns will follow a common logic of projection. Such a correspondence could support the reliable transmission of information essential in some signaling regimes (Miller et al., 2001). However, if the proportion of input to an area differed from relative termination strength, then neural populations would have differential inputs and synaptic terminations. Weaker input would be less reliable for information transfer, but ideal for moderating cortical activity (Steriade et al., 1998). If the proportion of input was less than the termination strength, fewer projection neurons would have relatively stronger inputs and more synaptic terminations. This could enable powerful thalamic signaling to the cortex for driving activity or signaling rapid state-dependent changes (Sherman and Guillery, 1996).
Future studies will specify different projection patterns of these prospective lemniscal subgroups. Does each tonotopic area have the same thalamocortical axonal morphology, postsynaptic targets, and laminar and sublaminar terminations? What features distinguish the thalamocortical auditory, visual and somatic sensory pathways? The data available document differences in thalamocortical (Smith and Populin, 2001) and corticothalamic (Prieto et al., 1998) substrates and species dependent features, including comparative differences in MGB local circuit adaptations (Winer, 1992; Winer and Larue, 1996), without delineating functional correlates.
The area-specific convergence of thalamic input must embody the cumulative proportion of cells, their laminar and postsynaptic targets, and their relative termination strength. This analysis complements the diverse areal laminar termination patterns (Huang and Winer, 2000) and can form a basis for new models of thalamocortical processing.
ACKNOWLEDGMENTS
We thank Drs. Christoph Schreiner and Kazuo Imaizumi for physiological mapping and for their generosity in sharing data from these experiments. David Larue and Tania Bettis contributed histological expertise, and Dawn Sung, Richard Lee, Kristen Adams, Haleh Badakoobehi, and Esther Yoon kindly assisted with plotting.
Supported by: National Institutes of Health grant R01 DC2319-29
Abbreviations
- AAF
Anterior auditory field
- AD
Anterior dorsal nucleus
- AES
Anterior ectosylvian field
- aes
Anterior ectosylvian sulcus
- AI
Primary auditory cortex
- AII
Secondary auditory cortex
- AM
Anterior medial thalamic nucleus
- APt
Anterior pretectum
- ass
Anterior suprasylvian sulcus
- AV
Anterior ventral thalamic nucleus
- BIC
Brachium of the inferior colliculus
- C
Caudal
- CG
Central gray
- CIN
Central intralaminar nucleus
- CL
Central lateral nucleus
- CM
Centromedial nucleus
- CP
Cerebral peduncle
- CTβ
Cholera toxin beta subunit
- CTβG
Cholera toxin beta subunit, gold-conjugate
- D
Dorsal
- D
Dorsal nucleus of the medial geniculate body
- DCa
Dorsal caudal nucleus of the medial geniculate body
- DD
Deep dorsal nucleus of the medial geniculate body
- DH
Dorsal hypothalamus
- DS
Dorsal superficial nucleus of the medial geniculate body
- DZ
Dorsal auditory zone
- ED
Posterior ectosylvian gyrus, dorsal part
- EI
Posterior ectosylvian gyrus, intermediate part
- EV
Posterior ectosylvian gyrus, ventral part
- Ha
Habenula
- HiT
Habenulointerpeduncular tract
- III
Oculomotor nucleus
- IL
Intralaminar thalamic nuclei
- In
Insular cortex
- L
Lateral
- LD
Laterodorsal thalamic nucleus
- LGB
Lateral geniculate body
- LGBd
Dorsal lateral geniculate body
- LGBv
Ventral lateral geniculate body
- LMN
Lateral mesencephalic nucleus
- LP
Lateral posterior nucleus
- M
Medial
- MD
Medial dorsal nucleus
- MeV
Mesencephalic nucleus of the trigeminal
- MIN
Medial intralaminar nucleus
- ML
Medial lemniscus
- MR
Mesencephalic reticular formation
- mss
Middle suprasylvian sulcus
- OT
Optic tract
- Ov
Ovoid part of the medial geniculate body
- P
Posterior auditory cortex
- PAC
Paracentral thalamic nucleus
- PAT
Parataenial thalamic nucleus
- PC
Posterior commissure
- pes
Posterior ectosylvian sulcus
- Pf
Parafascicular nucleus
- PFC
Prefrontal cortex
- PHyp
Posterior hypothalamus
- PL
Posterior limitans nucleus
- ps
Pseudosylvian sulcus
- pss
Posterior sylvian sulcus
- Pul
Pulvinar
- R
Rostral
- Re
Nucleus reuniens
- Rh
Rhomboid nucleus
- RN
Red nucleus
- RP
Rostral pole division of the medial geniculate body
- SC
Superior colliculus
- Sl
Suprageniculate nucleus, lateral part
- Sm
Suprageniculate nucleus, medial part
- SN
Substantia nigra
- Sp
Suprapeduncular nucleus
- Spf
Subparafascicular nucleus
- SpN
Suprapeduncular nucleus
- Te
Temporal cortex
- TRN
Thalamic reticular nucleus
- V
Ventral division of the medial geniculate body
- VA
Ventral anterior thalamic nucleus
- Vb
Ventrobasal complex
- Ve
Ventral auditory area
- VL
Ventral lateral thalamic nucleus
- Vl
Ventrolateral nucleus of the medial geniculate body
- VM
Ventral medial thalamic nucleus
- VP
Ventral posterior thalamic nucleus
- Vpl
Ventroposterolateral nucleus
- Vpm
Ventroposteromedial nucleus
- Vpmpc
Ventral medial thalamic nucleus, parvocellular subdivision
- WAHG
Wheat germ apo-horseradish peroxidase gold conjugate
REFERENCES
- Aitkin LM, Dunlop CW. Interplay of excitation and inhibition in the cat medial geniculate body. J Neurophysiol. 1968;31:44–61. doi: 10.1152/jn.1968.31.1.44. [DOI] [PubMed] [Google Scholar]
- Andersen RA, Knight PL, Merzenich MM. The thalamocortical and corticothalamic connections of AI, AII, and the anterior auditory field (AAF) in the cat: evidence for two largely segregated systems of connections. J Comp Neurol. 1980;194:663–701. doi: 10.1002/cne.901940312. [DOI] [PubMed] [Google Scholar]
- Basbaum AI, Menetrey D. Wheat germ agglutinin-apoHRP gold: a new retrograde tracer for light- and electron-microscopic single- and double-label studies. J Comp Neurol. 1987;261:306–318. doi: 10.1002/cne.902610211. [DOI] [PubMed] [Google Scholar]
- Benedek G, Fischer-Szátmári L, Kovács G, Perényi J, Katoh YY. Visual, somatosensory and auditory modality properties along the feline suprageniculate-anterior ectosylvian sulcus/insular pathway. Prog Brain Res. 1996;90:325–334. doi: 10.1016/s0079-6123(08)63339-7. [DOI] [PubMed] [Google Scholar]
- Berman AL, Jones EG. The Thalamus and Basal telencephalon of the Cat: A Cytoarchitectonic Atlas with Stereotaxic Coordinates. Madison: University of Wisconsin Press; 1982. [Google Scholar]
- Bordi F, LeDoux JE. Response properties of single units in areas of rat auditory thalamus that project the amygdala. II. Cells receiving convergent auditory and somatosensory inputs and cells antidromically activated by amygdala stimulation. Exp Brain Res. 1994;98:275–286. doi: 10.1007/BF00228415. [DOI] [PubMed] [Google Scholar]
- Bowman EM, Olson CR. Visual and auditory association areas of the cat's posterior ectosylvian gyrus: Thalamic afferents. J Comp Neurol. 1988;272:15–29. doi: 10.1002/cne.902720103. [DOI] [PubMed] [Google Scholar]
- Brandner S, Redies H. The projection of the medial geniculate body to field AI: organization in the isofrequency dimension. J Neurosci. 1990;10:50–61. doi: 10.1523/JNEUROSCI.10-01-00050.1990. [DOI] [PMC free article] [PubMed] [Google Scholar]
- Calford MB. The parcellation of the medial geniculate body of the cat defined by the auditory response properties of single units. J Neurosci. 1983;3:2350–2364. doi: 10.1523/JNEUROSCI.03-11-02350.1983. [DOI] [PMC free article] [PubMed] [Google Scholar]
- Calford MB, Aitkin LM. Ascending projections to the medial geniculate body of the cat: evidence for multiple, parallel auditory pathways through the thalamus. J Neurosci. 1983;3:2365–2380. doi: 10.1523/JNEUROSCI.03-11-02365.1983. [DOI] [PMC free article] [PubMed] [Google Scholar]
- Cavada C, Reinoso-Suárez F. Topographic organization of the cortical afferent connections of the prefrontal cortex in the cat. J Comp Neurol. 1985;242:293–324. doi: 10.1002/cne.902420302. [DOI] [PubMed] [Google Scholar]
- Cetas JS, Price RO, Velenovsky DS, Crowe JJ, Sinex DG, McMullen NT. Cell types and response properties of neurons in the ventral division of the medial geniculate body of the rabbit. J Comp Neurol. 2002;445:78–96. doi: 10.1002/cne.10164. [DOI] [PubMed] [Google Scholar]
- Clarey JC, Irvine DRF. The anterior ectosylvian sulcal auditory field in the cat: I. An electrophysiological study of its relation to surrounding auditory cortical fields. J Comp Neurol. 1990;301:289–303. doi: 10.1002/cne.903010211. [DOI] [PubMed] [Google Scholar]
- Clascá F, Llamas A, Reinoso-Suárez F. Insular cortex and neighboring fields in the cat: a redefinition based on cortical microarchitecture and connections with the thalamus. J Comp Neurol. 1997;384:456–482. doi: 10.1002/(sici)1096-9861(19970804)384:3<456::aid-cne10>3.0.co;2-h. [DOI] [PubMed] [Google Scholar]
- Cornwell P, Nudo RJ, Straussfogel D, Lomber SG, Payne BR. Dissociation of visual and auditory pattern discrimination functions within the cat's temporal cortex. Behav Neurosci. 1998;112:800–811. doi: 10.1037//0735-7044.112.4.800. [DOI] [PubMed] [Google Scholar]
- Cranford JL, Igarashi M. Effects of auditory cortex lesions on temporal summation in cats. Brain Res. 1977;136:559–564. doi: 10.1016/0006-8993(77)90081-6. [DOI] [PubMed] [Google Scholar]
- Cranford JL, Igarashi M, Stramler JH. Effect of auditory neocortex ablation on pitch perception in the cat. J Neurophysiol. 1976;39:143–152. doi: 10.1152/jn.1976.39.1.143. [DOI] [PubMed] [Google Scholar]
- Creutzfeldt O, Hellweg F-C, Schreiner C. Thalamocortical transformation of responses to complex auditory stimuli. Exp Brain Res. 1980;39:87–104. doi: 10.1007/BF00237072. [DOI] [PubMed] [Google Scholar]
- Davis TL, Sterling P. Microcircuitry of cat visual cortex: classification of neurons in layer IV of area 17, and identification of the patterns of lateral geniculate input. J Comp Neurol. 1979;188:599–628. doi: 10.1002/cne.901880407. [DOI] [PubMed] [Google Scholar]
- de Venecia RK, McMullen NT. Single thalamocortical axons diverge to multiple patches in neonatal auditory cortex. Devel Brain Res. 1994;81:135–142. doi: 10.1016/0165-3806(94)90077-9. [DOI] [PubMed] [Google Scholar]
- Hackett TA, Stepniewska I, Kaas JH. Thalamocortical connections of the parabelt auditory cortex in macaque monkeys. J Comp Neurol. 1998;400:271–286. doi: 10.1002/(sici)1096-9861(19981019)400:2<271::aid-cne8>3.0.co;2-6. [DOI] [PubMed] [Google Scholar]
- He J, Hashikawa T. Connections of the dorsal zone of cat auditory cortex. J Comp Neurol. 1998;400:334–348. doi: 10.1002/(sici)1096-9861(19981026)400:3<334::aid-cne4>3.0.co;2-9. [DOI] [PubMed] [Google Scholar]
- He J, Hashikawa T, Ojima H, Kinouchi Y. Temporal integration and duration tuning in the dorsal zone of cat auditory cortex. J Neurosci. 1997;17:2615–2625. doi: 10.1523/JNEUROSCI.17-07-02615.1997. [DOI] [PMC free article] [PubMed] [Google Scholar]
- Huang CL, Larue DT, Winer JA. GABAergic organization of the cat medial geniculate body. J Comp Neurol. 1999;415:368–392. [PubMed] [Google Scholar]
- Huang CL, Winer JA. Auditory thalamocortical projections in the cat: laminar and areal patterns of input. J Comp Neurol. 2000;427:302–331. doi: 10.1002/1096-9861(20001113)427:2<302::aid-cne10>3.0.co;2-j. [DOI] [PubMed] [Google Scholar]
- Humphrey AL, Sur M, Uhlrich DJ, Sherman SM. Termination patterns of individual X- and Y-cell axons in the visual cortex of the cat: projections to area 18, to the 17/18 border region, and to both areas 17 and 18. J Comp Neurol. 1985;233:190–212. doi: 10.1002/cne.902330204. [DOI] [PubMed] [Google Scholar]
- Imig TJ, Morel A. Topographic and cytoarchitectonic organization of thalamic neurons related to their targets in low-, middle-, and high-frequency representations in cat auditory cortex. J Comp Neurol. 1984;227:511–539. doi: 10.1002/cne.902270405. [DOI] [PubMed] [Google Scholar]
- Imig TJ, Morel A. Tonotopic organization in ventral nucleus of medial geniculate body in the cat. J Neurophysiol. 1985;53:309–340. doi: 10.1152/jn.1985.53.1.309. [DOI] [PubMed] [Google Scholar]
- Imig TJ, Reale RA. Patterns of cortico-cortical connections related to tonotopic maps in cat auditory cortex. J Comp Neurol. 1980;192:293–332. doi: 10.1002/cne.901920208. [DOI] [PubMed] [Google Scholar]
- Jenkins WM, Merzenich MM. Role of cat primary auditory cortex for sound-localization behavior. J Neurophysiol. 1984;52:819–847. doi: 10.1152/jn.1984.52.5.819. [DOI] [PubMed] [Google Scholar]
- Jones EG, Burton H. Cytoarchitecture and somatic sensory connectivity of thalamic nuclei other than the ventrobasal complex in the cat. J Comp Neurol. 1974;154:395–432. doi: 10.1002/cne.901540404. [DOI] [PubMed] [Google Scholar]
- Kishan AU, Lee CC, Larue DT, Winer JA. Auditory thalamocortical system: dual projections via branched axons. Assn Res Otolayngol Abstr. 2007;30 [Google Scholar]
- Lee CC, Imaizumi K, Schreiner CE, Winer JA. Concurrent tonotopic processing streams in auditory cortex. Cereb Cortex. 2004a;14:441–451. doi: 10.1093/cercor/bhh006. [DOI] [PubMed] [Google Scholar]
- Lee CC, Schreiner CE, Imaizumi K, Winer JA. Tonotopic and heterotopic projection systems in physiologically defined auditory cortex. Neuroscience. 2004b;128:871–887. doi: 10.1016/j.neuroscience.2004.06.062. [DOI] [PubMed] [Google Scholar]
- Lee CC, Winer JA. Principles governing auditory cortex connections. Cereb Cortex. 2005;15:1804–1814. doi: 10.1093/cercor/bhi057. [DOI] [PubMed] [Google Scholar]
- Lee CC, Winer JA. Connections of cat auditory cortex. I. Thalamocortical system. J Comp Neurol. 2008a;507:1879–1900. doi: 10.1002/cne.21611. [DOI] [PMC free article] [PubMed] [Google Scholar]
- Lee CC, Winer JA. Connections of cat auditory cortex. III. Corticocortical system. J Comp Neurol. 2008b;507:1920–1943. doi: 10.1002/cne.21613. [DOI] [PMC free article] [PubMed] [Google Scholar]
- Llewellyn-Smith IJ, Minson JB, Wright AP, Hodgson AJ. Cholera toxin B-gold, a retrograde tracer that can be used in light and electron microscopic immunocytochemical studies. J Comp Neurol. 1990;294:179–191. doi: 10.1002/cne.902940203. [DOI] [PubMed] [Google Scholar]
- Loftus WC, Sutter ML. Spectrotemporal organization of excitatory and inhibitory receptive fields of cat posterior auditory field neurons. J Neurophysiol. 2001;86:475–491. doi: 10.1152/jn.2001.86.1.475. [DOI] [PubMed] [Google Scholar]
- Lomber SG, Malhotra S, Hall AJ. Functional specialization in non-primary auditory cortex of the cat: areal and laminar contributions to sound localization. Hear Res. 2007;229:31–45. doi: 10.1016/j.heares.2007.01.013. [DOI] [PubMed] [Google Scholar]
- Luppi PH, Fort P, Jouvet M. Iontophoretic application of unconjugated cholera toxin B subunit (CTb) combined with immunohistochemistry of neurochemical substances: a method for transmitter identification of retrogradely labeled neurons. Brain Res. 1990;534:209–224. doi: 10.1016/0006-8993(90)90131-t. [DOI] [PubMed] [Google Scholar]
- Matsubara JA, Phillips DP. Intracortical connections and their physiological correlates in the primary auditory cortex (AI) of the cat. J Comp Neurol. 1988;268:38–48. doi: 10.1002/cne.902680105. [DOI] [PubMed] [Google Scholar]
- Mellott JG, Van der Gucht E, Lee CC, Larue DT, Winer JA, Lomber SG. Subdividing cat primary and non-primary auditory areas in the cerebrum with neurofilament proteins expressing SMI-32. Assn Res Otolayngol Abstr. 2005;28:994. [Google Scholar]
- Meredith MA, Keniston LR, Dehner LR, Clemo HR. Crossmodal projections from somatosensory area SIV to the anterior ectosylvian sulcus (FAES) in cat: further evidence for subthreshold forms of multisensory processing. Exp Brain Res. 2006;172:472–484. doi: 10.1007/s00221-006-0356-3. [DOI] [PubMed] [Google Scholar]
- Merzenich MM, Knight PL, Roth GL. Cochleotopic organization of primary auditory cortex in the cat. Brain Res. 1973;63:343–346. doi: 10.1016/0006-8993(73)90101-7. [DOI] [PubMed] [Google Scholar]
- Middlebrooks JC, Zook JM. Intrinsic organization of the cat's medial geniculate body identified by projections to binaural response-specific bands in the primary auditory cortex. J Neurosci. 1983;3:203–225. doi: 10.1523/JNEUROSCI.03-01-00203.1983. [DOI] [PMC free article] [PubMed] [Google Scholar]
- Miller L, Escabi MA, Read HL, Schreiner CE. Spectrotemporal receptive fields in the lemniscal auditory thalamus and cortex. J Neurophysiol. 2002;87:516–527. doi: 10.1152/jn.00395.2001. [DOI] [PubMed] [Google Scholar]
- Miller LM, Escabi MA, Read HL, Schreiner CE. Functional convergence of response properties in the auditory thalamocortical system. Neuron. 2001;32:151–160. doi: 10.1016/s0896-6273(01)00445-7. [DOI] [PubMed] [Google Scholar]
- Morel A, Imig TJ. Thalamic projections to fields A, AI, P, and VP in the cat auditory cortex. J Comp Neurol. 1987;265:119–144. doi: 10.1002/cne.902650109. [DOI] [PubMed] [Google Scholar]
- Niimi K, Matsuoka H. Thalamocortical organization of the auditory system in the cat studied by retrograde axonal transport of horseradish peroxidase. Adv Anat Embryol Cell Biol. 1979;57:1–56. doi: 10.1007/978-3-642-67353-5. [DOI] [PubMed] [Google Scholar]
- Prieto JJ, Bui LL, Hong JH, Larue DT, Winer JA. Cytoarchitecture and GABAergic organization of the mustached bat auditory cortex. Proc Soc Neurosci. 1998;24:1881. [Google Scholar]
- Prieto JJ, Peterson BA, Winer JA. Morphology and spatial distribution of GABAergic neurons in cat primary auditory cortex (AI) J Comp Neurol. 1994;344:349–382. doi: 10.1002/cne.903440304. [DOI] [PubMed] [Google Scholar]
- Read HL, Winer JA, Schreiner CE. Modular organization of intrinsic connections associated with spectral tuning in cat auditory cortex. Proc Natl Acad Sci USA. 2001;98:8042–8047. doi: 10.1073/pnas.131591898. [DOI] [PMC free article] [PubMed] [Google Scholar]
- Reale RA, Imig TJ. Tonotopic organization in auditory cortex of the cat. J Comp Neurol. 1980;182:265–291. doi: 10.1002/cne.901920207. [DOI] [PubMed] [Google Scholar]
- Romanski LM, LeDoux JE. Equipotentiality of thalamo-amygdala and thalamo-cortico-amygdala circuits in auditory fear conditioning. J Neurosci. 1992;12:4501–4509. doi: 10.1523/JNEUROSCI.12-11-04501.1992. [DOI] [PMC free article] [PubMed] [Google Scholar]
- Rose JE. The cellular structure of the auditory region of the cat. J Comp Neurol. 1949;91:409–440. doi: 10.1002/cne.900910305. [DOI] [PubMed] [Google Scholar]
- Rose JE, Woolsey CN. Cortical connections and functional organization of thalamic auditory system of cat. In: Harlow HF, Woolsey CN, editors. Biological and Biochemical Bases of Behavior. Madison: University of Wisconsin Press; 1958. pp. 127–150. [Google Scholar]
- Ruigrok TJ, Teune TM, van der Burg J, Sabel-Goedknegt H. A retrograde double-labeling technique for light microscopy. A combination of axonal transport of cholera toxin B-subunit and a gold-lectin conjugate. J Neurosci Meth. 1995;61:127–138. doi: 10.1016/0165-0270(94)00034-e. [DOI] [PubMed] [Google Scholar]
- Schreiner CE, Cynader MS. Basic functional organization of second auditory cortical field (AII) of the cat. J Neurophysiol. 1984;51:1284–1305. doi: 10.1152/jn.1984.51.6.1284. [DOI] [PubMed] [Google Scholar]
- Schreiner CE, Urbas JV. Representation of amplitude modulation in the auditory cortex of the cat. I. The anterior auditory field (AAF) Hear Res. 1986;21:227–241. doi: 10.1016/0378-5955(86)90221-2. [DOI] [PubMed] [Google Scholar]
- Sherman SM, Guillery RW. Functional organization of thalamocortical relays. J Neurophysiol. 1996;76:1367–1395. doi: 10.1152/jn.1996.76.3.1367. [DOI] [PubMed] [Google Scholar]
- Sherman SM, Guillery RW. On the actions that one nerve cell can have on another: distinguishing "drivers" from "modulators". Proc Natl Acad Sci USA. 1998;95:7121–7126. doi: 10.1073/pnas.95.12.7121. [DOI] [PMC free article] [PubMed] [Google Scholar]
- Shinonaga Y, Takada M, Mizuno N. Direct projections from the non-laminated divisions of the medial geniculate nucleus to the temporal polar cortex and amygdala in the cat. J Comp Neurol. 1994;340:405–426. doi: 10.1002/cne.903400310. [DOI] [PubMed] [Google Scholar]
- Smith PH, Populin LC. Fundamental differences between the thalamocortical recipient layers of the cat auditory and visual cortices. J Comp Neurol. 2001;436:508–519. doi: 10.1002/cne.1084. [DOI] [PubMed] [Google Scholar]
- Snider RS, Niemer WT. A stereotaxic atlas of the cat brain. Chicago, IL: University of Chicago Press; 1961. [Google Scholar]
- Steriade M, Timofeev I, Grenier F, Dürmüller N. Role of thalamic and cortical neurons in augmenting responses and self-sustained activity: dual intracellular recordings in vivo. J Neurosci. 1998;18:6425–6443. doi: 10.1523/JNEUROSCI.18-16-06425.1998. [DOI] [PMC free article] [PubMed] [Google Scholar]
- Sternberger LA, Sternberger NH. Monoclonal antibodies that distinguish phosphorylated and nonphosphorylated forms of filament in situ. Proc Natl Acad Sci USA. 1983;80:6126–6130. doi: 10.1073/pnas.80.19.6126. [DOI] [PMC free article] [PubMed] [Google Scholar]
- Van der Gucht E, Vandesande F, Arckens L. Neurofilament protein: a selective marker for the architectonic parcellation of the visual cortex in adult cat brain. J Comp Neurol. 2001;441:345–368. doi: 10.1002/cne.1416. [DOI] [PubMed] [Google Scholar]
- Velenovsky DS, Cetas JS, Price RO, Sinex DG, McMullen NT. Functional subregions in primary auditory cortex defined by thalamocortical terminal arbors: an electrophysiological and anterograde labeling study. J Neurosci. 2003;23:308–316. doi: 10.1523/JNEUROSCI.23-01-00308.2003. [DOI] [PMC free article] [PubMed] [Google Scholar]
- Winer JA. Anatomy of layer IV in cat primary auditory cortex (AI) J Comp Neurol. 1984a;224:535–567. doi: 10.1002/cne.902240405. [DOI] [PubMed] [Google Scholar]
- Winer JA. Identification and structure of neurons in the medial geniculate body projecting to primary auditory cortex (AI) in the cat. Neuroscience. 1984b;13:395–413. doi: 10.1016/0306-4522(84)90239-2. [DOI] [PubMed] [Google Scholar]
- Winer JA. The non-pyramidal neurons in layer III of cat primary auditory cortex (AI) J Comp Neurol. 1984c;229:512–530. doi: 10.1002/cne.902290406. [DOI] [PubMed] [Google Scholar]
- Winer JA. The pyramidal cells in layer III of cat primary auditory cortex (AI) J Comp Neurol. 1984d;229:476–496. doi: 10.1002/cne.902290404. [DOI] [PubMed] [Google Scholar]
- Winer JA. The medial geniculate body of the cat. Adv Anat Embry Cell Biol. 1985a;86:1–98. [PubMed] [Google Scholar]
- Winer JA. Structure of layer II in cat primary auditory cortex (AI) J Comp Neurol. 1985b;238:10–37. doi: 10.1002/cne.902380103. [DOI] [PubMed] [Google Scholar]
- Winer JA. The functional architecture of the medial geniculate body and the primary auditory cortex. In: Webster DB, Popper AN, Fay RR, editors. Springer Handbook of Auditory Research, volume 1, The Mammalian Auditory Pathway: Neuroanatomy. New York: Springer-Verlag; 1992. pp. 222–409. [Google Scholar]
- Winer JA. Steps toward a theory of medial geniculate body function. Proc Soc Neurosci. 2006;32:344–316. [Google Scholar]
- Winer JA, Diamond IT, Raczkowski D. Subdivisions of the auditory cortex of the cat: the retrograde transport of horseradish peroxidase to the medial geniculate body and posterior thalamic nuclei. J Comp Neurol. 1977;176:387–418. doi: 10.1002/cne.901760307. [DOI] [PubMed] [Google Scholar]
- Winer JA, Diehl JJ, Larue DT. Projections of auditory cortex to the medial geniculate body of the cat. J Comp Neurol. 2001;430:27–55. [PubMed] [Google Scholar]
- Winer JA, Larue DT. Evolution of GABAergic circuitry in the mammalian medial geniculate body. Proc Natl Acad Sci U S A. 1996;93:3083–3087. doi: 10.1073/pnas.93.7.3083. [DOI] [PMC free article] [PubMed] [Google Scholar]
- Winer JA, Larue DT, Diehl JJ, Hefti BJ. Auditory cortical projections to the cat inferior colliculus. J Comp Neurol. 1998;400:147–174. [PubMed] [Google Scholar]
- Winer JA, Lee CC. The distributed auditory cortex. Hear Res. 2007;229:3–13. doi: 10.1016/j.heares.2007.01.017. [DOI] [PMC free article] [PubMed] [Google Scholar]
- Winer JA, Miller LM, Lee CC, Schreiner CE. Auditory thalamocortical transformation: structure and function. Trends Neurosci. 2005;28:255–263. doi: 10.1016/j.tins.2005.03.009. [DOI] [PubMed] [Google Scholar]
- Winer JA, Morest DK. The neuronal architecture of the dorsal division of the medial geniculate body of the cat. A study with the rapid Golgi method. J Comp Neurol. 1983;221:1–30. doi: 10.1002/cne.902210102. [DOI] [PubMed] [Google Scholar]
- Winer JA, Morest DK. Axons of the dorsal division of the medial geniculate body of the cat: A study with the rapid Golgi method. J Comp Neurol. 1984;224:344–370. doi: 10.1002/cne.902240304. [DOI] [PubMed] [Google Scholar]
- Winer JA, Prieto JJ. Layer V in cat primary auditory cortex (AI): cellular architecture and identification of projection neurons. J Comp Neurol. 2001;434:379–412. doi: 10.1002/cne.1183. [DOI] [PubMed] [Google Scholar]
- Woolsey CN. Organization of cortical auditory system: a review and synthesis. In: Rasmussen GL, Windle WF, editors. Neural Mechanisms of the Auditory and Vestibular Systems. Springfield, Illinois: Charles C Thomas; 1960. pp. 165–180. [Google Scholar]