

Abstract
Midazolam is a common probe used to predict CYP3A activity, but multiple blood samples are necessary to determine midazolam's area under the concentration-time curve (AUC). As such, single sampling strategies have been examined. The purpose of this study was to assess the ability of single midazolam concentrations to predict midazolam AUC in the presence and absence of CYP3A modulation by Ginkgo biloba extract (GBE). Subjects received oral midazolam 8 mg before and after 28 days of GBE administration. Postdose blood samples were collected during both study periods and midazolam AUC determined. Linear regression was used to generate measures of predictive performance for each midazolam concentration. The geometric mean ratio (90% confidence intervals) of midazolam AUC0-∞ post-GBE/AUC0-∞ pre-GBE was 0.66 (0.49-0.84) (P = .03). Before and after GBE administration, optimal midazolam sampling times were identified at 3.5 to 5 hours and 2 to 3 hours, respectively. Single midazolam concentrations between 2 and 5 hours correctly predicted the reduction in midazolam AUC following GBE exposure, but confidence intervals were generally wide. Intersubject variability in CYP3A activity (either inherent or from drug administration) alters the prediction of optimal midazolam sampling times; therefore, midazolam AUC is preferred for assessing CYP3A activity in drug-drug interaction studies.
Keywords: Midazolam, Ginkgo biloba extract, drug interactions, CYP3A
Cytochrome P 450 (CYP) is a large group of enzymes responsible for phase I oxidative metabolism. CYP enzymes are located in various tissues throughout the body, with the liver being the largest source. Two intestinal CYP isoforms that account for approximately 70% of total intestinal CYP activity include CYP3A4 and CYP3A5. Because >50% of CYP-metabolized drugs are substrates for CYP3A, modulation of this enzyme is the source of numerous drug-drug interactions.1 However, it is not practical to study each CYP3A substrate to determine its interaction potential with CYP3A-modulating medications. As such, various CYP3A probe drugs have been identified to detect and quantify potential CYP3A-mediated drug-drug interactions.2
Midazolam has been used extensively as a probe for determining CYP3A4 and 3A5 catalytic activity in vivo; it is metabolized by CYP3A4 and CYP3A5 to its primary metabolite, 1′-hydroxy-midazolam, and 2 minor metabolites, 4-hydroxymidazolam and 1,4-dihydroxymidazolam.2 Several studies have assessed the usefulness of serum 1′-hydroxymidazolam/midazolam concentration ratios to predict CYP3A activity, but results from these investigations have been inconsistent.2-4 Conversely, midazolam clearance has proven to be an effective marker for CYP3A activity; as such, it is widely used for predicting CYP3A-mediated drug-drug interactions.2 However, characterizing midazolam disposition following intravenous or oral administration requires collection of sequential blood samples, which may be burdensome to some researchers and study subjects.
The purpose of this healthy volunteer study was to assess the ability of single postdose midazolam concentrations to independently predict CYP3A activity as determined by midazolam area under the concentration-time curve (AUC), in the presence and absence of a newly described CYP3A-modulating compound, and to assess potential limitations associated with this approach. This study was a nested substudy of a larger investigation that examined the influence of Ginkgo biloba leaf extract (GBE) on the pharmacokinetics of the HIV protease inhibitor combination lopinavir/ritonavir.
METHODS
Study Subjects
To be considered for study inclusion, subjects had to be 18 to 50 years old and in good general health as determined by medical history, physical exam, complete blood cell count, and serum chemistries (electrolytes, liver function tests, creatinine, and blood urea nitrogen). Subjects were also required to be HIV negative (enzyme-linked immunosorbent assay [ELISA]). Women of childbearing potential had to have a negative serum pregnancy test and be willing to practice abstinence or use effective nonhormonal methods of birth control during the study (ie, condoms, diaphragms, etc). Breastfeeding mothers were also prohibited from study participation. In addition, subjects refrained from grapefruit or grapefruit juice during the course of the study. Additional exclusion criteria included chronic use of any prescription, over-the-counter, or herbal medication (other than that required by the protocol) for 30 days prior to study participation. Intermittent use of acetaminophen, nonsteroidal anti-inflammatory medications, and loperamide was allowed during the study to treat side effects associated with the study drugs. However, these medications were prohibited for the 72-hour period preceding pharmacokinetic sampling days. Additional criteria that precluded subject participation included poor venous access, plans for elective surgery during the study or shortly thereafter, persistent diarrhea or malabsorption, history of allergic reaction or intolerance to any of the study drugs, and use of nicotine-containing products, including cigarettes, cigars, and chewing tobacco. Informed consent was obtained from all subjects, and clinical research was conducted in accordance with guidelines for human experimentation as specified by the US Department of Health and Human Services. This study was approved by the National Institute of Allergy and Infectious Diseases Institutional Review Board.
Study Design and Treatments
The study was conducted as a single-sequence, longitudinal investigation in healthy human subjects. A schematic of the study design is shown in Figure 1. Study participants received a single oral dose of midazolam 8 mg, before (baseline) and on day 27 of a 4-week course of GBE administration. On the morning of study day 1, after fasting overnight, subjects arrived at the clinic and had an intravenous catheter inserted into a forearm vein, from which a predose (0 hours) blood sample was obtained. Each subject then received a standard breakfast, along with 8 mg of midazolam syrup (4 mL; Roche Laboratories, Nutley, New Jersey) and 240 mL of water. The breakfast consisted of a bagel with cream cheese, 4 oz apple sauce, 4 oz orange juice, and 240 mL 2% milk. Venous blood samples for determination of midazolam concentrations were collected into 8-mL anticoagulant-free red-top tubes 0.5, 1, 1.5, 2, 2.5, 3, 3.5, 4, 5, 6, 8, and 24 hours after midazolam administration. After the 8-hour blood draw, subjects' venous catheters were removed, and they were dismissed from the clinic. Subjects returned the following morning for a 24-hour postdose blood draw by venipuncture. After collection of each blood sample, plasma was harvested via centrifugation and stored at -80°C until analyzed for midazolam.
Figure 1.

Study design. PO, by mouth; LPV/r, lopinavir 400 mg + ritonavir 100 mg daily dose; PK, pharmacokinetic.
After a 7- to 28-day washout period, subjects began taking GBE (120 mg standardized Ginkgo biloba extract; Martin Bauer North America, Torrance, California) twice daily for 27 days and a single dose in the morning of day 28. In the morning of day 27 of GBE administration, volunteers returned to the clinic, and study procedures from day 1 were repeated except that subjects took GBE 120 mg along with their midazolam dose. In addition, a tablet count was conducted on this day to assess subject adherence to the GBE dosing schedule. On the morning of day 28 of GBE dosing, subjects arrived at the clinic for their 24-hour midazolam sample collected via venipuncture; they also took their final GBE dose at this time. All serum samples were processed and stored as previously described.
Midazolam Analysis
Midazolam serum concentrations were determined using a high-performance liquid chromatography (HPLC)/tandem mass spectrometry (MS/MS) method newly developed and validated in our laboratory. The HPLC/MS/MS analysis was performed using an XTerra RP18 5-μm, 4.6 × 150-mm reverse-phase analytical column preceded by an XTerra RP18 5-μm, 3.9 × 20-mm guard column (Waters Corp, Milford, Massachusetts) with a mobile phase consisting of a 70:30 (v/v) mixture of 10 mM ammonium acetate adjusted to pH 3.80 with formic acid and acetonitrile at a flow rate of 0.250 mL/min. The HPLC system consisted of a Waters 2795 Alliance HT separations module and a Quattro Premier XE triple quadruple mass spectrometer (Waters Corp) controlled by Mass Lynx 4.1 mass spectrometry and chromatography manager software. The Quattro premier was used in the positive electrospray mode with a source temperature of 125°C, desolvation temperature of 400°C, desolvation gas flow of 650 L/h, cone flow of 24 L/h, capillary voltage of 0.60 kV, cone voltage of 40 V, and collision energy of 25.0 for multiple-reaction monitoring (MRM) experiments. Nitrogen was used as the nebulizer, auxiliary, and desolvation gas, whereas argon was used as the collision gas. The resolution was set at 0.60 amu width at half-height in both Q1 and Q3, and the analytes were detected using MRM with a 200-ms dwell time. MRM transitions were optimized by direct infusion of midazolam, haloperidol, and alprazolam at a concentration of 100 ng/mL each and a syringe pump flow rate of 10 μL/min. The optimal transitions were 325.88 → 291.18 for midazolam, 376.18 → 164.87 for haloperidol, and 309.00 → 281.00 for alprazolam. Calibration curves were linear from 1.0 ng/mL (R2 > 0.998). Percent errors, as a measure of accuracy, were <15%, and the inter- and intra-assay coefficients of variation were 1.31% to 8.48% and 3.53% to 6.03%, respectively, at 3 different drug concentrations. The limit of quantitation was 1.0 ng/mL, and the limit of detection was 0.20 ng/mL. During the validation, short-term stability of the drug in serum and repeated freezing and thawing of serum were evaluated. The overall recovery of all 4 analytes was >90%.
Ginkgo biloba Formulation Analysis
The GBE extract was purchased commercially as 120-mg capsules from a single manufacturing lot (Lot #T320667, Nature's Way, Inc, Springville, Utah). Ginkgo flavanol glycosides and ginkgo terpene lactones were analyzed by the Herbal Evaluation and Analysis Laboratory at the British Columbia Institute of Technology (Burnaby, Canada) using HPLC with UV detection and HPLC with evaporative light-scattering detection (ELSD), respectively. The analysis was conducted in accordance with American Herbal Pharmacopoeia standards.5 After the respective quantities of flavanol glycosides and ginkgo terpene lactones were determined, they were compared with the amounts listed on the product label. A total of 80 capsules from a single lot (2 bottles) were analyzed, with 5 aliquots of test material analyzed for each assay. The amount of flavonol glycosides present in the tested sample was 35.0 ± 1.7 mg (29.2%) versus the manufacturer's label claim of 28.8 mg (24%). Terpene lactones accounted for 6.1 ± 0.7 mg (5.08%) compared with a label claim of 7.2 mg (6%) per capsule.
Data Analysis
Midazolam pharmacokinetic parameter values were determined before and after 4 weeks of GBE administration using noncompartmental methods (WinNonlin Professional Version 5.0; Pharsight Corporation, Mountain View, California); this resulted in the formation of 2 data sets, 1 consisting of midazolam pharmacokinetic profiles before GBE dosing (phase 1) and 1 consisting of midazolam pharmacokinetics after GBE dosing (phase 2). Individual postdose midazolam concentrations at 0, 0.5, 1, 2, 2.5, 3, 3.5, 4, 5, 6, 8, and 24 hours were determined by visual inspection of the concentration-time profiles. The elimination rate constant (λz) was estimated as the absolute value of the slope of a linear regression of a natural logarithm of concentration versus time. Values for AUC from 0 hours to the last quantifiable concentration (AUClast) were determined by the linear trapezoidal rule. AUC from time 0 to infinity (AUC0-∞) was determined by dividing the last measured concentration by the elimination rate constant (λz) and adding this value to AUClast. Mean residence time (MRT) was calculated by the linear trapezoidal rule, with extrapolation to infinity, by dividing the area of the first momentum curve (AUMC) by the AUC0-∞. MRT time has been used alone, or in combination with other predictors, to select an optimal midazolam sampling time after intravenous or oral administration of the drug.6-8
Correlations between midazolam AUC0-∞ and midazolam serum concentrations at each time point were evaluated by unweighted and weighted (1/y, 1/y2) linear regression; the data were also assessed for normality (Sigma Plot 4.0 for Windows, 1997, by SPSS, Chicago, Illinois). Predictive performance was assessed for individual midazolam serum concentrations by measuring precision, bias, and coefficient of determination (r2) for each sample; these data were used to compare predictive performances among the individual midazolam serum concentrations, as discussed by Sheiner and Beal.9 Precision and bias were assessed by use of mean squared prediction errors (MSE) and median prediction errors (ME) of the predicted AUCs (AUCpred), respectively.9 In addition, AUCpred values were compared with actual AUC values using unweighted linear regression, where r2 served as a measure of association between actual and predicted values. The regression slope was plotted versus unity as an indicator of accuracy. Collectively, MSE, ME, and MRT were compared among predictors to yield the optimal nominal sampling time for midazolam in both data sets. MSE and ME (as well as all descriptive data) were generated using Microsoft Excel 2003 (Microsoft Corporation, Redmond, Washington).
Single-point midazolam serum concentrations at optimal sampling times, identified as described above, were compared pre- and post-GBE administration by repeated-measures analysis of variance (ANOVA) followed by Bonferroni post hoc testing. A P value <.05 was accepted as statistically significant. Differences between pre- and postserum midazolam concentrations, at their respective time points, were assessed for significance to determine whether midazolam concentrations at a particular time point accurately predicted the statistically significant change in AUC0-∞ that was observed between the study phases (pre- and post-GBE administration). Individual t tests were also performed on midazolam concentrations pre- and post-GBE (Microsoft Excel 2003); this analysis was performed to simulate whether a significant difference (P < .05) would have been reported for any of the midazolam time points had sampling been limited to a single postdose collection and the data compared using a 2-tailed, paired Student t test. In this context, P values were not corrected for multiple comparisons because they were determined under the auspices of a simulated scenario. Ratios (post-GBE/pre-GBE) for AUC0-∞ and single-point midazolam concentrations were used to assess differences from control (midazolam concentrations before GBE administration) using geometric mean ratios (GMRs) with 90% confidence intervals (CIs). If the confidence interval embraced the value of no effect (relative risk = 1), the treatment under investigation (GBE administration) was accepted as not significantly differing from control. The Student t test was also used to compare AUC0-∞ between study phases. For all inferential statistical testing, a P value <.05 was considered to be statistically significant.
Sample Size Calculation
With α set to 0.05 and β = 0.2, 12 pairs of subjects were needed to obtain 83% power to determine an effect size of 35% (between midazolam AUC0-∞ preand post-GBE administration) using a relative standard deviation of 0.38, estimated from a previous investigation of oral midazolam pharmacokinetics8 (SYSTAT Software Version 11, 2004; SYSTAT, Inc, Chicago, Illinois).
RESULTS
Fifteen subjects (7 men) were enrolled in the study; however, 2 subjects dropped out due to pregnancy and for personal reasons, respectively. The median age of the study participants was 29.5 years (range, 22-48 years) at enrollment. The racial distribution was 21.4% Asian and Pacific Islander; 7.1% black, non-Hispanic; and 71.4% white, non-Hispanic. Scheduled capsule counts and patient interviews did not yield any evidence of missed doses of study drug.
Overall, GBE and midazolam were well tolerated, and no subjects discontinued participation because of adverse effects associated with the study drugs. Light sedation occurred in nearly all subjects after midazolam administration, but the subjects were easily awakened by verbal command. Nausea, decreased appetite, and headache were the only adverse effects reported (n = 2). Laboratory abnormalities occurred in 4 subjects; they included decreased hemoglobin, elevated total bilirubin, and elevations in serum triglycerides and cholesterol. However, these laboratory abnormalities and all adverse effects were grade 1 and did not require medical intervention.
Midazolam concentrations were measurable at 24 hours postdose in 12 of 13 subjects in phase 1 (midazolam alone) and in 1 of 13 subjects in phase 2 (midazolam post-GBE administration for 4 weeks). In the subjects without quantifiable midazolam concentrations at 24 hours, extrapolation to infinity from the last measured concentration (8 hours in all cases) indicated that AUClast represented 85% to 97% of AUC0-∞. The geometric mean Midazolam AUC0-∞ (90% CI) prior to GBE administration was 104 (77-132) ng·h/mL, and the geometric mean AUC0-∞ for midazolam after GBE administration was 69 (42-96) ng·h/mL; the AUC0-∞ GMR between the study phases was 0.66 (0.49-0.84) (P = .03). Detailed results of the interaction between GBE and midazolam (and lopinavir + ritonavir) are not included among the results of this nested substudy and will be reported elsewhere.
The performance of single midazolam concentrations to predict midazolam AUC0-∞ was assessed by determining the precision, bias, and coefficients of determination (r2) for each of the single midazolam time points (Tables I and II, Figures 2 and 3). Prior to GBE administration, optimal sampling times based on r2, ME, and MSE were 4, 5, and 3.5 hours, respectively; MRT was 3.47 hours (range, 3.11-3.82 hours) in this group (Table I). After 4 weeks of GBE administration, the optimal sampling times based on r2, ME, and MSE were 2 and 8 hours, 2.5 hours, and 2 hours, respectively; MRT was 3.1 hours (range, 2.72-3.51 hours) in this group (Table II). In general, however, there were little differences in r2 and ME values among the individual time points both pre- and post-GBE dosing, except for the 0.5-hour sample, which yielded the lowest r2 and highest ME measurement during both study phases. Conversely, MSE varied much more between midazolam time points, with the lowest value (36, at the 3.5-hour time point) being nearly 7-fold less than the next highest value (244, at 4 hours) (Table I). In contrast, after GBE administration, there was little difference in MSE measurements, which ranged from 145 to 176 among midazolam samples at 1.5, 2, 2.5, and 8 hours.
Table I.
Evaluation of Single Midazolam Samples for Predicting Midazolam AUC Prior to the Administration of a CYP3A-Inducing Agent (Phase 1)
| Time, h | r2 | Median Prediction Error (Residual)a (90% CI) | Mean Squared Prediction Errorb (90% CI) | MRT Phase 1c (90% CI) |
|---|---|---|---|---|
| .5 | 0.889 | -5.75 (-20, 20) | 1874 (993-2756) | |
| 1 | 0.938 | 1.67 (-15, 15) | 1044.75 (380-1710) | |
| 1.5 | 0.966 | -2.11 (-11, 11) | 575 (108-1042) | |
| 2 | 0.918 | 0.52 (-17, 17) | 1381 (382-2380) | |
| 2.5 | 0.956 | 0.75 (-12, 12) | 740 (116-1364) | |
| 3 | 0.948 | 2.11 (-14, 14) | 560 (207-912) | |
| 3.5 | 0.978 | -0.43 (-9, 9) | 36 (153-579) | |
| 4 | 0.984 | -1.22 (-7, 7) | 244 (61-428) | |
| 5 | 0.976 | 0.38 (-9, 9) | 395 (136-655) | |
| 6 | 0.978 | 1.46 (-9, 9) | 368 (103-635) | |
| 8 | 0.983 | -3.59 (-8, 8) | 278 (87-468) | |
| 24 | 0.903 | -4.02 (-19, 19) | 1644 (904-2383) | |
| 3.47 h (3.11-3.82) | ||||
| Optimal sampling time, h | 4 | 5 | 3.5 | 3.5 |
CI, confidence interval; MRT, mean residence time.
Median prediction error: median value of the sum of individual prediction errors (AUCpred - AUC0-∞).
Mean squared prediction error: mean value of the sum of individual squared prediction errors.
Mean residence time: average of individual subjects' MRTs obtained prior to Ginkgo biloba extract administration.
Table II.
Evaluation of Single Midazolam Samples for Predicting Midazolam AUC After the Administration of a CYP3A-Inducing Agent for 4 Weeks (Phase 2)
| Time, h | r2 | Median Prediction Error (Residual)a (90% CI) | Mean Squared Prediction Errorb (90% CI) | MRT Phase 1c |
|---|---|---|---|---|
| .5 | 0.682 | -14.97 (-26, 26) | 3164 (971-7299) | |
| 1 | 0.905 | -6.96 (-14, 14) | 946 (362-1531) | |
| 1.5 | 0.982 | -1.08 (-6, 6) | 176 (39-312) | |
| 2 | 0.985 | -4.21 (-6, 6) | 145 (30-261) | |
| 2.5 | 0.984 | 0.3 (-6, 6) | 154 (66-242) | |
| 3 | 0.899 | 2.1 (-14, 14) | 1003 (74-1932) | |
| 3.5 | 0.956 | 1.75 (-9, 9) | 431 (19-842) | |
| 4 | 0.964 | -1.09 (-9, 9) | 359 (105-613) | |
| 5 | 0.971 | -2.35 (-8, 8) | 288 (106-469) | |
| 6 | 0.976 | 1.98 (-7, 7) | 234 (107-360) | |
| 8 | 0.985 | 0.37 (-6, 6) | 148 (73-222) | |
| 24 | 0.956 | -4.62 (-10, 10) | 435 (264-606) | |
| 3.11 h (2.72-3.51) | ||||
| Optimal sampling time(s), h | 2, 8 | 2.5 | 2 | 3 |
CI, confidence interval; MRT, mean residence time.
Median prediction error: median value of the sum of individual prediction errors (AUC pred - AUC0-∞).
Mean squared prediction error: mean value of the sum of individual squared prediction errors.
Mean residence time: average of individual subjects' MRTs obtained after Ginkgo biloba extract administration for 4 weeks.
Figure 2.
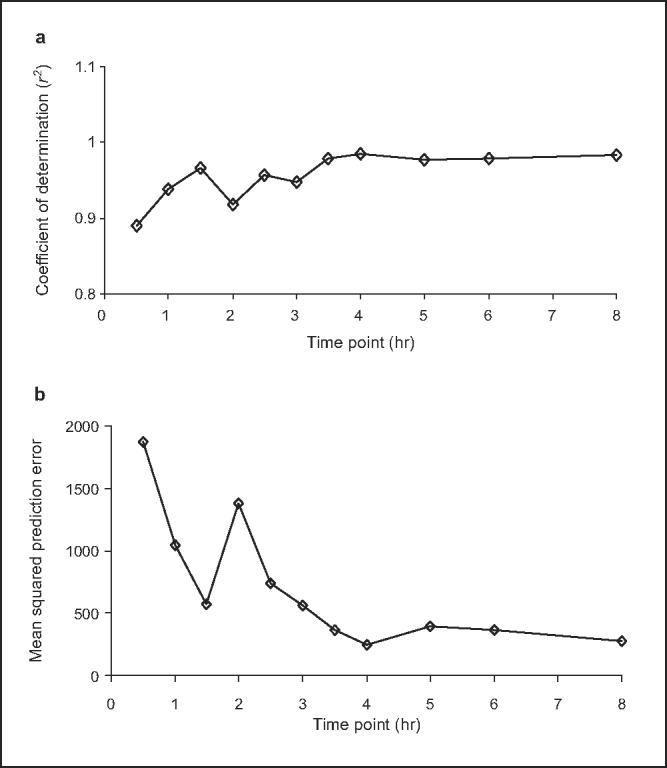
(a) Coefficient of determination (r2) for individual midazolam sampling points and (b) mean squared prediction error (MSPE) for individual midazolam sampling points prior to Ginkgo biloba extract administration. Comparison of area under the concentration-time curve from time 0 to infinity (AUC0-∞) and single plasma concentrations for midazolam (0.5-8 hours postdose) when given prior to Ginkgo biloba extract administration. Correlations were determined by regression analysis between individual midazolam concentrations and midazolam AUC0-∞. Results are shown for prediction performance, assessed using coefficient of determination (r2) of (a) unweighted regression and (b) MSPE. Optimal sampling time, defined by the best predictive performance, occurs at the maximum r2 and lowest MSPE.
Figure 3.
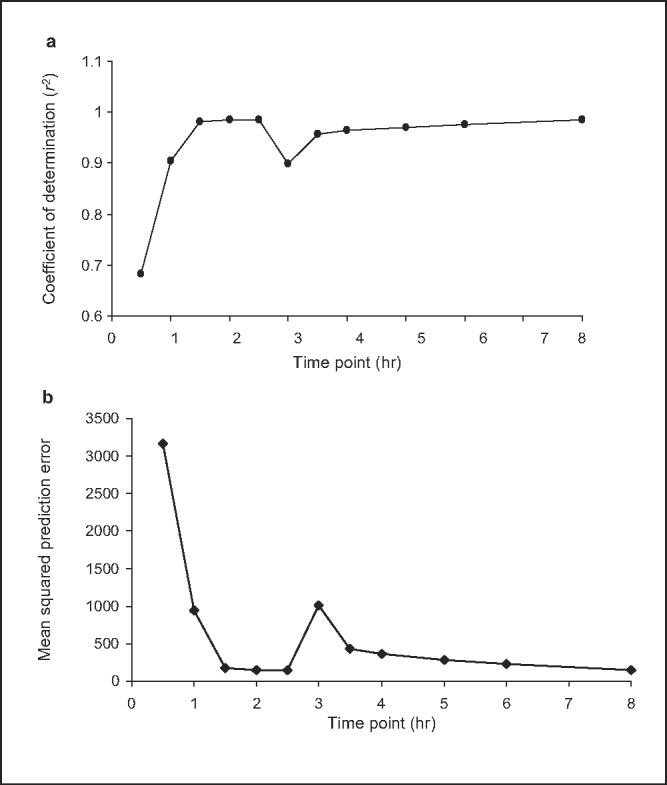
(a) Coefficient of determination (r2) for individual midazolam sampling points and (b) mean squared prediction error (MSPE) for individual midazolam sampling points after 4 weeks of Ginkgo biloba extract administration. Comparison of area under the concentration-time curve from time 0 to infinity (AUC0-∞) and single plasma concentrations for midazolam (0.5-8 hours postdose) when given after 4 weeks of Ginkgo biloba extract administration. Correlations were determined by regression analysis between individual midazolam concentrations and midazolam AUC0-∞. Results are shown for prediction performance, assessed using coefficient of determination (r2) of (a) unweighted regression and (b) MSPE. Optimal sampling time, defined by the best predictive performance, occurs at the maximum r2 and lowest MSPE.
Midazolam samples collected between 2 and 5 hours were further assessed for their ability to accurately predict the statistically significant difference in midazolam AUC0-∞ that was observed between study phases. These time points were chosen based on evaluation of their predictive performances as described earlier and shown in Tables I and II. All samples between 2 and 5 hours showed a reduction in midazolam concentration between the study groups; GMRs ranged between 0.54 and 0.75. The 3.5-hour sample yielded a GMR of 0.66, which is the exact GMR observed for AUC0-∞ between the study groups; however, 90% CIs were wider in the single-point analysis (0.34-0.98 for the 3.5-hour sample vs 0.49-0.84 for AUC0-∞) (Table III). None of the pre- versus postmidazolam samples differed significantly when tested using ANOVA; P values ranged between 0.12 and 0.50 for respective comparisons at sampling points 2, 2.5, 3, 3.5, 4, and 5 hours (data not shown). Individual (uncorrected) t tests were also performed on the same single midazolam time points to simulate whether a significant difference (P < .05) would have been reported for any single midazolam time point had it been the sole sample collected. None of these single midazolam concentrations differed significantly between pre- and post-GBE administration (P > .05) (data not shown).
Table III.
Assessment of Single Midazolam Samples for Predicting Changes in Midazolam AUC0-∞ After CYP3A Modulation via Ginkgo biloba Extract
| Midazolam Concentration Ratio |
|||||||
|---|---|---|---|---|---|---|---|
| AUC0-∞ Ratioa | 2 h | 2.5 h | 3 h | 3.5 h | 4 h | 5 h | |
| GMR (90% CI) | 0.66 (0.49-0.84) | 0.54 (0.31-0.77) | 0.54 (0.41-0.99) | 0.72 (0.24-1.27) | 0.66 (0.36-1.08) | 0.70 (0.35-1.05) | 0.75 (0.24-1.27) |
GMR, geometric mean ratio; CI, confidence interval.
AUC0-∞, area under the concentration-time curve from 0 hours to infinity.
DISCUSSION
The purpose of this investigation was to determine whether a single postdose midazolam concentration could predict midazolam AUC in the presence and absence of a CYP3A-modulating compound. Based on the collective interpretation of predictive performance measurements, single midazolam concentrations at 3.5, 4, and 5 hours were able to predict oral midazolam AUC0-∞ in the absence of CYP3A modulation (Table I). After CYP3A modulation via 4 weeks of GBE administration, single midazolam concentrations at 2, 2.5, and 3 hours were found to associate best with oral midazolam AUC0-∞. Of note, none of these single concentration times overlapped between the 2 study phases (Tables I and II). The difference in optimal sampling times between groups is likely due to different levels of CYP3A activity in the control versus the CYP modulation group. Indeed, a previous investigation reported shorter optimal sampling times under conditions of increased CYP3A activity versus control.8 Therefore, because optimal sampling times differ based on degree of CYP3A activity, it is unrealistic to expect a single midazolam concentration to consistently predict midazolam AUC throughout various degrees of CYP3A modulation, which may be seen in drug-drug interaction studies.
Single midazolam concentrations were also assessed for their ability to predict the statistically significant reduction in midazolam AUC that we observed after GBE dosing (Table III). Six single midazolam samples, ranging from 2 to 5 hours, correctly predicted a reduction in midazolam AUC after GBE exposure. At these time points, respective decreases in single midazolam concentrations were similar in magnitude to the reduction in midazolam AUC between the study phases (Table III). However, the 90% confidence limit included 1.0 at the 3-, 4-, and 5-hour time points, thereby suggesting that midazolam concentrations at these times cannot be relied on to consistently detect significant changes in midazolam AUC that occur with CYP3A modulation.
Conversely, the 2-hour sampling point predicted a 46% reduction in midazolam AUC (actual reduction = 34%) between the study phases; this time point also had the narrowest confidence interval (-23% to -69%). However, in terms of predictive performance, only MSE and r2 after GBE dosing identified 2 hours as the optimal sampling point (ie, 2 of 6 measures of predictive performance). Considering that such predictive measures are not available prior to initiating drug interaction studies, as well as the fact that optimal sampling time is altered during CYP3A modulation, it is unlikely that the 2-hour time point (or any single time point, for that matter) would have been identified a priori as the optimal time for midazolam sample collection. Perhaps most important, if we had simply collected a single postdose midazolam concentration to phenotype CYP3A, we would have erroneously concluded the absence of an interaction between GBE and midazolam because individual t tests on midazolam time points, before versus after GBE administration, yielded values >.05.
To achieve maximum validity, several methods were used to determine optimal midazolam sampling times. Linear regression analysis, though widely used, is negatively influenced by nonnormally distributed data. Fortunately, this was not an issue in the current study as midazolam data from all subjects passed a normality test; as such, unweighted regression was used in the data analysis.
In addition to linear regression, we also assessed MPE and MSE, as these methods impute a quantitative approximation of error. In addition, MPE (residual) values were plotted for each time point as a graphical representation of bias (Figure 4). Mean residence time, which has been used in a number of studies to select optimal sampling times, was compared with the optimal sampling times predicted by MPE, ME, and r2; both pre- and post-GBE MRTs were similar to the optimal sampling times suggested by these predictors. Furthermore, a reduction in MRT was observed after GBE administration, which is consistent with the reduced sampling times predicted by ME and MPE after GBE administration. However, the difference in MRT between the 2 study phases did not reach statistical significance (data not shown); this is likely due to variability in midazolam disposition resulting from intersubject heterogeneity in intestinal and hepatic CYP3A activity.
Figure 4.
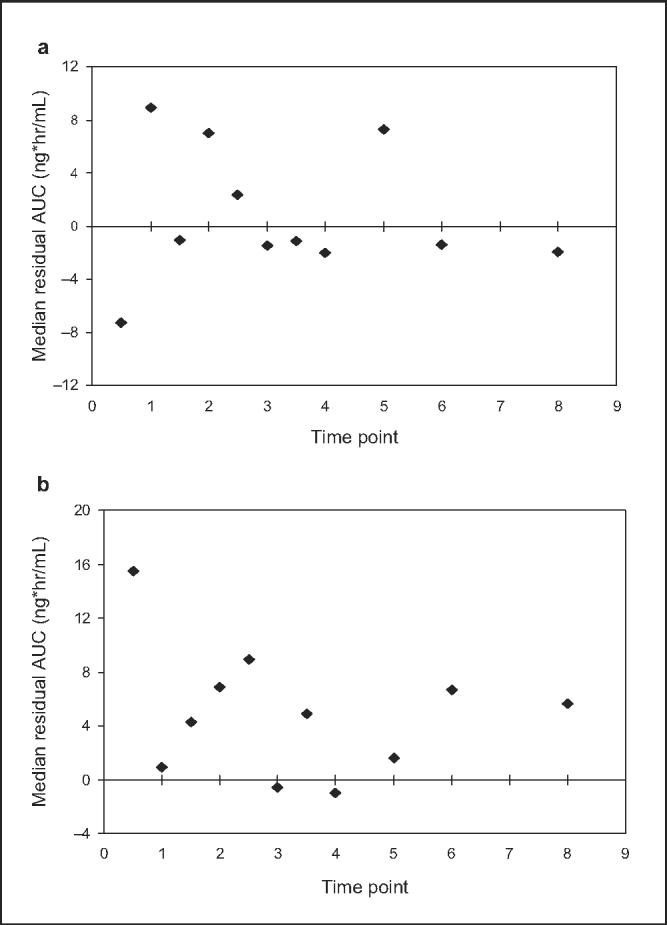
Median residual concentrations for each midazolam sampling point (a) prior to and (b) after 2 weeks administration of Ginkgo biloba extract.
Previous investigations also assessed the usefulness of single-point midazolam sampling to predict midazolam AUC.6-10 In a retrospective study, 224 healthy volunteers received oral or intravenous midazolam, with some subjects receiving CYP3A-inducing or CYP3A-inhibiting medications.6 Mean residence time was used to select a single midazolam time point, which was then examined for its association with midazolam AUC using r2 as the sole predictor. A significant correlation was observed between the 4-hour oral midazolam serum concentration and midazolam AUC (r2 = 0.91, P < .001). The authors concluded that the 4-hour midazolam concentration yielded a reliable estimate of CYP3A activity under constitutive, induced, and inhibited activity for both intravenous and oral midazolam. Of note, in our study, we observed r2 values >0.91 in 10 of 12 midazolam samples collected pre-GBE and 9 of 12 samples collected post-GBE, suggesting that r2, in the absence of other predictors, cannot be relied on to consistently identify a single optimal midazolam sampling point.
Using data from 2 previous healthy volunteer studies, Chaobal and Kharasch8 tested the ability of a single midazolam concentration to predict midazolam exposure. Using linear regression, the investigators used MRT, r2, median weighted prediction error (MWPE), and minimum Akaike's information criterion (MAICE) to identify an optimal midazolam sampling time at 5 hours. However, similar to our findings, optimal sampling times were markedly different under conditions of CYP3A modulation. Indeed, optimal midazolam sampling times for subjects who received (1) no concurrent medications, (2) the CYP3A inducer rifampin, or (3) the CYP3A inhibitor troleandomycin were 5, 1 to 1.5, and 13 hours, respectively.
In addition to studying oral midazolam, Chaobal and Kharasch8 also assessed optimal sampling times after intravenous midazolam administration. When midazolam was administered intravenously, optimal sampling times were predicted at 3, 5, and 3 hours by r2, MWPE, and MAICE, respectively. Conversely, all 3 of these predictors identified an optimal sampling time of 5 hours after oral midazolam administration. This observation is consistent with the reported differences in MRT observed between oral and intravenous midazolam, which were 3.9 hours and 2.8 hours, respectively. Collectively, these data suggest that the route of midazolam administration is yet another variable that can affect the optimal time at which to sample midazolam concentrations. This is noteworthy because it contradicts a previous report, which identified similar MRTs for oral and intravenous midazolam and concluded that a 4-hour sampling point was optimal for predicting midazolam AUC for both routes of administration.
Two additional investigations assessed the ability of single midazolam concentrations to predict midazolam AUC.7,10 In a study of 8 elderly volunteers, a significant correlation was observed between a single 6-hour postdose midazolam concentration and midazolam AUC following a single oral midazolam dose of 5 mg (r2 = 0.99, P < .009).7 The MRT reported in this group of elderly subjects was 5.5 hours. Additional predictors were not evaluated. Another group also investigated a limited sampling strategy to determine the minimum number of serum samples needed to accurately predict midazolam AUC following a single 1-mg intravenous dose.10 A significant correlation between midazolam AUC and the 5-hour concentration was reported (r2 = 0.87). Of note, this r2 value was less than those reported in other studies; it was also less than all 12 r2 values for each of the single midazolam concentrations collected prior to GBE dosing in our study. Neither of the above studies reported additional measures of prediction potential or studied subjects under conditions of CYP3A modulation.
Midazolam possesses a number of characteristics that make it a useful in vivo probe for CYP3A activity. The hepatic extraction ratio of midazolam is approximately 0.34; therefore, it is not typically subject to changes in clearance resulting from alterations in hepatic blood flow.11 Midazolam is also available in oral and intravenous formulations, which makes it a useful tool to assess the respective activities of intestinal versus hepatic CYP3A. However, single midazolam samples (with or without 1′-hydroxy-midazolam concentrations) have not been shown to consistently predict CYP3A activity, although this issue is a matter of debate.12,13 Current data strongly suggest that serial sample collection and determination of midazolam AUC is a superior approach to CYP3A phenotyping compared with single-concentration sampling.
Data from ourselves and others show that single midazolam samples, identified post hoc, are often closely associated with midazolam AUC.6-8,10 However, identifying an optimal midazolam sampling time a priori is confounded by several variables. Each of the following can affect the optimal time predicted for midazolam sampling: intersubject heterogeneity in CYP3A activity, CYP3A modulation by concomitant medications, route of midazolam administration (oral vs intravenous), and possibly food consumption with oral midazolam.14,15 In addition, a single-sequence study design, such as that employed in the current investigation, could theoretically affect midazolam concentration measurements; however, we believe the chances of this occurring are minimal given that midazolam has not been shown to affect CYP3A expression or activity. Because of these limitations, determination of midazolam AUC is expected to provide a more accurate assessment of CYP3A activity compared with single-sample collection. Ensuring optimum accuracy is crucial when studying CYP3A-mediated drug-drug interactions of potential clinical significance. Although failing to detect a mild-moderate drug interaction (ie, 30%-50% reduction in exposure) may not seem clinically relevant, it may in fact be important for medications with narrow therapeutic indices. As such, it is important that interactions of this magnitude not go undetected due to limitations in study methodology. To this end, any increase in convenience offered by single sample collection would appear to be outweighed by the more accurate approach of using midazolam AUC to assess CYP3A activity.
Acknowledgments
Financial disclosure: Support came from the National Institutes of Health (NIH) Clinical Center Pharmacy Department and the National Institute of Allergy and Infectious Diseases (NIAID).
REFERENCES
- 1.Kashuba A, Bertino J. Mechanisms of drug interactions I. In: Piscitelli SC, Rodvold KA, editors. Drug Interactions in Infectious Diseases. 2nd ed. Humana; Totowa, NJ: 2005. pp. 13–39. [Google Scholar]
- 2.Streetman DS, Bertino JS, Nafziger AN. Phenotyping of drug-metabolizing enzymes in adults: a review of in-vivo cytochrome P450 phenotyping probes. Pharmacogenetics. 2000;10:187–216. doi: 10.1097/00008571-200004000-00001. [DOI] [PubMed] [Google Scholar]
- 3.Rogers JF, Nafziger AN, Kashuba AD, et al. Single plasma concentrations of 1′-hydroxymidazolam or the ratio of 1′-hydroxymidazolam:midazolam do not predict midazolam clearance in healthy subjects. J Clin Pharmacol. 2002;42:1079–1082. doi: 10.1177/009127002401382614. [DOI] [PubMed] [Google Scholar]
- 4.Eap CB, Buclin T, Cucchia G, et al. Oral administration of a low dose of midazolam (75 microg) as an in vivo probe for CYP3A activity. Eur J Clin Pharmacol. 2004;60:237–246. doi: 10.1007/s00228-004-0762-z. [DOI] [PubMed] [Google Scholar]
- 5.American Herbal Pharmacopoeia Analytical Methods Review SOP. Available at: http://www.herbal-ahp.org/method_commit.htm. Accessed May 23, 2007.
- 6.Lin YS, Lockwood GF, Graham MA, et al. In-vivo phenotyping for CYP3A by a single-point determination of midazolam plasma concentration. Pharmacogenetics. 2001;11:781–791. doi: 10.1097/00008571-200112000-00006. [DOI] [PubMed] [Google Scholar]
- 7.Krupka E, Venisse N, Lafay C, et al. Probe of CYP3A by a single-point blood measurement after oral administration of midazolam in healthy elderly volunteers. Eur J Clin Pharmacol. 2006;62:653–659. doi: 10.1007/s00228-006-0159-2. [DOI] [PubMed] [Google Scholar]
- 8.Chaobal HN, Kharasch ED. Single-point sampling for assessment of constitutive, induced, and inhibited cytochrome P450 3A activity with alfentanil or midazolam. Clin Pharmacol Ther. 2005;78:529–539. doi: 10.1016/j.clpt.2005.08.004. [DOI] [PubMed] [Google Scholar]
- 9.Sheiner LB, Beal SL. Some suggestions for measuring predictive performance. J Pharmacokinet Biopharm. 1981;9:503–512. doi: 10.1007/BF01060893. [DOI] [PubMed] [Google Scholar]
- 10.Kim JS, Nafziger AN, Tsunoda SM, et al. Limited sampling strategy to predict AUC of the CYP3A phenotyping probe midazolam in adults: application to various assay techniques. J Clin Pharmacol. 2002;42:376–382. [PubMed] [Google Scholar]
- 11.Allonen H, Ziegler G, Klotz U. Midazolam kinetics. Clin Pharmacol Ther. 1981;30:653–661. doi: 10.1038/clpt.1981.217. [DOI] [PubMed] [Google Scholar]
- 12.Nafziger AN, Bertino JS., Jr Low hepatic cytochrome P450 3A activity is a risk for corticosteroid-induced osteonecrosis. Clin Pharmacol Ther. 2007;82:379. doi: 10.1038/sj.clpt.6100105. [DOI] [PubMed] [Google Scholar]
- 13.Kaneshiro Y, Oda Y. Response to Nafziger and Bertino. Clin Pharmacol Ther. 2007;82:380. doi: 10.1038/sj.clpt.6100105. [DOI] [PubMed] [Google Scholar]
- 14.Versed (midazolam HCl syrup) [product information] Roche Pharmaceuticals; Nutley, NJ: 1998. [Google Scholar]
- 15.Bornemann LD, Crews T, Chen SS, et al. Influence of food on midazolam absorption. J Clin Pharmacol. 1986;26:55–59. doi: 10.1002/j.1552-4604.1986.tb02903.x. [DOI] [PubMed] [Google Scholar]