

Abstract
BACKGROUND
African Americans have higher cancer mortality rates than whites. Understanding the relative contribution of cancer incidence, stage at diagnosis and survival after diagnosis to the racial gap in life expectancy has important implications for directing future health disparity interventions toward cancer prevention, screening and treatment.
OBJECTIVE
We estimated the degree to which higher cancer mortality among African Americans is due to higher incidence rates, later stage at diagnosis or worse survival after diagnosis.
DESIGN
Stochastic model of cancer incidence and survival after diagnosis.
PATIENTS
Surveillance and Epidemiology End Result cancer registry and National Health Interview Survey data.
MEASUREMENTS
Life expectancy if African Americans had the same cancer incidence, stage and survival after diagnosis as white adults.
RESULTS
African-American men and women live 1.47 and 0.91 fewer years, respectively, than whites as the result of all cancers combined. Among men, racial differences in cancer incidence, stage at diagnosis and survival after diagnosis account for 1.12 (95% CI: 0.52 to 1.36), 0.17 (95% CI: −0.03 to 0.33) and 0.21 (95% CI: 0.05 to 0.34) years of the racial gap in life expectancy, respectively. Among women, incidence, stage and survival after diagnosis account for 0.41 (95% CI: −0.29 to 0.60), 0.26 (95% CI: −0.06 to 0.40) and 0.31 (95% CI: 0.05 to 0.40) years, respectively. Differences in stage had a smaller impact on the life expectancy gap compared with the impact of incidence. Differences in cancer survival after diagnosis had a significant impact for only two cancers—breast (0.14 years; 95% CI: 0.05 to 0.16) and prostate (0.05 years; 95% CI 0.01 to 0.09).
CONCLUSIONS
In addition to breast and colorectal cancer screening, national efforts to reduce disparities in life expectancy should also target cancer prevention, perhaps through smoking cessation, and differences in survival after diagnosis among persons with breast and prostate cancer.
KEY WORDS: racial differences, cancer mortality, survival, life expectancy
INTRODUCTION
African Americans have higher mortality rates than whites from a variety of cancers, including colon, breast, uterine, cervical, lung and prostate cancer.1–7 These differences occur because African Americans have higher incidence rates, present at a later stage and have worse survival after diagnosis.8–10 Previous studies have not examined how cancer incidence, stage and survival after diagnosis influence mortality on a common metric, such as life expectancy, nor have they quantified the degree to which racial differences in life expectancy are due to racial differences in cancer incidence, stage or survival after diagnosis.
Greater emphasis is now being placed on finding ways to reduce disparities in health outcomes rather than merely documenting their existence.11 The recent National Healthcare Disparities Report has focused on disparities in incidence, screening and mortality rates for breast and colorectal cancer and has specifically targeted mammography and colonoscopy use.12,13 As we move toward developing and implementing interventions, however, understanding the absolute and relative impact that disparities in cancer incidence, stage at presentation and survival after diagnosis have on the racial gap in life expectancy could help to identify other key targets for interventions, including whether we should also focus on other cancers, on primary prevention or on disparities in cancer treatment. Therefore, in this study, we analyzed data from the Surveillance and Epidemiology End Result (SEER) cancer registry and the National Health Interview Survey (NHIS) to estimate the contribution of racial differences in cancer incidence, stage at diagnosis and survival after diagnosis to the racial difference in life expectancy.
METHODS
Overview
We used the Racial Disparities Simulation Model to simulate cause-specific mortality events for a cohort of non-Hispanic African American and white adults (described elsewhere in greater detail14,15). This model uses mortality risks estimated from NHIS and linked vital statistics death data. We extended this model by simulating cancer incidence and fatality, the risks of which were estimated from SEER data. This study was granted exemption from IRB review.
Data
NHIS is an annual cross-sectional study of non-institutionalized persons in the US. Data collected between 1986 and 1994 are linked to vital statistics data through 2001.16,17 We analyzed the 2003 public-use release version of SEER, which is a population-based cancer registry of clinical, treatment and outcome data, from 12 geographic regions around the US— the 9 SEER sites [San Francisco/Oakland, Connecticut, Detroit, Hawaii, Iowa, New Mexico, Seattle (Puget Sound), Utah and Atlanta] plus Alaska, San Jose-Monterey and Los Angeles.18,19 We analyzed information on race, sex, age at diagnosis, type of cancer, stage of diagnosis and cause of death among 2,711,710 white and 291,126 African-American patients with a primary or subsequent cancer, not including metastatic sites of cancer, occurring between 1992 and 2000.
Risk Estimates
Using SEER data and concurrent census estimates of population at risk provided by SEER,19 we estimated age (1-year intervals), race (non-Hispanic African American vs. non-Hispanic white) and sex-specific cancer incidence risk by cancer type and stage by calculating incidence density rates.20 We used locally linear regression (Loess procedure in SAS) to smooth these risk estimates across 1-year age intervals.21
We used parametric survival methods to estimate the annual cancer mortality risk from time of diagnosis. For each cancer and stage, we chose a specific parametric distribution based on comparison of parametric and non-parametric hazard plots. In instances when the survival data did not fit any standard distributions, we used piecewise exponential methods.22 We estimated cancer fatality risk for each cancer type and stage as a function of age at diagnosis (10-year intervals), race, sex and all two-way interactions between race and other covariates.
To estimate the annual mortality risks from non-cancer causes, we used similar parametric methods as above using NHIS data linked to vital statistics. We estimated these risks separately for non-cancer causes of death (cardiovascular disease, trauma/accidents and other causes), and for each sex and race strata, and weighted to account for the complex sampling methods.23
Simulation Model and Estimation of Years of Life Expectancy
We used a state-transition Markov model to simulate cancer incidence and death for a cohort of 500,000 persons in each of the four race/sex strata. This cohort size was based on the minimum necessary to reduce the error of the main outcome measure (racial difference in life expectancy) due to randomness in the stochastic model to less than 1%. Each person entered the simulation at age 18. In each 1-year cycle, persons could either be diagnosed with one or more specific cancers at a particular stage at diagnosis, die from a non-cancer cause, die from a specific cancer (assuming they had already been diagnosed with the specific cancer) or live until the next year. Persons were eligible to die from a specific cancer starting with the same year of diagnosis. The process was repeated until the person died.
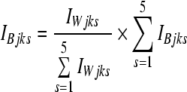
From the simulated cohort, we then estimated the average life expectancy for each race/sex stratum. The base case estimates used the original risk estimates of cancer incidence, stage and survival after cancer diagnosis for African Americans and whites. We then conducted the simulation under three alternative scenarios to estimate the contribution of racial differences in cancer incidence, stage at diagnosis and survival after diagnosis to racial differences in life expectancy. In scenario 1, to estimate the impact of incidence, we multiplied each incidence risk among African Americans, IBjks, by the following weight:
 |
where IWjks and IBjks are the incidence risks for cancer j, at age k, and stage s (note: s includes stages 1–4 and unknown stage at diagnosis) among whites and African Americans, respectively. This adjustment ensures that, for a given cancer and age, equal numbers of African Americans and whites get cancer, but allows African Americans and whites to have different proportions diagnosed at each stage. In scenario 2, to estimate the impact of stage at diagnosis, the numbers of African Americans and whites diagnosed with cancer j at age k remain the same as the base case, but instead we set the proportion of persons diagnosed at each stage for African Americans to be the same as that among whites. Thus,
 |
In scenario 3, to estimate the impact of cancer survival following diagnosis, the fatality risks (F) for persons with a particular cancer j at age k and stage at diagnosis s were set to be the same for African Americans and whites.
 |
We conducted an additional scenario in which we set the site-specific cancer mortality risks for African Americans to be the same as that among whites in order to examine the total impact of a particular cancer on racial differences in life expectancy. By comparing scenarios 1, 2 and 3 to the base case simulation, we estimated the respective impact of disease incidence, stage and survival after diagnosis on the racial difference in life expectancy.
To estimate standard errors, we used a simulation method approach in which we randomly drew 1,000 sets of parameter estimates, β, from each of the survival analyses.24 Each set of parameters was drawn using the variance-covariance matrix of the survival models under the assumption that the estimated β’s have a multivariate normal sampling distribution. Thus, each draw captures the uncertainty around β. For each set of parameters, we ran the simulation and estimated life expectancy, yielding 1,000 life expectancy estimates. We then calculated confidence intervals and p-values using the percentile method. We used C++ to create the simulation model and SAS version 9.13 (Cary, NC) and STATA 8.0 (College Station, TX) to calculate all risk estimates and 95% confidence intervals.
Simulation Model Validation
We checked the face and external validity of our results. To validate our model, we compared mortality rate estimates, age-standardized to the U.S. population in 2000,25 derived from our simulation cohort and from National Vital Statistics Reports.26–28 We also compared estimates from our simulation model with previously reported estimates of years of potential life lost due to cancer derived from NHIS data.14,29 For this comparison, we analyzed our simulated cohort data to calculate years of potential life lost before age 75 per 1,000 persons using the same formula:  , where n is the number of persons at risk for death.
RESULTS
Impact of Cancer Mortality on Racial Differences in Years of Life Expectancy
Based on the simulation model, the average life expectancy at birth is 76.61 years for white men and 71.90 years for black men—a difference of 4.71 (95% CI: 4.59 to 4.76) years per person. When mortality risk for all cancers combined is the same for African Americans and whites, the racial difference in average life expectancy decreases by 1.47 years (95% CI: 0.83 to 1.74) from 4.71 to 3.24 years (Table 1). (Note: the remaining 3.24 years difference in life expectancy between African Americans and whites is due to racial differences in non-cancer deaths.) If African-American men had the same lung cancer mortality risk as white men, the racial difference in life expectancy would drop 0.48 (95% CI: 0.42 to 0.55) years. This impact is the largest among the specific types of cancer, followed by prostate (0.28 years, 95% CI: 0.19 to 0.32), esophageal (0.14 years, 95% CI: 0.08 to 0.18), head and neck (0.14 years, 95% CI: 0.08 to 0.19) and colorectal cancer (0.11 years, 95% CI: 0.01 to 0.14) (Table 1).
Table 1.
White-African-American Difference in Years of Life Expectancy at Birth, Stratified by Sex
| Men | Women | |
|---|---|---|
| All causes of death | 4.71 (4.59 to 4.76) | 8.18 (8.10 to 8.26) |
| Attributable* to cancer of the: | ||
| Lung | 0.48 (0.42 to 0.55) | 0.08 (0.01 to 0.12) |
| Breast | – | 0.15 (0.06 to 0.17) |
| Colon/rectum | 0.11 (0.01 to 0.14) | 0.12 (0.04 to 0.16) |
| Liver | 0.07 (0.03 to 0.11) | 0.04 (−0.01 to 0.07) |
| Pancreas | 0.06 (0.02 to 0.12) | 0.09 (0.04 to 0.15) |
| Esophagus | 0.14 (0.08 to 0.18) | 0.05 (0.01 to 0.09) |
| Stomach | 0.10 (0.03 to 0.14) | 0.09 (0.01 to 0.13) |
| Uterine/ovary | – | 0.01 (−0.09 to 0.04) |
| Cervix | – | 0.09 (0.01 to 0.13) |
| Prostate | 0.28 (0.19 to 0.32) | – |
| Bladder or kidney | 0.02 (−0.05 to 0.06) | 0.06 (−0.03 to 0.08) |
| Leukemia or lymphoma | 0.03 (−0.04 to 0.07) | 0.02 (−0.03 to 0.06) |
| Head and neck | 0.14 (0.08 to 0.19) | 0.06 (−0.01 to 0.08) |
| Brain | −0.03 (−0.06 to 0.005) | −0.02 (−0.05 to 0.01) |
| Thyroid | 0.06 (−0.02 to 0.07) | 0.01 (−0.04 to 0.05) |
| Melanoma of the skin | −0.04 (−0.10 to 0.005) | −0.01 (−0.08 to 0.04) |
| Other non-epithelial skin | 0.01 (−0.03 to 0.03) | 0.01 (−0.03 to 0.03) |
| Other cancers | 0.03 (−0.03 to 0.07) | 0.07 (0.002 to 0.10) |
| All cancers combined | 1.47 (0.83 to 1.74) | 0.91 (0.10 to 1.13) |
*White-African American difference in life expectancy attributable to specific cancers is estimated by setting the cancer-specific mortality rate for African Americans to be the same as that among whites. Negative numbers indicate that higher mortality rates exist among whites compared to African Americans and that specific cancer accounts for a decrease in the white-African American difference in life expectancy. Positive numbers indicate lower mortality rates among African Americans compared to whites and that specific cancer accounts for an increase in the white-African American difference in life expectancy.
Among women, the estimated average life expectancy is 81.74 years for whites and 73.55 years for African Americans, a difference of 8.18 (95% CI: 8.10 to 8.26) years per person. All cancers combined account for 0.91 (95% CI: 0.10 to 1.13) years of the life expectancy gap between African American and white women. Among the specific types of cancer, breast cancer has the biggest impact on the racial difference in life expectancy, accounting for 0.15 years (95% CI: 0.06 to 0.17). Colon cancer accounts for 0.12 years, while cervical, pancreas and stomach cancer each account for 0.09 years.
Contribution of Cancer Incidence, Stage and Survival After Diagnosis on Racial Difference in Years of Life Expectancy
For all cancers combined, we estimated that, among men, racial differences in cancer incidence account for 1.12 (95% CI: 0.52 to 1.36) years of the total 1.47 years racial difference in average life expectancy due to cancer. In contrast, stage accounts for 0.17 (95% CI: −0.03 to 0.33) years, and survival after diagnosis accounts for 0.21 (95% CI: 0.05 to 0.34) years. Thus, among men, the racial difference in life expectancy due to all cancers combined is mainly due to higher incidence risk among African Americans than whites as opposed to later stage of presentation or worse survival after diagnosis.
A similar pattern was found among men for specific types of cancer (Fig. 1). The racial difference in lung cancer incidence accounts for 0.47 (95% CI: 0.39 to 0.53) years of the racial difference in average life expectancy compared with 0.004 (95% CI: −0.03 to 0.03) years due to stage at diagnosis and 0.03 (95% CI: −0.02 to 0.05) years due to survival after diagnosis. For prostate cancer, incidence, stage and survival after diagnosis accounts for 0.21 (95% CI: 0.13 to 0.26), 0.04 (95% CI: −0.001 to 0.09), and 0.05 (95% CI: 0.01 to 0.09) years, respectively. Melanoma incidence accounts for −0.12 (95% CI: −0.07 to −0.18) years of the white-African American difference in life expectancy, reflecting the fact that incidence of melanoma is higher among whites than African Americans.
Figure 1.
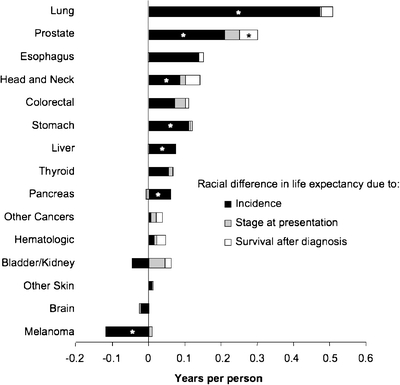
Racial difference (white-African American) in years of life expectancy (LE) among men attributable to racial differences in cancer incidence, stage at presentation and survival after cancer diagnosis. *p < 0.05, testing the null hypothesis that the change of life expectancy difference is zero. Negative numbers indicate that higher incidence rates, fatality rates or later stage at diagnosis occurs among whites compared to African Americans and thus accounts for a decrease in the white-African American difference in life expectancy. Positive numbers indicate that higher incidence rates, fatality rates or later stage at diagnosis occurs among African Americans compared to whites and thus accounts for an increase in the white-African American difference in life expectancy.
The contribution of incidence relative to the contribution of stage and survival after diagnosis is smaller among women than among men. Among women, the racial difference in incidence for all cancers combined accounts for 0.41 (95% CI: −0.29 to 0.60) years of the racial difference in life expectancy compared to 0.26 (95% CI: −0.06 to 0.40) years due to stage and 0.31 (95% CI: 0.05 to 0.40) years due to survival after diagnosis.
For women, incidence primarily accounts for the racial differences in life expectancy due to cancer for most of the specific types of cancer. (Fig. 2) However, breast cancer is one exception to this pattern, for which survival accounts for more of the racial gap in life expectancy (0.14 years) compared to incidence (−0.063 years) or stage at diagnosis (0.085 years). For cervical and colorectal cancer among women, incidence still accounts for most of the racial difference in life expectancy. However, stage at diagnosis has a larger relative impact as compared to the pattern seen with other cancers. Uterine/ovarian cancer incidence is higher among white women than African American women and thus contributes −0.05 (95% CI: −0.16 to −0.04) years.
Figure 2.
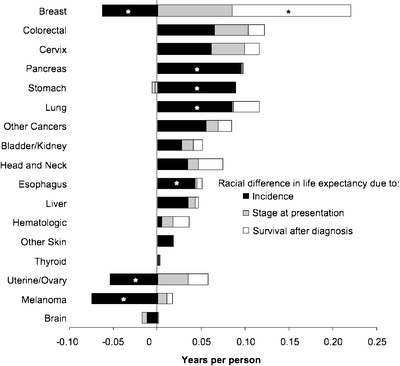
Racial difference (white-African American) in years of life expectancy (LE) among women attributable to racial differences in cancer incidence, stage at presentation and survival after cancer diagnosis. *p < 0.05, testing the null hypothesis that the change of life expectancy difference is zero. Negative numbers indicate that higher incidence rates, fatality rates or later stage at diagnosis occurs among whites compared to African Americans and thus accounts for a decrease in the white-African American difference in life expectancy. Positive numbers indicate that higher incidence rates, fatality rates or later stage at diagnosis occurs among African Americans compared to whites and thus accounts for an increase in the white-African American difference in life expectancy.
Validation of Simulation Model
As expected, the impact of stage had a larger impact among cancers with effective screening tests, such as breast, cervical and colorectal cancer, than among other cancers. Consistent with other studies,19 mortality rates were higher among African Americans than whites for almost all cancers except for melanoma. Also, the age-standardized mortality rate for persons 25–74 years old was 745 deaths per 100,000 persons from our simulation, compared with 773, 778 and 797 from vital statistics data in 1999, 1998 and 1997, respectively. We also estimated years of potential life lost from cancer, which were similar to the results of a previous study14 (Fig. 3).
Figure 3.
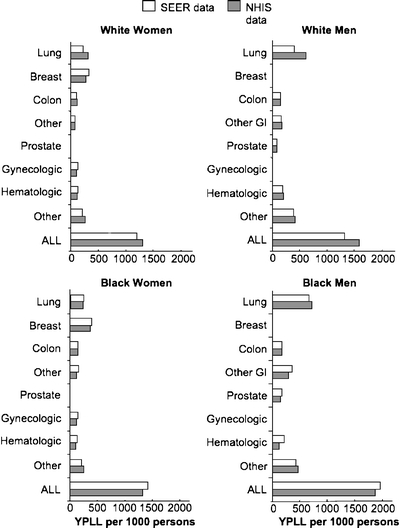
Comparison of SEER and NHIS data on years of potential life lost (YPLL) due to specific cancers and all cancers combined. YPLL = years of potential life lost before age 75 per 1,000 persons, calculated as  , where n is the number of persons at risk for death in the population. Other GI = other gastrointestinal cancers, including esophageal, pancreatic and liver.
DISCUSSION
Previous studies suggest a variety of explanations for racial disparities in cancer mortality. For example, African Americans may have greater exposure to carcinogens, such as tobacco,30,31 and a greater genetic predisposition to getting cancers.32 African Americans also tend to present at a later and less curable stage,33,34 perhaps due to lower screening rates and delays in seeking care for symptoms.34,35 They are also less likely to receive appropriate cancer treatment5,36–42 and have more comorbid conditions.43 Each of these explanations suggests a different target for intervention to eliminate cancer disparities. As researchers, public health officials and policymakers decide which potential interventions to pursue, it would be particularly helpful to understand where along the course of cancer that disparities develop and the contribution of racial differences in cancer incidence, stage at diagnosis and survival after diagnosis to the racial gap in life expectancy.
In the present study, we used simulation modeling to estimate how much of the racial gap in life expectancy would decline if African Americans, compared to whites, had the same incidence rates, stage at presentation and survival after cancer as whites. We found for all cancers combined, and for most specific cancers, that differences in cancer incidence contributed substantially more to the racial difference in cancer mortality than cancer stage or survival after diagnosis, particularly among men. Lung cancer incidence had a particularly large impact among men contributing almost half of a year difference in life expectancy. This is more than the impact of stage and survival after diagnosis for all cancers combined and suggests that smoking cessation might be a particularly effective way to reduce racial disparities in cancer mortality among men. Racial differences in the incidence of other cancers, such as prostate, gastrointestinal and head and neck, also account for a substantial amount of the life expectancy disparity. Although we do not have proven preventive strategies specific for these cancers, smoking cessation is likely to have a significant impact. Furthermore, 5-alpha-reductase inhibitors may reduce prostate cancer risk,44 and thus may be a potential intervention to reduce cancer disparities if future studies confirm that a mortality benefit exists.
The contribution of stage at diagnosis to the racial gap in life expectancy was not statistically significant for any cancer type. Despite this, it is worth noting that the impact of stage was larger for cancers of the breast, colon/rectum and cervix than for other cancers, consistent with what we expected given that effective screening tests exist for these cancers. These results suggest that focusing on better screening for these cancers among African Americans may also be potentially important targets for reducing cancer mortality disparities.
Differences in survival after diagnosis had a statistically significant impact on only two cancers—breast and prostate, accounting for 0.15 and 0.05 years difference in life expectancy, respectively. This may be due to the fact that African Americans are less likely to receive appropriate breast and prostate cancer treatment,33,36,45,46 and may also be due to a greater burden of comorbid illnesses among African Americans, which also worsens survival from cancer.43
Of note, the results of our simulation model have strong face and external validity. Years of potential life lost from specific cancers were remarkably similar between this study and a previously published comparison study, even though the models and the source data were substantially different between these studies.14 The comparison study used cancer-specific mortality rates from NHIS data and simulated persons as they transitioned from being alive directly to death from cancer.14 The current study used cancer-specific incidence and fatality rates based on SEER data and simulated persons as they transitioned from being alive without cancer to having cancer and then to death. Of note, the previous study results were validated using life table methods.14 We found relatively small differences in mortality rates estimated from our study compared to vital statistics results. The small differences may be due to differences in data samples. Specifically, we estimated mortality rates using SEER data, which include only a subset of cancer deaths in the US, and NHIS data, which exclude institutionalized and homeless persons. Vital statistics data include all deaths in the US.
Although our study has implications for cancer prevention, screening and treatment, we did not examine the impact of specific interventions. It is possible, for example, that differences in survival after diagnosis may be due to more aggressive tumors among African Americans.47–50 Similarly, the contribution of differences in lung cancer incidence suggests that the racial difference in tobacco use is important, but tobacco may also have a more deleterious effect among African Americans because they tend to metabolize cigarette carcinogens more slowly than whites.31 The identification and removal of pre-malignant polyps may lead to a lower incidence of colon cancer.51 Thus, racial differences in colonoscopy may have a larger impact on racial differences in colorectal mortality than the amount suggested by the difference due to stage at presentation.
Although SEER is a population-based registry, the data are collected from distinct geographic regions that may not represent national patterns of cancer nor reflect racial differences in cancer that occur in a particular region. Although we separately analyzed persons with unstaged cancer, African Americans may be less likely to receive complete diagnostic evaluations for staging,52 which could potentially bias our results. Mortality data from SEER are also based on death certificate data, which may contain inaccuracies about the underlying cause of death.
The National Healthcare Disparities Reports have primarily focused on breast and colorectal cancer mortality and screening,12,13 and our study underscores the importance of these targets. In addition, other key targets should include smoking cessation, given the large impact of cancer incidence for most types of cancer, especially for lung cancer, and also include survival among those diagnosed with prostate cancer. Continuing to improve cancer treatment and screening is undoubtedly important to improving life expectancy and quality of life for all adults, yet substantial disparities in cancer mortality will persist unless we can find ways to address the enormous impact of racial differences in cancer incidence.
Acknowledgments
This work was supported by a K08 Mentored Scientist Award (1K08AG/HS21616-05) from the National Institute on Aging, a Pfizer Scholars Grant in Clinical Epidemiology and Doris Duke Charitable Foundation Clinical Scientist Development Award to Dr. Wong and the UCLA-Drew Project Export from the National Institutes of Minority Health and Health Disparities (1P20MD000148-01).
Conflict of Interest None disclosed.
Appendix A
Table 2.
White-African-American Difference Among Men in Years of Life Expectancy Attributable to Incidence, Stage at Diagnosis and Survival After Cancer Diagnosis, by Cancer Type (95% CI)
| Cancer type | Incidence | Stage | Survival | Total |
|---|---|---|---|---|
| Lung | 0.47 (0.39 to 0.53) | 0.004 (−0.03 to 0.03) | 0.03 (−0.02 to 0.05) | 0.48 (0.42 to 0.55) |
| Breast | – | – | – | – |
| Colorectal | 0.07 (−0.03 to 0.08) | 0.03 (−0.02 to 0.06) | 0.01 (−0.01 to 0.06) | 0.11 (0.01 to 0.14) |
| Liver | 0.07 (0.03 to 0.11) | −0.003 (−0.02 to 0.02) | 0.002 (−0.01 to 0.02) | 0.07 (0.03 to 0.11) |
| Pancreas | 0.06 (0.02 to 0.12) | −0.01 (−0.02 to 0.01) | −0.001 (−0.01 to 0.01) | 0.06 (0.02 to 0.12) |
| Esophagus | 0.14 (0.08 to 0.18) | −0.002 (−0.02 to 0.02) | 0.01 (−0.01 to 0.04) | 0.14 (0.08 to 0.18) |
| Stomach | 0.11 (0.03 to 0.14) | 0.01 (−0.03 to 0.03) | 0.004 (−0.01 to 0.01) | 0.10 (0.03 to 0.14) |
| Uterine/ovary | – | – | – | – |
| Cervix | – | – | – | – |
| Prostate | 0.21 (0.13 to 0.26) | 0.04 (−0.001 to 0.09) | 0.05 (0.01 to 0.09) | 0.28 (0.19 to 0.32) |
| Urologic | −0.05 (−0.11 to 0.01) | 0.05 (−0.01 to 0.07) | 0.02 (−0.01 to 0.04) | 0.02 (−0.05 to 0.06) |
| Hematologic | 0.02 (−0.06 to 0.03) | 0.01 (−0.02 to 0.03) | 0.03 (−0.01 to 0.05) | 0.03 (−0.04 to 0.07) |
| Head and neck | 0.09 (0.03 to 0.13) | 0.02 (−0.004 to 0.06) | 0.04 (−0.001 to 0.08) | 0.14 (0.08 to 0.19) |
| Brain | −0.02 (−0.05 to 0.01) | −0.005 (−0.02 to 0.01) | 0.0002 (−0.002 to 0.002) | −0.03 (−0.06 to 0.005) |
| Thyroid | 0.05 (−0.02 to 0.07) | 0.01 (−0.02 to 0.04) | 0.002 (−0.01 to 0.01) | 0.06 (−0.02 to 0.07) |
| Melanoma | −0.12 (−0.18 to −0.07) | 0.01 (−0.02 to 0.04) | −0.001 (−0.01 to 0.02) | −0.04 (−0.10 to 0.00) |
| Other skin | 0.01 (−0.03 to 0.03) | 0.002 (−0.01 to 0.01) | 0.001 (−0.01 to 0.00) | 0.01 (−0.03 to 0.03) |
| Other cancers | 0.005 (−0.04 to 0.05) | 0.02 (−0.03 to 0.04) | 0.02 (−0.01 to 0.03) | 0.03 (−0.03 to 0.07) |
| Total | 1.12 (0.52 to 1.36) | 0.17 (−0.03 to 0.33) | 0.21 (0.05 to 0.34) | 1.47 (0.83 to 1.74) |
Numbers in bold indicate statistically significant differences at p < 0.05
These numbers are represented in Figure 1
Appendix B
Table 3.
White-African American Difference Among Women in Years of Life Expectancy Attributable to Incidence, Stage at Diagnosis and Survival After Cancer Diagnosis, by Cancer Type (95% CI)
| Cancer type | Incidence | Stage | Survival | Total |
|---|---|---|---|---|
| Lung | 0.08 (0.003 to 0.11) | 0.001 (−0.03 to 0.03) | 0.03 (−0.02 to 0.03) | 0.08 (0.01 to 0.12) |
| Breast | −0.06 (−0.12 to −0.01) | 0.08 (0.01 to 0.11) | 0.14 (0.05 to 0.16) | 0.15 (0.06 to 0.17) |
| Colorectal | 0.06 (−0.01 to 0.11) | 0.04 (−0.03 to 0.06) | 0.02 (−0.02 to 0.07) | 0.12 (0.04 to 0.16) |
| Liver | 0.03 (−0.01 to 0.07) | 0.01 (−0.02 to 0.02) | 0.003 (−0.01 to 0.02) | 0.04 (−0.01 to 0.07) |
| Pancreas | 0.10 (0.04 to 0.15) | 0.002 (−0.02 to 0.02) | 0.001 (−0.01 to 0.01) | 0.09 (0.04 to 0.15) |
| Esophagus | 0.04 (0.01 to 0.08) | 0.002 (−0.01 to 0.01) | 0.01 (−0.01 to 0.02) | 0.05 (0.01 to 0.09) |
| Stomach | 0.09 (0.01 to 0.13) | −0.003 (−0.04 to 0.02) | −0.003 (−0.01 to 0.01) | 0.09 (0.01 to 0.13) |
| Uterine/ovary | −0.05 (−0.16 to −0.04) | 0.03 (−0.01 to 0.07) | 0.02 (−0.02 to 0.05) | 0.01 (−0.09 to 0.04) |
| Cervix | 0.06 (−0.02 to 0.10) | 0.04 (−0.01 to 0.06) | 0.02 (−0.01 to 0.03) | 0.09 (0.01 to 0.13) |
| Prostate | − | – | – | – |
| Urologic | 0.03 (−0.05 to 0.06) | 0.01 (−0.02 to 0.05) | 0.01 (−0.02 to 0.04) | 0.06 (−0.03 to 0.08) |
| Hematologic | 0.005 (−0.04 to 0.05) | 0.01 (−0.02 to 0.03) | 0.02 (−0.03 to 0.04) | 0.02 (−0.03 to 0.06) |
| Head and neck | 0.03 (−0.03 to 0.06) | 0.01 (−0.01 to 0.03) | 0.03 (−0.02 to 0.04) | 0.06 (−0.01 to 0.08) |
| Brain | −0.01 (−0.05 to 0.01) | −0.01 (−0.02 to 0.01) | 0.001 (−0.002 to 0.002) | −0.02 (−0.05 to 0.01) |
| Thyroid | 0.001 (−0.04 to 0.04) | 0.001 (−0.01 to 0.02) | 0.001 (−0.01 to 0.01) | 0.01 (−0.04 to 0.05) |
| Melanoma | −0.08 (−0.15 to −0.03) | 0.01 (−0.02 to 0.05) | 0.01 (−0.01 to 0.02) | −0.01 (−0.08 to 0.04) |
| Other skin | 0.02 (−0.03 to 0.03) | −0.0004 (−0.005 to 0.01) | 0.001 (−0.01 to 0.003) | 0.01 (−0.03 to 0.03) |
| Other cancers | 0.06 (0 to 0.09) | 0.01 (−0.02 to 0.04) | 0.02 (−0.02 to 0.03) | 0.07 (0.002 to 0.10) |
| Total | 0.41 (−0.29 to 0.60) | 0.26 (−0.06 to 0.40) | 0.31 (0.05 to 0.40) | 0.91 (0.10 to 1.13) |
Numbers in bold indicate statistically significant differences at p < 0.05
These numbers are represented in Figure 2
References
- 1.Marcella S, Miller JE. Racial differences in colorectal cancer mortality. The importance of stage and socioeconomic status. J Clin Epidemiol. 2001;54:359–66. [DOI] [PubMed]
- 2.Ragland KE, Selvin S, Merrill DW. Black-white differences in stage-specific cancer survival: analysis of seven selected sites. Am J Epidemiol. 1991;133:672–82. [DOI] [PubMed]
- 3.Howell EA, Chen YT, Concato JRD. Differences in cervical cancer mortality among black and white women. Obstet Gynecol. 1999;94:509–15. [DOI] [PubMed]
- 4.Gadgeel SM, Kalemkerian GP. Racial differences in lung cancer. In: Cancer Metastasis Rev; 2003:39–46. [DOI] [PubMed]
- 5.Potosky AL, Merrill RM, Riley GF, et al. Prostate cancer treatment and 10-year survival among group/staff HMO and fee-for-service Medicare patients. Health Serv Res. 1999;34:525–46. [PMC free article] [PubMed]
- 6.Merrill RM, Lyon JL. Explaining the difference in prostate cancer mortality rates between white and black men in the United States. Urology. 2000;55:730–5. [DOI] [PubMed]
- 7.Freeman VL, Durazo-Arvizu R, Keys LC, Johnson MP, Schafernak K, Patel VK. Racial differences in survival among men with prostate cancer and comorbidity at time of diagnosis. Am J Public Health. 2004;94:803–8. [DOI] [PMC free article] [PubMed]
- 8.Cooper GS, Yuan Z, Rimm AA. Racial disparity in the incidence and case-fatality of colorectal cancer: analysis of 329 United States counties. Cancer Epidemiol Biomarkers Prev. 1997;6:283–5. [PubMed]
- 9.Elmore JG, Nakano CY, Linden HM, Reisch LM, Ayanian JZ, Larson EB. Racial Inequities in the Timing of Breast Cancer Detection, Diagnosis, and Initiation of Treatment. Med Care. 2005;43:141–8. [DOI] [PubMed]
- 10.Parker SL, Davis KJ, Wingo PA, Ries LA, Heath CW Jr. Cancer statistics by race and ethnicity. CA Cancer J Clin. 1998;48:31–48. [DOI] [PubMed]
- 11.Kilbourne AM, Switzer G, Hyman K, Crowley-Matoka M, Fine MJ. Advancing health disparities research within the health care system: a conceptual framework. Am J Public Health. 2006;96:2113–21. [DOI] [PMC free article] [PubMed]
- 12.Agency for Healthcare Research and Quality. 2006 National Healthcare Disparities Report. Rockville, MD: US Department of Health and Human Services, Agency for Healthcare Research and Quality; 2006.
- 13.Agency for Healthcare Research and Quality. 2007 National Healthcare Disparities Report. Rockville, MD: US Department of Health and Human Services, Agency for Healthcare Research and Quality; 2007.
- 14.Wong MD, Shapiro MF, Boscardin WJ, Ettner SL. Contribution of major diseases to disparities in mortality. N Engl J Med. 2002;347:1585–92. [DOI] [PubMed]
- 15.Wong MD, Tagawa T, Hsieh HJ, Shapiro MF, Boscardin WJ, Ettner SL. Differences in cause-specific mortality between Latino and white adults. Med Care. 2005;43:1058–62. [DOI] [PubMed]
- 16.National Center for Health Statistics. National Health Interview Survey, Part1. 1994. Springfield, VA: National Technical Information Service; 1994 (database).
- 17.National Center for Health Statistics. National Health Interview Surveys, 1986-1997: Multiple Cause of Death, 1986-1997. Hyattsville, MD: US Department of Health and Human Services; 2000.
- 18.Surveillance, Epidemiology, and End Result (SEER) Program (http://www.seer.cancer.gov) Public-Use Data (1973–2000). Released April 2003, based on the November 2002 submission: National Cancer Institute, DCCPS, Surveillance Research Program, Cancer Statistics Branch. Last accessed Jan 5, 2009.
- 19.Ries LAG, Eisner MP, Kosary CL, et al. SEER Cancer Statistics Review, 1975–2002. http://seer.cancer.gov/csr/1975_2002/. In. Bethesda, MD: National Cancer Institute; 2005. Last accessed Jan 5, 2009.
- 20.Rothman KJ, Greenland S. Modern Epidemiology. 2nd ed. Philadelphia: Lippincott-Raven; 1998.
- 21.Cleveland WS, Grosse E. Computational methods for local regression. Stat Comput. 1991;1:47–62. [DOI]
- 22.Hougaard P. Analysis of Multivariate Survival Data. New York, NY: Springer-Verlag; 2000.
- 23.Arias E. United States life tables, 2000. Natl Vital Stat Rep. 2002;51:1–38. [PubMed]
- 24.King G, Tomz M, Wittenberg J. Making the most of statistical analyses: improving interpretation and presentation. Am J Polit Sci. 2000;44:341–55. [DOI]
- 25.Anderson RN, Rosenberg HM. Age standardization of death rates: Implementation of the year 2000 standard. In: National Vital Statistics Reports. Hyattsville, Maryland: National Center for Health Statistics; 1998. [PubMed]
- 26.Hoyert DL, Kochanek KD, Murphy SL. Deaths: Final data for 1997. In: National Vital Statistics Reports. Hyattsville, MD: National Center for Health Statistics; 1999:1–105. [PubMed]
- 27.Murphy SL. Deaths: Final Data for 1998. In: National vital statistics reports. Hyattsville, Maryland: National Center for Health Statistics; 2000. [PubMed]
- 28.Hoyert DL, Arias E, Smith BL, Murphy SL, Kochanek KD. Deaths: Final Data for 1999. Hyattsville, Maryland: National vital statistics reports; 2001. [PubMed]
- 29.Wingo PA, Ries LA, Rosenberg HM, Miller DS, Edwards BK. Cancer incidence and mortality, 1973–1995: a report card for the US Cancer. 1998;82:1197–207. [DOI] [PubMed]
- 30.Pierce JP, Fiore MC, Novotny TE, Hatziandreu EJ, Davis RM. Trends in cigarette smoking in the United States. Projections to the year 2000. Jama. 1989;261:61–5. [DOI] [PubMed]
- 31.Muscat JE, Djordjevic MV, Colosimo S, Stellman SD, Richie JP Jr. Racial differences in exposure and glucuronidation of the tobacco-specific carcinogen 4-(methylnitrosamino)-1-(3-pyridyl)-1-butanone (NNK). Cancer. 2005;103:1420–6. [DOI] [PubMed]
- 32.Schildkraut JM, Demark-Wahnefried W, Wenham RM, et al. IGF1 (CA)19 repeat and IGFBP3 -202 A/C genotypes and the risk of prostate cancer in Black and White men. Cancer Epidemiol Biomarkers Prev. 2005;14:403–8. [DOI] [PubMed]
- 33.Li CI, Malone KE, Daling JR. Differences in breast cancer stage, treatment, and survival by race and ethnicity. Arch Intern Med. 2003;163:49–56. [DOI] [PubMed]
- 34.Cheng X, Chen VW, Steele B, et al. Subsite-specific incidence rate and stage of disease in colorectal cancer by race, gender, and age group in the United States, 1992–1997. Cancer. 2001;92:2547–54. [DOI] [PubMed]
- 35.Jacobellis J, Cutter G. Mammography screening and differences in stage of disease by race/ethnicity. Am J Public Health. 2002;92:1144–50. [DOI] [PMC free article] [PubMed]
- 36.Klabunde CN, Potosky AL, Harlan LC, Kramer BS. Trends and black/white differences in treatment for nonmetastatic prostate cancer. Med Care. 1998;36:1337–48. [DOI] [PubMed]
- 37.Schapira MM, McAuliffe TL, Nattinger AB. Treatment of localized prostate cancer in African-American compared with Caucasian men. Less use of aggressive therapy for comparable disease. Med Care. 1995;33:1079–88. [DOI] [PubMed]
- 38.Riley GF, Potosky AL, Klabunde CN, Warren JL, Ballard-Barbash R. Stage at diagnosis and treatment patterns among older women with breast cancer: an HMO and fee-for-service comparison. Jama. 1999;281:720–6. [DOI] [PubMed]
- 39.Bach PB, Cramer LD, Warren JL, Begg CB. Racial differences in the treatment of early-stage lung cancer. In: N Engl J Med; 1999:1198–205. [DOI] [PubMed]
- 40.Demissie K, Oluwole OO, Balasubramanian BA, Osinubi OO, August D, Rhoads GG. Racial differences in the treatment of colorectal cancer: a comparison of surgical and radiation therapy between Whites and Blacks. In: Ann Epidemiol; 2004:215–21. [DOI] [PubMed]
- 41.Neugut AI, Fleischauer AT, Sundararajan V, et al. Use of adjuvant chemotherapy and radiation therapy for rectal cancer among the elderly: a population-based study. J Clin Oncol. 2002;20:2643–50. [DOI] [PubMed]
- 42.Sundararajan V, Grann VR, Jacobson JS, Ahsan H, Neugut AI. Variations in the use of adjuvant chemotherapy for node-positive colon cancer in the elderly: a population-based study. Cancer J. 2001;7:213–8. [PubMed]
- 43.Tammemagi CM, Nerenz D, Neslund-Dudas C, Feldkamp C, Nathanson D. Comorbidity and Survival Disparities Among Black and White Patients With Breast Cancer. JAMA. 2005;294:1765–72. [DOI] [PubMed]
- 44.Wilt TJ, MacDonald R, Hagerty K, Schellhammer P, Kramer BS. Five-alpha-reductase Inhibitors for prostate cancer prevention. Cochrane Database Syst Rev. 2008:CD007091. [DOI] [PMC free article] [PubMed]
- 45.Hoffman RM, Harlan LC, Klabunde CN, et al. Racial differences in initial treatment for clinically localized prostate cancer. Results from the prostate cancer outcomes study. In: J Gen Intern Med; 2003:845–53. [DOI] [PMC free article] [PubMed]
- 46.Shavers VL, Harlan LC, Stevens JL. Racial/ethnic variation in clinical presentation, treatment, and survival among breast cancer patients under age 35. Cancer. 2003;97:134–47. [DOI] [PubMed]
- 47.Joslyn SA. Hormone receptors in breast cancer: racial differences in distribution and survival. Breast Cancer Res Treat. 2002;73:45–59. [DOI] [PubMed]
- 48.Gapstur SM, Dupuis J, Gann P, Collila S, Winchester DP. Hormone receptor status of breast tumors in black, Hispanic, and non-Hispanic white women. An analysis of 13,239 cases. Cancer. 1996;77:1465–71. [DOI] [PubMed]
- 49.Beverly LN, Flanders WD, Go RC, Soong SJ. A comparison of estrogen and progesterone receptors in black and white breast cancer patients. Am J Public Health. 1987;77:351–3. [DOI] [PMC free article] [PubMed]
- 50.Stark AT, Claud S, Kapke A, Lu M, Linden M, Griggs J. Race modifies the association between breast carcinoma pathologic prognostic indicators and the positive status for HER-2/neu. Cancer. 2005;104:2189–96. [DOI] [PubMed]
- 51.Gupta AK, Melton LJ 3rd, Petersen GM, et al. Changing trends in the incidence, stage, survival, and screen-detection of colorectal cancer: a population-based study. Clin Gastroenterol Hepatol. 2005;3:150–8. [DOI] [PubMed]
- 52.Lathan CS, Neville BA, Earle CC. The Effect of Race on Invasive Staging and Surgery in Non-Small-Cell Lung Cancer. J Clin Oncol. 2006;24:413–8. [DOI] [PubMed]