Abstract
Raman spectroscopy can provide valuable information about bone tissue composition in studies of bone development, biomechanics, and health. In order to study the Raman spectra of bone in vivo, instrumentation that enhances the recovery of subsurface spectra must be developed and validated. Five fiber-optic probe configurations were considered for transcutaneous bone Raman spectroscopy of small animals. Measurements were obtained from the tibia of sacrificed mice, and the bone Raman signal was recovered for each probe configuration. The configuration with the optimal combination of bone signal intensity, signal variance, and power distribution was then evaluated under in vivo conditions. Multiple in vivo transcutaneous measurements were obtained from the left tibia of 32 anesthetized mice. After collecting the transcutaneous Raman signal, exposed bone measurements were collected and used as a validation reference. Multivariate analysis was used to recover bone spectra from transcutaneous measurements. To assess the validity of the transcutaneous bone measurements cross-correlations were calculated between standardized spectra from the recovered bone signal and the exposed bone measurements. Additionally, the carbonate-to-phosphate height ratios of the recovered bone signals were compared to the reference exposed bone measurements. The mean cross-correlation coefficient between the recovered and exposed measurements was 0.96, and the carbonate-to-phosphate ratios did not differ significantly between the two sets of spectra (p > 0.05). During these first systematic in vivo Raman measurements, we discovered that probe alignment and animal coat color influenced the results and thus should be considered in future probe and study designs. Nevertheless, our noninvasive Raman spectroscopic probe accurately assessed bone tissue composition through the skin in live mice.
INDEX HEADINGS: Raman spectroscopy, bone, fiber optic probe, transcutaneous, noninvasive, in vivo
INTRODUCTION
Bone is a dynamic mineralized tissue that provides structural support and maintains mineral ion homeostasis for the body. The chemistry of bone is an area of intense research because of its importance in health and disease. Bone is a composite tissue consisting of apatite mineral crystallites embedded within a protein matrix. The protein matrix is composed primarily of type I collagen and contains a lesser amount (~ 10%) of noncollagenous proteins such as osteocalcin. The mineral crystals are impure, and carbonate ions may replace either hydroxyl or phosphate ions in the apatitic lattice to varying degrees. A variety of physiologic and clinical conditions impact the repair and regeneration mechanisms in bone tissue, including disease (e.g., osteogenesis imperfecta, osteoporosis) and overuse (e.g., athletics, military training). Current technologies used to monitor and prescribe treatment for these conditions primarily evaluate the density or architecture of bone. However, these techniques cannot noninvasively assess bone composition, which is a key component of bone material quality and fracture resistance. Raman spectroscopy has been used to examine bone composition changes that occur in studies of bone development,1–3 bone biomechanics,4–6 and bone health.7–9 Because current instrumentation is not optimized for transcutaneous measurements, Raman spectroscopy in bone tissue is generally performed ex vivo. Noninvasive in vivo Raman measurements would improve the state of the art in biomedical optics by allowing bone tissue to be monitored without perturbation.
The development of transcutaneous Raman spectroscopic probes may enable noninvasive examination of bone composition changes for a wide range of clinical applications, including skeletal development, overuse, disease, and treatment. However, probes suitable for in vivo use must first be designed and validated. In several previous studies, spectral contributions from bone tissue were observed during in vivo Raman measurements of other tissues, such as dysplastic or cancerous tissue in the rat palate.10 The first explicit attempt to measure bone tissue with Raman spectroscopy in vivo used a spatially offset Raman spectroscopy (SORS) probe.11 However, the bone spectrum in that study was not cleanly extracted from the overlapping soft tissue spectra. In this study, we present a systematic approach for accurately recovering in vivo bone Raman spectra from overlapping soft tissue spectra in transcutaneous Raman measurements.
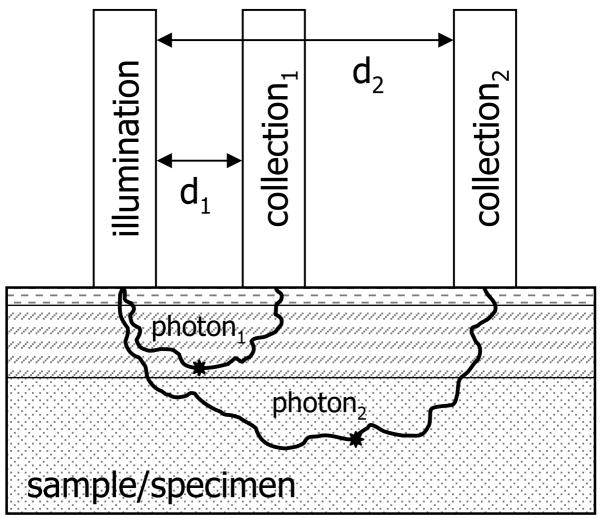
Fluorescence, light scattering, and light absorption in tissue complicates the recovery of bone spectra through skin.12 In addition, type I collagen is present in both the bone tissue matrix and overlying soft tissues (e.g, skin, tendon, muscle), and separating the overlapping spectral contributions from each tissue is challenging. SORS was developed so that depth-resolved subsurface Raman measurements could be made in highly scattering materials such as tablets, polymers, and animal tissue.11 In SORS, fiber-optic probes provide a spatial separation between the laser illumination and Raman scatter collection regions (Fig. 1). When the distance between the illumination and collection regions is increased, surface signals become less prominent, and the collected Raman spectra contain a greater contribution from subsurface components.13 The illumination-collection geometry can be tailored to optimize Raman measurements for a particular bone size and depth.
Fig. 1.
Schematic depicting spatially offset Raman spectroscopy. The spatial separation between illumination and collection optics allows depth probing into specimens. Collection optics located at a small distance from the illumination source (d1) will collect Raman scattered light originating in regions near the specimen surface, while collection optics located at a greater distance from the illumination source (d2) will collect scatter originating in deeper layers. The stars represent the points where Raman scattered photons are emitted.
Early probe configurations used point illumination.14 In this approach, the laser power was concentrated in a small area, and the high laser power density caused thermal damage to tissue. Later probe designs included a commercial probe (PhAT probe, Kaiser Optical Systems) that used global illumination to distribute the laser power over a larger, defocused area and optical fibers to collect light over the same region.15, 16 The asymmetric collection field of view of the PhAT probe provided subsurface spectral information. However, the global illumination configuration overemphasized the surface signals and thus limited the depth resolution of the PhAT probe system. More recently, a more efficient probe configuration was implemented which shaped the excitation light into a circular ring and collected the Raman signal from a disk-shaped area in the center of the ring.17–19 Two advantages of this ring/disk approach are the minimized collection of Raman signals originating from surface layers and the distribution of laser illumination over a greater area. Distributing the laser power over a greater area reduces the risk of thermal damage. Additionally, measuring several Raman spectra in the center of annular illumination patterns with different radii allows multiple depths to be sampled.20 Probe configurations must be designed and optimized to recover bone Raman spectra noninvasively for each species and anatomical site of interest to achieve the appropriate depth resolution.
In earlier studies, a canine limb was chosen, because the bone size and thickness of overlying tissue was similar to that of human subjects. However, the ring/disk probe used in prior studies is not as effective for transcutaneous Raman spectroscopy of murine bone. Mice are commonly used for the study of various bone disorders, owing to their rapid development and the availability of a variety of mutant models. Additionally, mice and rats can be used for longitudinal studies of osseointegration, implant biocompatibility, bone graft incorporation, and fracture healing.21–23 Because mouse limbs are small, separating the illuminated region and collection field of view is experimentally difficult. While practical on a larger specimen, previously described ring/disk probes are not easily focused to the dimensions required for smaller animals.
In this paper we report the development of a fiber-optic Raman probe configuration suitable for in vivo measurements in mice. We examined five fiber-optic probe configurations and determined the probe design most suitable for noninvasive measurements of bone composition in mouse limbs. With the selected configuration, we acquired the first in vivo Raman spectra of bone tissue in 32 live mice. The in vivo measurements were subsequently validated with spectra obtained from exposed bone tissue.
EXPERIMENTAL
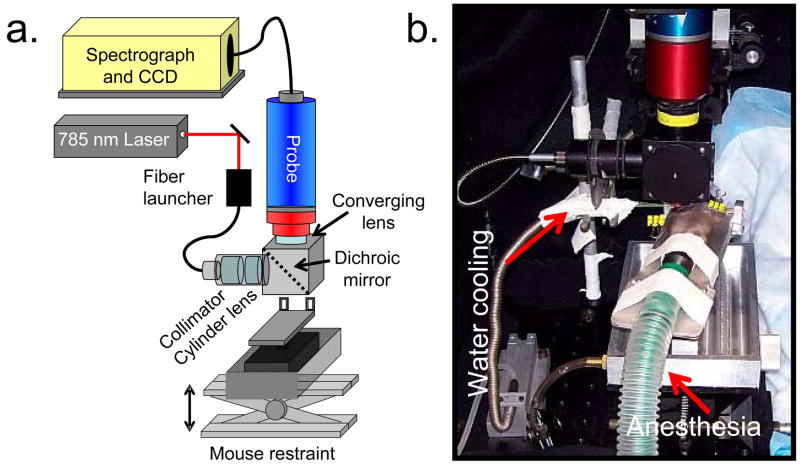
A schematic of the Raman spectroscopy system, including the mouse positioning apparatus for in vivo measurements is shown in Fig. 2a. The mouse restraint components are shown in more detail in Fig. 2b. The Raman excitation source comprises a 400-mW, 785-nm external cavity diode laser (Invictus, Kaiser Optical Systems, Inc., Ann Arbor, MI) launched into a 200-μm core NIR optical fiber (Multimode Fiber Optics, Hackettstown, NJ) for excitation. The collection fibers (fifty 100-μm core circular bundle) and optics from a non-confocal fiber-optic probe (PhAT probe, Kaiser Optical Systems, Inc.) were employed to collect and deliver backscattered Raman-shifted light to the spectrograph. Spectra were obtained with a NIR-optimized imaging spectrograph (HoloSpec, f/1.8, Kaiser Optical Systems, Inc.) fitted with a 50-μm slit, resulting in a 6–8 cm−1 spectral resolution. The spectrograph detector was a thermoelectrically cooled deep-depletion 1024 × 256 pixel CCD (Model DU420-BR-DD, Andor Technology, Belfast, Northern Ireland) operated at −75°C. A 75-mm focal length converging lens was fitted at the probe head, resulting in a 3-mm diameter circular field of view from the bundle of collection fibers. The wavelength axis of the spectrograph was calibrated against the neon discharge spectrum from a HoloLab calibration accessory (Kaiser Optical Systems, Inc.). The diffused white light from the calibration accessory was used to correct for the wavelength response of the CCD.
Fig. 2.
(a) Schematic of Raman spectroscopy system for in vivo measurements on mice. (b) Photograph of mouse restraint, showing water cooling and anesthesia delivery subsystems.
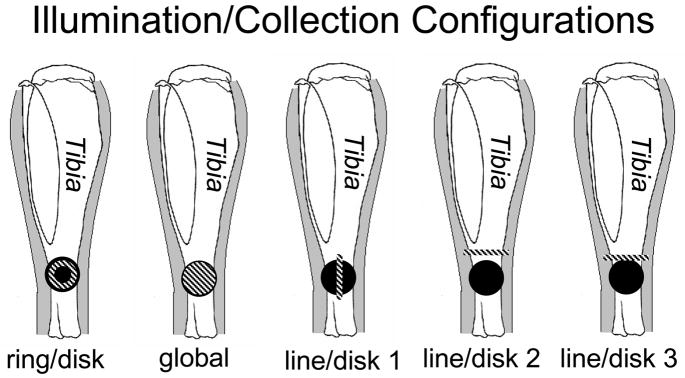
Five different illumination configurations were tested, as illustrated in Fig. 3. For ring illumination, the laser light was collimated (F810FC-780, Thorlabs Inc., Newton, NJ) and directed through a 175° axicon (Del Mar Photonics, San Diego, CA). A telephoto lens pair was used to focus the ring to an inner diameter of 1.0 mm and an outer diameter of 2.5 mm. For global illumination, laser light was projected through the built-in optics of the PhAT probe and a 75-mm focal length lens. For line illumination, the laser light was collimated and passed through a 60-mm focal length cylinder lens. A telephoto lens pair was used to shape and focus a 5.0 × 1.0 mm laser line onto the specimen. The projected laser line could be rotated by turning the cylinder lens about its axis. For the ring and line illumination geometries a dichroic mirror (R785rdc, Chroma Technology Corp., Rockingham, VT) reflected the 785-nm light to the specimen and transmitted the Raman signal to the collection fibers. All components were mounted in lens tubes or a cube mount (SM1 series, Thorlabs, Inc., Newton, NJ).
Fig. 3.
Schematic of a mouse tibia with five different configurations of the illumination (striped) and collection (solid) regions.
Signal collection was achieved using the circular array of fifty collection fibers from the PhAT probe. As a group these fibers will be referred to as the collection disk. Each illumination configuration was paired with a single collection disk (Fig. 3). For the line illumination configurations the position of the illumination line relative to the collection disk was achieved by changing the angle of the dichroic mirror so that the projection of the collection fibers and the projection of the illumination line were not coaxial. After the position of the line was appropriately aligned, the dichroic angle was fixed, and all spectra were recorded.
For each probe configuration we took a set of in vitro transcutaneous measurements on a mouse limb at the medial side of the tibia mid-diaphysis just below the tibial tuberosity. Each probe configuration was tested on a different right or left mouse limb obtained from an animal sacrificed in the course of unrelated studies at the University of Michigan Medical School. Fur at the site of interest was removed with a depilatory agent (extra strength hair remover lotion, Sally Hansen Corp, Uniondale, NY), and transcutaneous measurements were taken. Spectra were acquired with 2-minute integration times. Laser power at the specimen varied from 150 mW to 200 mW, depending on the illumination geometry. To determine the ideal probe configuration, the transcutaneous Raman signals collected with the different probe configurations were compared using bone signal intensity of the phosphate ν1 peak, spectral variance between the 50 collection fibers, and laser power distribution. While the phosphate ν1 band was intense in spectra of bone tissue, it was absent in spectra of overlying soft tissues. Maximizing the phosphate ν1 signal intensity provided the best recovery of the bone contribution to the transcutaneous Raman signal. Because the collection regions of the collection fibers were located at multiple distances from the illumination line, the recovered signals originated from multiple depths within the tissue. By enlarging the spatial offset between the illumination and collection regions the point-to-point spectral variance between collection fibers was increased, and greater depths were probed. This variance was maximized to allow better discrimination between the different tissue layers, such as skin, tendon, muscle, and bone, and thus to isolate the bone contribution to the signal. Tissue safety was a primary concern for the in vivo measurements. Thermal damage was avoided by spreading the laser power over a larger surface area, thereby minimizing the laser power distribution. The ‘line/disk 1’ probe configuration was selected for in vivo transcutaneous measurements on 32 mice, because it provided the best combination of subsurface bone signal intensity, signal variance, and laser power distribution.
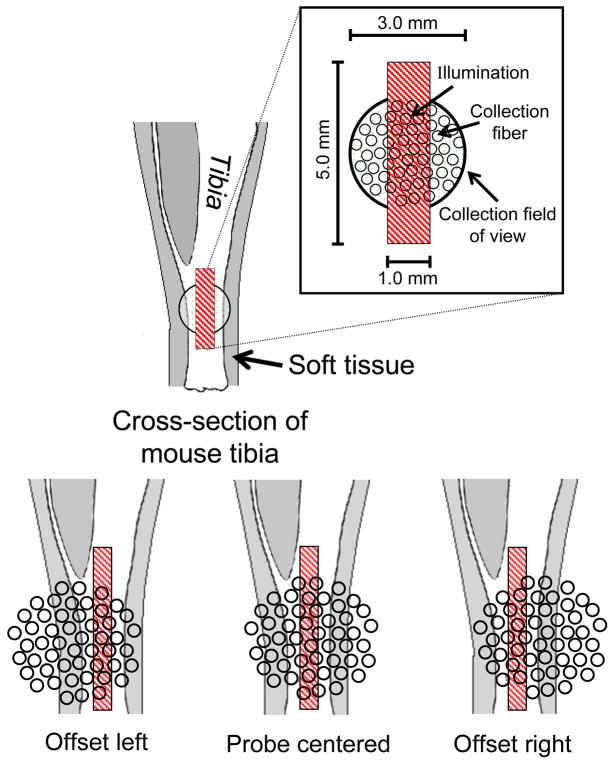
The relative size of the illumination and collection area and the probe alignment for the in vivo studies are illustrated in Fig. 4. The illumination line was always positioned directly over the bone, while the collection area was either offset to the posterior side (offset left), centered over (probe centered), or offset to the anterior side (offset right) of the tibia. A helium-neon laser was directed through the illumination optics of the collection (PhAT) probe and used to align the probe so that the 785-nm laser line was in the center of the collection disk (made visible by the helium-neon laser) when a flat object was positioned 75 mm from the probe head. With the tibia surface positioned at the focal point of the collection fiber bundle field of view, the 785-nm laser illumination line was aligned in the center of the collection disk. As a consequence of the limb curvature and slight errors in the focus position, the illumination line was in some cases positioned to the side (rather than at the center) with respect to the collection field of view, resulting in the three different probe alignments shown in Fig. 4. The illumination line was always centered over the tibia, but the effective position of the collection optics shifted slightly with limb curvature.
Fig. 4.
Schematic of probe alignment on a left mouse tibia, which differed according to the limb curvature.
All in vivo measurements followed protocols approved by the University of Michigan Committee on the Use and Care of Animals. The animals were 15-week-old female UM-HET3 mice. The UM-HET3 stock were derived from four inbred mouse strains: BALB/cJ (C), C57BL/6J (B6), C3H/HeJ (C3), and DBA/2J (D2). They were the female progeny of (C x B6) F1 females and (C3 x D2) F1 males. The mice were anesthetized with 5% isoflurane in a small chamber and then placed on the stage and fitted with a nose cone for continual delivery of 2% isoflurane to maintain sedation during the measurements. Fur was removed from the site of interest using the depilatory agent. Glycerol was applied as an optical clearing agent to enhance the depth penetration of laser light into the turbid tissue.24 Transparent 12.5-μm thick polyethylene film (Handi-Wrap, DowBrands, Indianapolis, IN) was placed over the limb at the site of interest, and room temperature water was dripped onto the film for the duration of the measurement to prevent thermal damage. After the line/disk probe was aligned on the tibia, ten 60-second measurements were acquired transcutaneously. The animal was then sacrificed, the tibia was excised, and spectra were acquired directly from the exposed bone in the region of interest.
DATA TREATMENT
All spectral processing was performed in MATLAB 6.1 (The Mathworks, Inc., Natick, MA). Each acquisition consisted of an array of 256 spectral rows as a single CCD image. Preprocessing included removing spikes due to cosmic rays, subtracting the dark current, correcting for pixel-pixel and wavelength response variation on the CCD, and correcting for slit image curvature caused by the large gathering angle of the spectrograph. The spectra from each fiber typically covered five pixel rows on the CCD. Only the central three spectra from each fiber were used to avoid cross-talk from adjacent fibers. For each acquisition these central three spectra were summed prior to further data reduction, yielding a data set of fifty spectra per acquisition (one spectrum per fiber). The transcutaneous spectral data were truncated to the 775–1500 cm−1 spectral region, which includes important bone matrix bands for collagen secondary structure and amino acids in regions contiguous to the bone mineral bands of interest. The spectra were then baselined using a weighted least squares iterative baselining procedure with a seventh-order polynomial.25, 26
To evaluate the optimum probe configuration the in vitro transcutaneous measurements for each probe configuration were compared for bone signal intensity and fiber-to-fiber spectral variance. To compare bone signal intensity, the fifty spectra from all measurements for a given probe configuration were averaged and normalized to the 1050–1090 cm−1 spectral range, and the phosphate ν1 band (ca. 959 cm−1) intensities were compared. This normalization range was chosen, because it contains substantial signal originating from collagen proteins in the overlying soft tissue, as well as from carbonate ν1 (ca. 1070 cm−1) in the bone tissue. With this normalization, visual inspection provides an estimate of the relative contribution of overlying tissue and bone contributions to the observed spectrum. The phosphate ν1 band region, which has been widely employed for normalization of bone Raman spectra, was not used in these measures, because the signal originates entirely from the subsurface bone. To compare fiber-to-fiber spectral variance, the variance in phosphate ν1 intensity was evaluated for each probe configuration using standardized spectra (mean-centered and divided by the standard deviation) from the fifty fibers. Additionally, the laser power distribution for each probe configuration was considered by calculating the area of illumination.
The data from the in vivo transcutaneous measurements were combined so that the ten 60-second measurements were paired to form five data sets of 100 spectra each. The delivered radiation dose and collection time for each mouse was equivalent to five 2-minute transcutaneous measurements. Band target entropy minimization (BTEM)27–30 was used to recover the component of the signals originating from bone tissue, hereafter referred to as recovered bone factors. First, the set of preprocessed spectral data obtained from the collection fibers was reduced using singular value decomposition. This step produced a matrix of spectral pure components (factors, eigenvectors) as well as a matrix of relative loadings for these components (relative concentrations, scores, eigenvalues). An unknown linear combination of a subset of the pure components will give a physically meaningful bone spectrum. The objective is to disentangle what is needed for the bone spectrum from the signal contribution of the overlying soft tissue. This is accomplished using the BTEM algorithm. BTEM is similar to other self-modeling curve resolution methods and uses a rotation of the principal spectral components to achieve the chemically relevant solution. However, the BTEM solution includes higher-order components rather than only the first few principal components.
For the input into the BTEM algorithm the number of pure components necessary for the signal reconstruction was calculated using the eigenvector weight distribution test.27 The region of the transcutaneous spectrum targeted was the bone mineral phosphate ν1 band, which is intense and absent from the spectra of overlying tissues. The BTEM algorithm maximized the simplicity of the pure component spectral features that corresponded to the targeted band. This step was accomplished by iteratively rotating the factors into each other to identify and retain all significant spectral features. After all the spectral features were identified, each feature was given a weighting based on the minimization of an objective function that related each band to the variation in the targeted band. Corana’s simulated annealing algorithm, an iterative procedure, was used as a global optimizer to minimize the objective function.31 A more extensive description of the BTEM algorithm, including its derivation and application, have been detailed previously.27–30 The recovery algorithm was run five times on each 2-minute acquisition, and the mean of these five results was taken to be the recovered bone factor. The number of eigenvectors used ranged between 3 and 40.
The cross-correlation coefficient between the mean recovered bone factor and the mean exposed bone spectrum for each 2-minute measurement was calculated from the standardized spectra using MATLAB. The recovered bone factors and exposed bone measurements were imported into GRAMS/AI (Thermo Galactic, Madison, WI) with RazorTools/8 (Spectrum Square Associates, Ithaca, NY) and fit for peak heights using mixed Gaussian and Lorenzian polynomials. Peak heights were constrained to values from 0 to 1, and the peak width at half-height was limited to a maximum of 30 pixels (~60 cm−1). To compare the recovered transcutaneous bone spectra and exposed bone spectra, the carbonate ν1 band at 1070 cm−1, which indicates the amount of B type carbonate substitution in the mineral lattice, and the phosphate ν1 band at 959 cm−1 were identified in each spectrum. Carbonate-to-phosphate band height ratios (1070 cm−1/959 cm−1) were then calculated from these values.
The accuracy of the transcutaneous measurements was assessed by comparing the recovered bone factors to the exposed bone spectra using both the mean and standard deviation of the carbonate-to-phosphate band height ratios. For in vivo transcutaneous bone data, the mean and standard deviation of the ratio was computed for each mouse over all 25 measurements (the recovered bone factor was calculated 5 times for each of the five 2-minute measurements). For exposed bone data, the mean and standard deviation of the ratio was computed over all 19–30 measurements. The number of exposed bone measurements was based on the number of collection fibers that could be focused onto the tibia, a number that was variable because the size of the mouse tibiae varied. Mean transcutaneous and exposed measurements were compared using a paired t-test. Because the difference in standard deviation measurements was not normally distributed, a nonparametric Wilcoxon signed-rank test was used to compare those data.
The precision of the transcutaneous measurements was examined with repeated measures analysis of variance (RM ANOVA) using a mixed-effect model. The carbonate-to-phosphate ratios from the recovered bone factors were treated as the repeated measure within mice, with five levels (one for each 2-minute acquisition). Two RM ANOVAs were analyzed, one for the mean ratio and one for the standard deviation of the mean ratio. The optimal within-subjects covariance structure was determined using both the Akaike and Bayesian Information Criteria.32 A heterogeneous autoregressive model fit best for analysis on the mean, and an autoregressive model fit best for analysis on the standard deviation.
The cross-correlation coefficients were grouped by color of the animal’s fur to analyze the effect of animal coat color on the agreement of the recovered bone factors with the mean exposed bone spectra. The 32 mice were divided equally into four groups (brown agouti, brown, black, and agouti), and the mean value of the five measurements was used for analysis. Three one-way ANOVAs were analyzed using a fixed-effect model: one for the mean value of cross-correlation coefficients, one for the standard deviation of cross-correlation coefficients, and one for the coefficient of variation of cross-correlation coefficients.
In order to evaluate probe alignment spectral data were grouped according to probe alignment (Fig. 4), and each group was matched for coat color. The three probe alignments resulted from unintentional probe misalignments, and the majority of alignments were offset right. To ensure an equal number of mice in each probe alignment group and an even distribution of coat color, each group contained only four mice: two brown, one brown agouti, and one black. The transcutaneous signal collected by each fiber was averaged over all five repetitions to improve the signal-to-noise ratio. The phosphate ν1/phenylalanine ring breathing band height ratio, a measure that has previously been used as a metric of bone signal relative to the signal of overlying tissue,33 was calculated for each collection fiber. The mean ratio over the 50 fibers for each of the 4 mice was analyzed using a one-way ANOVA on means and a one-way ANOVA on standard deviation. Additionally, a RM ANOVA was used with ratios from the 50 fibers as the repeated measure. The probe alignment, coat color, and their interaction were modeled in the RM ANOVA using a mixed-effect model with a compound symmetry covariance structure. Pairwise comparisons of the probe alignment configurations were examined using orthogonal contrasts. All statistical calculations were performed using SAS 9 (SAS Institute, Inc., Cary, NC). A significance level of 0.05 was used for all analyses.
RESULTS AND DISCUSSION
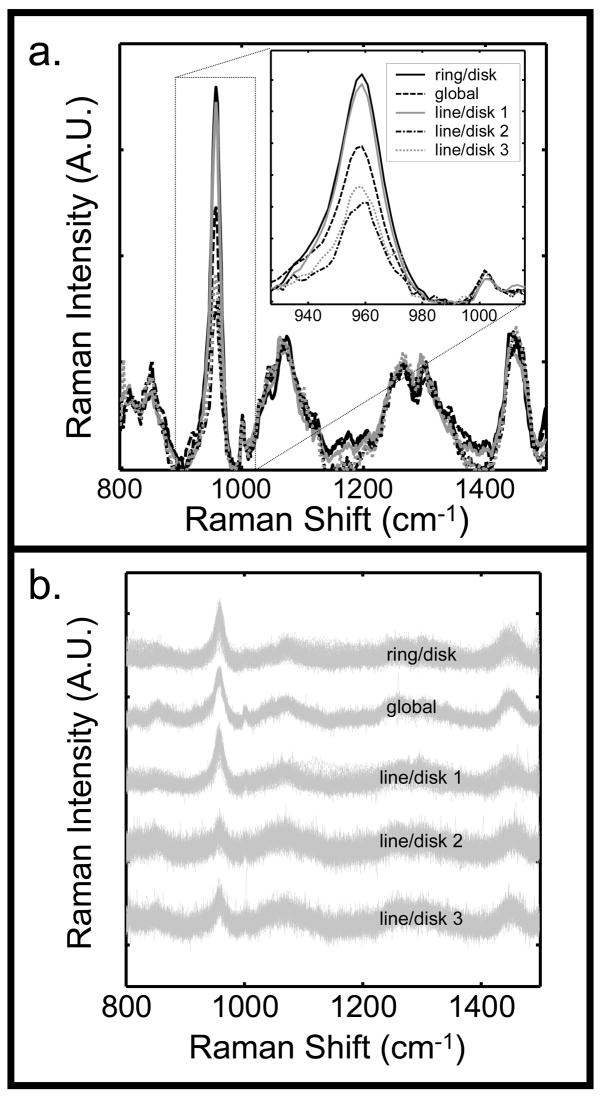
An optimal probe configuration was chosen based on the best combination of the following criteria: maximum bone signal intensity relative to the background, maximum fiber-to-fiber variation in the collected signal, and maximum distribution of laser power to prevent thermal damage to the tissue. The results from the different probe configurations are illustrated in Fig. 5. The bone signal, which is indicated by the phosphate ν1 band, was much higher for the ring/disk and line/disk 1 probe configurations (Fig. 5a). For these two configurations, the majority of the laser light was focused directly on bone tissue beneath the overlying tissue. For the global, line/disk 2, and line/disk 3 configurations, the illuminated region included a greater area outside of the bone, which led to a greater contribution from other tissues and a decreased contribution from the bone tissue.
Fig. 5.
(a) Mean transcutaneous signal taken from the 50 collection fibers for the five different Raman probe configurations of Fig. 3. (b) Superimposed standardized spectra from each of the fifty collection fibers for each probe configuration.
The fiber-to-fiber spectral variation in the signal was smallest for the global probe (Fig. 5b), because this probe did not provide as great a range of illumination-collection spatial offsets as the line illumination geometries.34 The depth penetration with the global illumination probe was not as great as with probe configurations in which the excitation and collection regions were completely offset. The line/disk 2 and line/disk 3 configurations showed greater variation in the signal than the other illumination schemes. The ring/disk and line/disk 1 configurations provided a partial separation of excitation and collection fiber regions, and the variance of these two configurations fell between that of the other probe configurations.
The laser power distribution was greatest with the global illumination approach; however, the configuration lacked variation in the fiber-to-fiber signal and signal intensity from the underlying bone. The ring/disk configuration had the most intense subsurface bone signal, but it illuminated the smallest area. The line illumination has been shown to dissipate heat more efficiently than a spot or point illumination.35 As a result, the line/disk 1 probe configuration was chosen for the in vivo studies, because it had the best trade-offs between subsurface bone signal intensity, fiber-to-fiber signal variation, and laser power distribution.
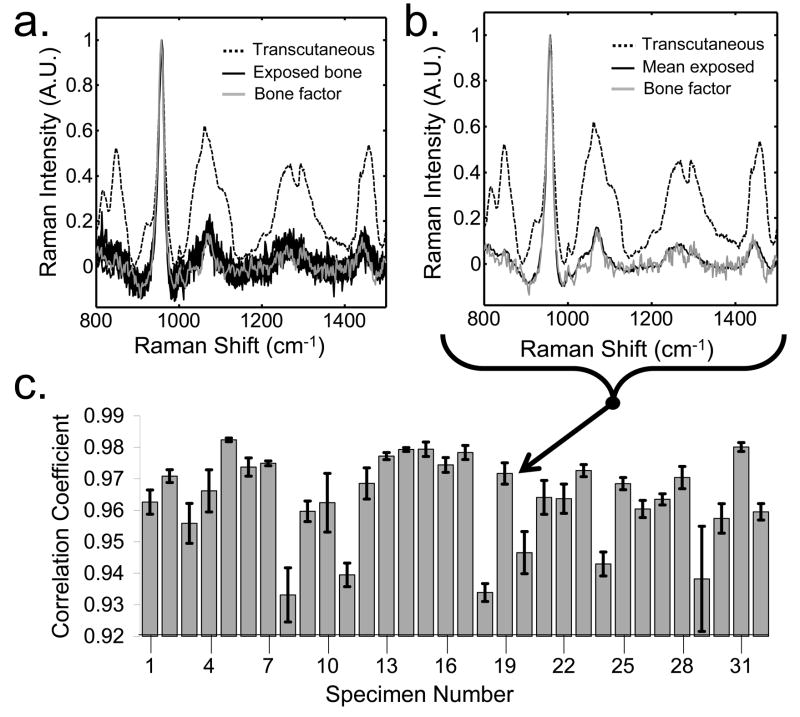
A typical recovered bone spectrum is shown in Fig. 6a and 6b. The spectra are from specimen number 19 (Fig 5c). Fig. 6a shows the fiber-to-fiber variation in the exposed bone spectra, while Fig. 6b shows the mean exposed bone spectrum. The mean transcutaneous measurements are illustrated by a dotted line, and the exposed bone spectra are shown in black. The fiber-to-fiber variance in the exposed bone spectra (Fig. 6a) was large, because the fiber probe sampled different points along the tibia. Because of the diffusive nature of light transport in transcutaneous measurements, determination of the exact location on the tibia from which the recovered bone factor originated was not possible. Therefore, the mean exposed bone spectrum was similar to, but not identical to, the recovered bone factor (Fig. 6b). The mean recovered bone factors were highly correlated with the mean exposed bone spectra, as seen by the high cross-correlation coefficient for each of the specimens (Fig. 6c). The mean cross-correlation over all of the measurements was 0.96. However, some specimens had higher cross-correlations and smaller standard deviations in the repeated measures than did others.
Fig. 6.
Representative recovered bone factor for the in vivo transcutaneous measurements (a) compared to the individual exposed bone spectra and (b) the mean exposed bone spectrum of specimen 19. (c) The recovered bone factors were similar to the mean exposed bone spectra, as evidenced by the high cross-correlation coefficients between the two for all specimens.
In addition to cross-correlation, the carbonate-to-phosphate band height ratio (Fig. 7) was used as a measure of accuracy and precision for the recovered bone factor. The mean carbonate-to-phosphate ratio for the exposed bone spectrum and recovered bone factor is shown in Fig. 7a. The results for each mouse are shown in Fig. 7b. Over all mice, the mean carbonate-to-phosphate ratios computed for the transcutaneous bone data did not differ significantly from those computed for the exposed bone data (p = 0.12). However, the standard deviation of the ratios was significantly smaller for transcutaneous measurements than for exposed measurements (p < 0.0001). In the transcutaneous measurements, the presence of overlying soft tissues caused a greater degree of light scattering than in the exposed bone measurements. Therefore, the recovered signals likely contained fewer contributions from local variations in the tissue, and the greater scattering averaged out some of the tissue inhomogeneity captured by the exposed measurements, which yielded less variable carbonate-to-phosphate ratios. For the transcutaneous data, neither the mean nor the standard deviation of the carbonate-to-phosphate ratios varied significantly across the five acquisitions (p = 0.45 and p = 0.25, respectively). Therefore, the noninvasive Raman spectroscopic measurements of bone tissue in the mouse tibia were both precise and accurate, as compared to measurements on the exposed bone tissue.
Fig. 7.
(a) Mean carbonate-to-phosphate ratio of the recovered bone factor and exposed bone measurements for all mice. (b) Mean carbonate-to-phosphate ratio of the bone factor and exposed measurements for each mouse. Error bars denote standard deviation for both plots.
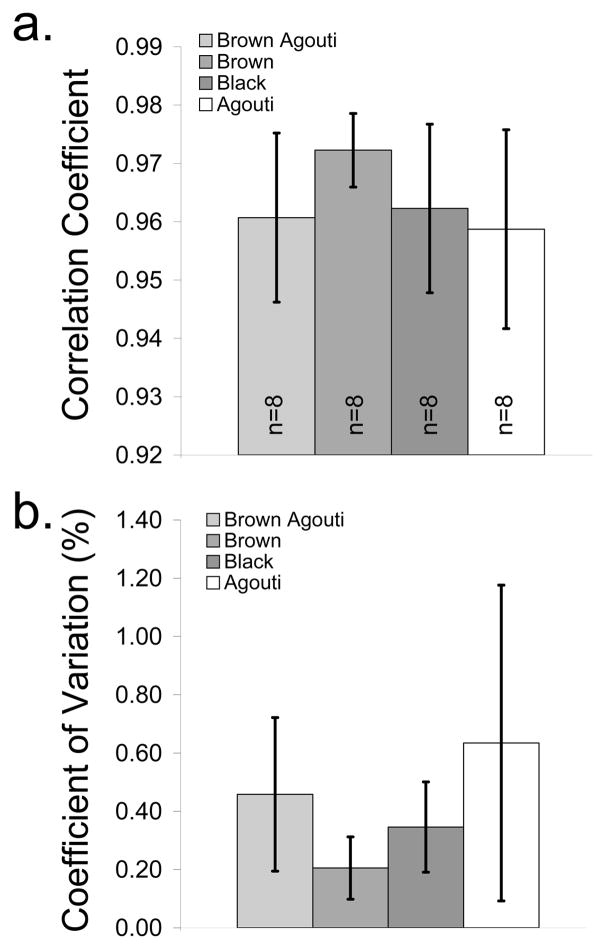
Both animal coat color and probe alignment may affect the recovered bone spectra. The cross-correlation coefficients between the recovered bone factors and exposed bone spectra are grouped by coat color in Fig. 8. Coat color was not a significant predictor of either the mean (p=0.22) or standard deviation (p=0.069) of the cross-correlation coefficients (Fig. 8a), which indicated that the accuracy of the recovered bone factors was not affected by coat color. However, the number of specimens was small for these analyses, which limited our ability to detect differences among the coat colors. For the mice with brown fur, the mean of the coefficients tended to be slightly higher and the standard deviation of the coefficients tended to be lower than for mice with other coat colors (Fig. 8a). In addition, the measurement-to-measurement variability tended to be lower for the mice with brown fur (Fig. 8b). Taken together, these results indicate that the exposed and recovered bone spectra had more consistent agreement in the mice with brown fur. The basis for the influence of coat color on these results is unclear. The density of hair follicles is higher for darker coat colors, which means that the water content is lower, because hair contains less water than skin. Lower water content means less heat dissipation and a greater risk of thermal damage. In addition, animals with darker coat colors have darker skin pigments, which are more susceptible to damage. Perhaps other differences in tissue properties exist, in addition to these differences in the thermal properties, that could explain the influence of coat color on these results. A more systematic study with a larger number of specimens would be necessary to elucidate the effect of coat color more fully. Nevertheless, our noninvasive Raman probe provided useful data for a variety of mouse strains with various coat colors.
Fig. 8.
(a) Cross-correlation coefficient between the recovered bone factors and the mean exposed bone spectra, grouped by coat color. (b) Coefficient of variation in the cross-correlation coefficients, grouped by coat color. Values are mean ± standard deviation.
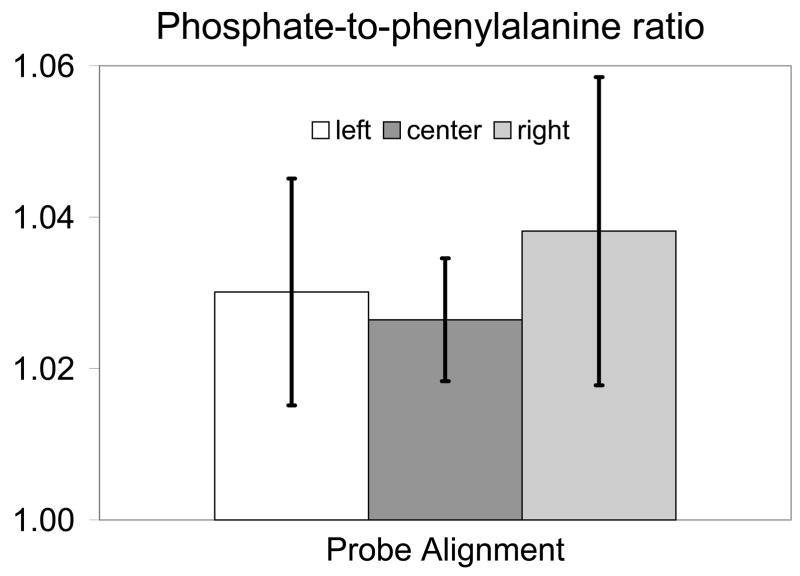
The effect of the different probe alignments on the recovered signal is shown in Fig. 9. Because coat color had some effect on signal variability, mice were grouped based on probe alignment and coat color, with four mice per group. The phosphate ν1 band at 959 cm−1 was used as a measure of bone signal intensity and was compared to the height of the phenylalanine band ca. 1003 cm−1, which is found in both overlying tissue and bone. This height ratio was computed for the signal collected by each fiber for the three different probe alignments. The amount of bone signal collected increased with the phosphate-to-phenylalanine height ratio. When the mean ratio of the 50 fibers was examined for each of the 4 mice and three probe alignments, neither the mean (p=0.37) nor the standard deviation (p=0.11) of the phosphate-to-phenylalanine ratio differed significantly across the three probe alignments. However, when the ratio for each of the fibers was treated as a repeated measure, probe alignment had a significant effect on these measurements (p<0.0001). Even after accounting for the effect of coat color, the three alignments were significantly different from each other (center vs. left p<0.0001, center vs. right p<0.0001, and left vs. right p=0.0027). Although some of the fibers collected signal from over the bone in all three alignments, the remaining fibers collected signal from other sources that varied depending on alignment. Therefore, the collected signal should differ across the different probe alignments. In the offset left position the remaining collection fibers collected signal from the soft tissue in the posteromedial portion of the limb and from the aluminum of the mouse restraint. In the centered position, the remaining collection fibers collected signal from soft tissue in the anteromedial and posteromedial portions of the limb. In the offset right position, the remaining fibers collected signal from the anteromedial side of the left leg and from the aluminum of the mouse bed.
Fig. 9.
Phosphate-to-phenylalanine band height ratio taken from the transcutaneous signal collected by each fiber for each of the probe alignments. Values are mean ± standard deviation.
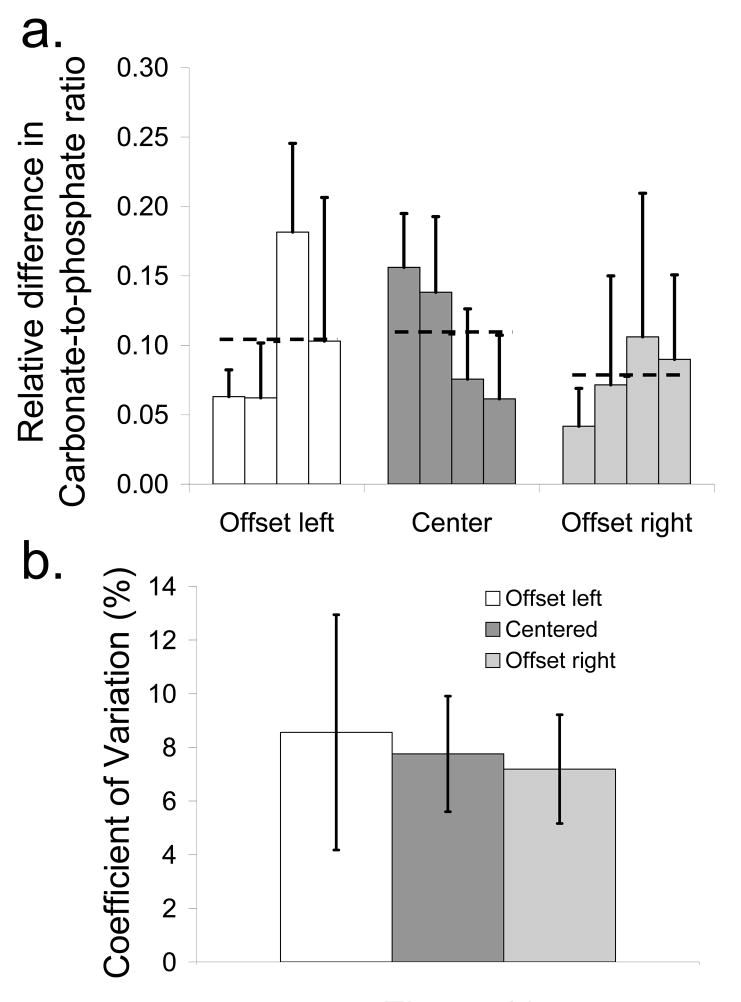
The mean and standard deviation of the absolute relative difference in the carbonate-to-phosphate ratio between the exposed bone and the recovered bone factor for each of the specimens grouped by probe alignment is shown in Fig. 10a. The mean value over all specimens for each probe alignment is indicated by a black dashed line. The mean difference was lower for the offset right alignment than for the other two probe alignments. The coefficient of variation between the three probe alignments, as shown in Fig. 10b, was slightly lower for the offset right probe, indicating a lower variability between carbonate-to-phosphate ratio measurements for this probe alignment.
Fig. 10.
(a) Difference in the carbonate-to-phosphate ratio between the recovered bone factor and the exposed bone spectrum for each specimen and mean difference over all four mice (dashed line) for each probe alignment (b) Coefficient of variation between the carbonate-to-phosphate ratios for each of the probe alignments. Values are mean ± standard deviation.
CONCLUSIONS
The results obtained using the line/disk probe demonstrates that this configuration is suitable for precise and accurate transcutaneous Raman spectroscopy of murine bone tissue in vivo. This configuration distributes the laser power to prevent thermal damage and provides a spatial separation between the illuminated region and some of the collection fibers. Both probe alignment and animal coat color were found to have an impact on the transcutaneous Raman signal. These data suggest that transcutaneous studies of bone would benefit by choosing a mouse with a brown coat color and by aligning the probe so that the collection fibers are to the anteromedial side of the tibia or, more generally, over as little soft tissue as possible.
Although the laser fluence was above ANSI Z163.1 threshold limit values (TLV) for human skin exposure,34 no thermal damage (burning) was observed in any of the in vivo measurements. The ANSI TLVs are designed to insure that no thermal damage will occur in even the most heavily pigmented skin. Our results do not allow us to assess the role, if any, of active water cooling in the prevention of thermal damage.
In this study, validation of the recovered bone factor was limited to evaluating the mean exposed bone spectra over the general region of collection. Although this approach is reasonable, we would prefer to have more accurate knowledge of the exact origin of the observed Raman spectra. A priori knowledge of the bone architecture measured independently by micro-computed tomography or magnetic resonance imaging would allow Raman tomographic reconstruction,35, 36 which would provide a more accurate definition of the regions of exposed bone for validation of our transcutaneous measurements. Research towards this goal is underway in our laboratories.
Acknowledgments
The authors acknowledge support from NIH R01 AR055222 and the University of Michigan Claude D. Pepper Older Americans Independence Center AG024824. J.H.C. acknowledges support through NIH Kirschstein-NSRA F32 AR056186. K.A.D acknowledges support through NIH training grant T32 GM008353. We thank Kaiser Optical Systems, Inc., for loan of the PhAT probe. We also thank Ken Guire from the Center for Statistical Consultation and Research at the University of Michigan for advice on data analysis.
References
- 1.Crane NJ, Popescu V, Morris MD, Steenhuis P, Ignelzi MA., Jr Bone. 2006;39(3):434. doi: 10.1016/j.bone.2006.02.059. [DOI] [PubMed] [Google Scholar]
- 2.Kozloff KM, Carden A, Bergwitz C, Forlino A, Uveges TE, Morris MD, Marini JC, Goldstein SA. J Bone Miner Res. 2004;19(4):614. doi: 10.1359/JBMR.040111. [DOI] [PubMed] [Google Scholar]
- 3.Tarnowski CP, Ignelzi MA, Jr, Morris MD. J Bone Miner Res. 2002;17(6):1118. doi: 10.1359/jbmr.2002.17.6.1118. [DOI] [PubMed] [Google Scholar]
- 4.Carden A, Rajachar RM, Morris MD, Kohn DH. Calcif Tissue Int. 2003;72(2):166. doi: 10.1007/s00223-002-1039-0. [DOI] [PubMed] [Google Scholar]
- 5.Dooley KA, McCormack J, Fyhrie DP, Morris MD. Proc SPIE. 2008;6853:68530Z. [Google Scholar]
- 6.Tarnowski CP, Ignelzi MA, Jr, Wang W, Taboas JM, Goldstein SA, Morris MD. J Bone Miner Res. 2004;19(1):64. doi: 10.1359/JBMR.0301201. [DOI] [PubMed] [Google Scholar]
- 7.Dehring KA, Crane NJ, Smukler AR, McHugh JB, Roessler BJ, Morris MD. Appl Spectrosc. 2006;60(10):1134. doi: 10.1366/000370206778664743. [DOI] [PubMed] [Google Scholar]
- 8.Faibish D, Ott SM, Boskey AL. Clin Orthop Relat Res. 2006;443:28. doi: 10.1097/01.blo.0000200241.14684.4e. [DOI] [PMC free article] [PubMed] [Google Scholar]
- 9.McCreadie BR, Morris MD, Chen TC, Sudhaker Rao D, Finney WF, Widjaja E, Goldstein SA. Bone. 2006;39(6):1190. doi: 10.1016/j.bone.2006.06.008. [DOI] [PubMed] [Google Scholar]
- 10.Schut TCB, Witjes MJH, Sterenborg H, Speelman OC, Roodenburg JLN, Marple ET, Bruining HA, Puppels GJ. Anal Chem. 2000;72(24):6010. doi: 10.1021/ac000780u. [DOI] [PubMed] [Google Scholar]
- 11.Matousek P. Chem Soc Rev. 2007;36(8):1292. doi: 10.1039/b614777c. [DOI] [PubMed] [Google Scholar]
- 12.Tuchin V. Light Scattering Methods and Instruments for Medical Diagnosis. 2 SPIE Press; Bellingham: 2007. Tissue Optics. [Google Scholar]
- 13.Matousek P, Morris MD, Everall N, Clark IP, Towrie M, Draper E, Goodship A, Parker AW. Appl Spectrosc. 2005;59(12):1485. doi: 10.1366/000370205775142548. [DOI] [PubMed] [Google Scholar]
- 14.Matousek P, Clark IP, Draper ER, Morris MD, Goodship AE, Everall N, Towrie M, Finney WF, Parker AW. Appl Spectrosc. 2005;59(4):393. doi: 10.1366/0003702053641450. [DOI] [PubMed] [Google Scholar]
- 15.Schulmerich MV, Finney WF, Fredricks RA, Morris MD. Appl Spectrosc. 2006;60(2):109. doi: 10.1366/000370206776023340. [DOI] [PubMed] [Google Scholar]
- 16.Schulmerich MV, Finney WF, Popescu V, Morris MD, Vanasse TM, Goldstein SA. Proc SPIE. 2006;6093:60930O. [Google Scholar]
- 17.Matousek P. Appl Spectrosc. 2006;60(11):1341. doi: 10.1366/000370206778999102. [DOI] [PubMed] [Google Scholar]
- 18.Schulmerich MV, Dooley KA, Morris MD, Vanasse TM, Goldstein SA. J Biomed Opt. 2006;11(6):060502. doi: 10.1117/1.2400233. [DOI] [PubMed] [Google Scholar]
- 19.Schulmerich MV, Morris MD, Vanasse TM, Goldstein SA. Proc SPIE. 2007;6430:643009. [Google Scholar]
- 20.Schulmerich MV, Dooley KA, Vanasse TM, Goldstein SA, Morris MD. Appl Spectrosc. 2007;61(7):671. doi: 10.1366/000370207781393307. [DOI] [PubMed] [Google Scholar]
- 21.Lane JM, Boskey AL, Li WKP, Eaton B, Posner AS. Metab Bone Dis Relat Res. 1979;1(4):319. doi: 10.1016/0221-8747(82)90010-8. [DOI] [PubMed] [Google Scholar]
- 22.Masuda T, Salvi GE, Offenbacher S, Felton DA, Cooper LF. Int J Oral Maxillofac Implants. 1997;12(4):472. [PubMed] [Google Scholar]
- 23.Tsai CH, Chou MY, Jonas M, Tien YT, Chi EY. J Biomed Mater Res. 2002;63(1):65. doi: 10.1002/jbm.10089. [DOI] [PubMed] [Google Scholar]
- 24.Schulmerich MV, Cole JH, Dooley KA, Morris MD, Kreider JM, Goldstein SA. J Biomed Opt. 2008;13(2):021108. doi: 10.1117/1.2892687. [DOI] [PMC free article] [PubMed] [Google Scholar]
- 25.Lieber CA, Mahadevan-Jansen A. Appl Spectrosc. 2003;57(11):1363. doi: 10.1366/000370203322554518. [DOI] [PubMed] [Google Scholar]
- 26.Zhao J, Lui H, McLean DI, Zeng H. Appl Spectrosc. 2007;61(11):1225. doi: 10.1366/000370207782597003. [DOI] [PubMed] [Google Scholar]
- 27.Chew W, Widjaja E, Garland M. Organometallics. 2002;21(9):1982. [Google Scholar]
- 28.Ong LR, Widjaja E, Stanforth R, Garland M. J Raman Spectrosc. 2003;34(4):282. [Google Scholar]
- 29.Widjaja E, Crane N, Chen TC, Morris MD, Ignelzi MA, Jr, McCreadie BR. Appl Spectrosc. 2003;57(11):1353. doi: 10.1366/000370203322554509. [DOI] [PubMed] [Google Scholar]
- 30.Widjaja E, Li C, Chew W, Garland M. Anal Chem. 2003;75(17):4499. doi: 10.1021/ac0263622. [DOI] [PubMed] [Google Scholar]
- 31.Corana A, Marchesi M, Martini C, Ridella S. ACM Trans Math Softw. 1987;13(3):262. [Google Scholar]
- 32.Neter J, Kutner MH, Nachtsheim CJ, Wasserman W. Applied Linear Statistical Models. 4 WCB/McGraw-Hill; Boston: 1996. [Google Scholar]
- 33.Zhang DM, Hanna JD, Jiang YN, Ben-Amotz D. Appl Spectrosc. 2001;55(1):61. [Google Scholar]
- 34.American National Standards Institute. American National Standard for the safe use of lasers (ANSI Z136.1-2007) Laser Institute of America; Orlando: 2007. [Google Scholar]
- 35.Schulmerich MV, Srinivasan S, Kreider J, Cole JH, Dooley KA, Goldstein SA, Pogue BW, Morris MD. Proc SPIE. 2008;6853:68530V. [Google Scholar]
- 36.Schulmerich MV, Cole JH, Dooley KA, Morris MD, Kreider JM, Goldstein SA, Srinivasan S, Pogue BW. J Biomed Opt. 2008;13(2):020506. doi: 10.1117/1.2904940. [DOI] [PMC free article] [PubMed] [Google Scholar]


