

Abstract
Microglial inflammatory neuroregulatory activities affect the tempo of nigrostriatal degeneration during Parkinson's disease (PD). Such activities are induced, in part, by misfolded, nitrated alpha-synuclein (N-α-syn) within Lewy bodies released from dying or dead dopaminergic neurons. Such pathobiologic events initiate innate and adaptive immune responses affecting neurodegeneration. We posit that the neurobiological activities of activated microglia are affected by cell-protein and cell-cell contacts, in that microglial interactions with N-α-syn and CD4+ T cells substantively alter the microglial proteome. This leads to alterations in cell homeostatic functions and disease. CD4+CD25+ regulatory T cells (Treg) suppress N-α-syn microglial induced reactive oxygen species and nuclear factor kappa B activation by modulating redox-active enzymes, cell migration, phagocytosis, and bioenergetic protein expression and cell function. In contrast, CD4+CD25− effector T cells exacerbate microglial inflammation and induce “putative” neurotoxic responses. These data support the importance of adaptive immunity in the regulation of PD-associated microglial inflammation.
Keywords: T cells, Neuroimmunology, Inflammation
Introduction
Parkinson's disease (PD) is characterized by progressive nigrostriatal degeneration and deficits in dopamine transmission. A pathological hallmark of PD are Lewy bodies (LB) that present as intracellular inclusions of aggregated proteins and lipids in dopaminergic (DA) neurons (1, 2). A major constituent of LB is α-synuclein (α-syn) (3) characterized by self aggregation and covalently bonded protein dimers modified by oxidative stress and protein nitration (4-6).
Linkages between DA neurodegeneration and microglial neuroinflammatory activities are well known and demonstrated by large numbers of immune competent microglia within the substantia nigra (SN) of postmortem PD brains (7) appearing as phagocytic cells engulfing damaged DA neurons (7, 8). In transgenic mutant α-syn mice, and in mice treated with 1-methyl-4-phenyl-1,2,3,6-tetrahydopyridine (MPTP) and rotenone (8-10) similar microglial responses are operative. Importantly, such microglial activation is associated with α-syn deposition (11-13) and internalization (14). This occurs throughout disease suggesting linkages to oxidative damage, α-syn nitration and aggregation, and PD-associated neurodegeneration (15, 16) Indeed, microglial activation is strongly associated with neurotoxic responses and collateral neuronal damage (17-20). Thus for PD, nitrated-α-syn (N-α-syn)-mediated microglial activation and accelerated neuronal death are closely related (21-25).
Abundant evidence indicates a significant role for adaptive immunity in neuroregulatory activities (26-29). Such effects are seen in experimental neurodegenerative models including PD (29-31). Principally, these data found that neuronal degeneration or protection is linked to the microglial phenotype and that N-α-syn-specific effector T cells exacerbate microglial activation and DA neurodegeneration, while CD4+CD25+ (Treg) attenuate those processes; however how microglia activation is regulated by regulatory and effector T cell subsets is not known. To address this, we used aggregated N-α-syn as an inducer of microglial activation (23, 24), then studied the microglial immune response as it is affected by activated Treg and CD4+CD25− effector T cells (Teff). The observations demonstrate, for the first time, that Treg modulate a broad range of microglial activities including redox biology, migration, phagocytosis, energy metabolism and cytokine secretions. Differential outcomes of microglial processes are dependent on the temporal engagement of Treg with N-α-syn and microglia. The findings provide insights into disease pathobiology and how the adaptive immune system may be harnessed for therapeutic benefit.
Material and Methods
Animals
C57Bl/6J male mice (7 wks old) were purchased from The Jackson Laboratory (Bar Harbor, ME) and used for CD4+ T cell isolations. All animal procedures were in accordance with National Institutes of Health guidelines and were approved by the Institutional Animal Care and Use Committee of the University of Nebraska Medical Center.
Cell isolates
Microglia were prepared from neonatal mice (1−2 days old) using previously described techniques (32) (Supplementary Data). Adherent microglia were cultured in DMEM complete media for 7−14 days and then re-plated for experiments. Cultures were consistently >98% CD11b+ microglia as determined by morphology and flow cytometric analysis (33). CD4+ T cell subsets were isolated from lymph nodes and spleens using previously described techniques (29, 31) (Supplementary Data). Teff and Treg isolates utilized in these studies were >95% enriched. Following CD3-activation, T cells were added in co-culture with primary microglia for 24 h. All analyses of microglia phenotypic changes were performed after removal of T cells by vigorous washings from the microglial co-cultures.
Flow cell analysis
Samples from cell fractions were labeled with fluorescently labeled antibodies to CD4, CD8, CD25, CTLA-4, CD62L, FasL, Fas (APO-1), CD11b, and intracellular FoxP3 (eBiosciences, San Diego, CA) and active-caspase 3 (Abcam, Cambridge, MA) and analyzed with a FACSCalibur flow cytometer (BD Biosciences, San Jose, CA). FITC-latex beads (1 mM, 2.5% solids) (Sigma-Aldrich, St. Louis, MO) were added to microglial cultures for 30 min. Microglia were then detached and acid washed (PBS pH 6.0) to quench fluorescence of non-phagocytosed beads, and cells were analyzed by flow cytometry and gated to CD11b+ cells. Fluorescence intensity was normalized to beads alone.
Quantitative polymerase chain reaction (qPCR)
RNA was extracted with TRIzol reagent (Invitrogen, Carlsbad, CA), column purified (Qiagen, Valencia, CA), and RNA (2 μg) was reverse transcribed with random hexamers and SSII reverse transcriptase (Applied Biosystems, Foster City, CA) for cDNA synthesis. Real-time qPCR was performed with cDNA using an ABI PRISM 7000 sequence detector (Applied Biosystems), using the SYBR Green detection system and murine-specific primers (Supplemental data). Values were normalized to glyceraldehydes-3-phosphate dehydrogenase (Gapdh) expression.
Recombinant α-syn
Purification, nitration, and aggregation of recombinant mouse α-syn were performed as previously described (23, 25, 29) (Supplementary Data). N-α-syn was added to cultures at 100 nmol/L (14.5 ng/ml).
Cyto/chemokine analysis
Fifty microliters of culture supernatants were analyzed using the BD Cytometric Bead Array Mouse Inflammation Kit (BD Biosciences) and measured with a FACSCalibur flow cytometer (BD Biosciences). Cytokine concentration was determined from a standard curve prepared from cytokine standards. The multi-analyte cytokine ELISArrays (Superarray, Frederick, MD) were performed according to manufacturer's protocol. Culture inserts (0.4 μm pore size) (BD Biosciences), and neutralizing antibodies to mouse IL-10 (5 μg/ml) (BD Pharmingen), TGF-β1 (5 μg/ml) (R & D Systems), CTLA-4 (CD152; 5 μg/ml) (BD Biosciences) were used.
2D SDS PAGE
Cell lysate fractionation, sample labeling, 2D DIGE, image acquisition, and Decyder analysis was performed as described (Supplementary Data). The selection criteria for spots were based on gel image quantitative analysis using DeCyder™ software (GE Healthcare, Piscataway, NJ) with the threshold for analysis at greater than 1.5-fold difference between spot intensities. Protein spots were analyzed by Biological Variance Analysis (BVA) software (GE Healthcare) then matched to a preparative 2D gel, and excised using an Ettan robotic spot picker (34). In gel tryptic digestion and LC-MS/MS were performed as described (Supplementary Data). Proteins identified by peptides having a Unified Score >3000 were targeted for further analysis (33).
Western blot
Ten micrograms of protein was loaded onto 4−12% gradient Bis-Tris NuPAGE Novex gels (Invitrogen), electrophoresed, and transferred onto PVDF membranes (BioRad, Hercules, CA). Blots were probed with the respective primary antibodies (Supplemental data) and secondary antibodies (1:10000; Invitrogen), and detected using SuperSignal West Pico Chemiluminescent substrate (Pierce Biotechnology, Inc., Rockford, IL). Band intensity was measured using ImageJ and normalized to Gapdh or β-actin (1:5000, Santa Cruz Biotechnology, Inc., Santa Cruz, CA).
Immunofluorescence
Intracellular ROS production was detected using the ImageItLive ROS Detection kit (Invitrogen) according to manufacturer's protocol. Antibodies included active caspase-3 (Abcam) and NF-κB p65 (Cell Signaling Technology, Danvers, MA), and nuclei were stained with TOPRO-3 or DAPI (Invitrogen). Images were taken with a Nikon swept field confocal microscope (Nikon Instruments Inc., Melville, NY). Cathepsin B activity was determined using the CV-Cathepsin B Detection Kit (BIOMOL International LP, Plymouth Meeting, PA) according to manufacturer's protocol and visualized with an inverted fluorescent microscope. The mean fluorescence intensity (MFI) was determined using ImageJ software.
Glutathione (GSH) assay
Microglia were cultured with and without N-α-syn for 24 h in media without exogenous glutamine. Intracellular GSH levels with the Biovision GSH Assay Kit (Biovision, Mountain View, CA) according to manufacturer's protocol, and assessed using a SpectraMAX GEMINI fluorometer (Molecular Devices, Sunnyvale, CA) at excitation/emission of 340/450 nm, and normalized to a GSH standard curve.
Apoptosis
Apoptotic cells were detected using the TACS TdT Fluorescein In Situ Apoptosis detection kit (R & D Systems, Minneapolis, MN) according to manufacturer's protocol, and visualized by a fluorescent microscope. MFI of TUNEL+ cells was determined per field using ImageJ and normalized to DAPI-stained nuclei (n=3, 6 fields per well). Caspase activity was determined using the SensoLyte Homogeneous Rh110 Caspase- 3/7 Assay Kit [AnaSpec] according to manufacturer's protocol (Supplementary Data). Cell viability was determined by 3-(4,5-dimethylthiazol-2-yl)-2,5-diphenyl tetrazolium bromide (MTT) activity as described (Supplementary Data). Functional grade antibodies to mouse FasL (2 μg/ml) (eBiosciences) and Fas (5 μg/ml) (BD Pharmingen), and CA074ME (BIOMOL International LP) were used.
Statistics
All values are expressed as means ± SEM and representative of three-four separate experiments. Differences among means were analyzed by one-way ANOVA followed by Tukey's post-hoc testing for pair-wise comparison. For identification of statistically significant proteins, three-four analytical gels were analyzed using BVA software by one-way ANOVA for pair-wise comparison between treatment groups.
Results
Treg affect N-α-Syn microglial nuclear factor-kappa B (NF-κB) responses
To test the notion of Treg control of microglial activities in preclinical and overt disease we developed two experimental paradigms. One reflects early or asymptomatic disease where Treg would engage microglia prior to exposure to N-α-syn and the second where Treg is added to N-α-syn-activated microglia. Tests of cell-surface antigens, cytokine gene expression, and suppression of Teff proliferation indicated that T cell isolates were characteristic of distinct Treg and Teff populations (Fig. S1). To determine the effect of CD4+ T cells on microglial responses to N-α-syn, we co-cultured CD3-activated Treg or Teff with primary microglia at a 1:1 ratio for 24 h, removed the T cells, and stimulated the microglia with aggregated N-α-syn. Microglial uptake of Cy5 labeled N-α-syn by flow cytometry for Cy5-N-α-syn containing microglia between control and T cell-treated microglia revealed that neither Treg nor Teff treatment significantly altered microglia uptake of N-α-syn (data not shown). In situ analysis for NF-κB p65 expression in cultured microglia revealed that N-α-syn stimulation resulted in an increase in NF-κB p65 expression compared to unstimulated controls. In contrast, pre-treatment with Treg, but not Teff attenuated the induction of NF-κB p65 expression by N-α-syn stimulation (Fig. 1A). Western blot for NF-κB activation was determined by translocation of the subunits RELA/p50 and NFKB1/p65 to the nucleus. N-α-syn stimulation induced translocation of the NF-κB subunits to the nucleus, whereas translocation was inhibited by pre-treatment with Treg (Fig. 1B). After Teff pre-treatment translocation of NF-κB subunits was comparable to N-α-syn stimulation. Diminished expression of NF-κB related genes following pre-treatment with Treg in stimulated microglia including Tnfa, Tnfrs1a, Rela, and Nos2 was also observed (Fig. 1C). Expression of neurotrophins Bdnf and Gdnf were increased following Treg pre-treatment to greater levels relative to all other treatments (Fig. 1D).
FIGURE 1.

CD4+ T cells modulate NF-κB activation in N-α-syn-stimulated microglia. Microglia were pretreated without or with CD4+ T cells and NF-κB activity was assessed following 90 min stimulation with N-α-syn. (A) Photomicrographs of immunofluorescent detection for NF-κB p65 in stimulated microglia (scale bar: 25 μm) and analysis for mean fluorescence intensity (MFI) per cell. Arrows indicate areas where co-localization of NF-κB p65 (green) and nuclei (blue) appears to have occurred. (B) Western blot analysis of nuclear fractions from stimulated microglia with antibodies to the NF-κB subunits p50/RELA (top), p65/NFκB1 (middle), or a control Gapdh antibody (bottom). Mean optical density (OD) was normalized to Gapdh expression. In addition, cDNA prepared from RNA isolated from duplicate samples was assessed by qPCR for expression of NF-κB related genes Tnfa, Tnfrs1a, Rela, Nos2 (C), and neurotrophins Bdnf and Gdnf (D). Mean expression levels shown were normalized to Gapdh expression. (B-C) Error bars represent SEM. (P < 0.05 compared to amedia alone (CON), bN-α-syn, or cN-α-syn/Teff).
Microglial cyto/chemokine analysis revealed that pre-treatment with Treg suppressed production of IFN-γ, TNF-α, IL-12, IL-6, IL-10, and MCP-1 compared to untreated or Teff-treated microglia, whereas only TNF-α was reduced by Teff pre-treatment (Fig. 2A). To mirror interactions that would occur between CD4+ T cells and microglia in disease, microglia were first stimulated with aggregated N-α-syn for 12 h prior to addition of Treg or Teff (post-treatment). Treg post-treatment resulted in diminished production of all assayed pro-inflammatory cytokines except IFN-γ, which was increased as a result of Treg or Teff co-culture compared to N-α-syn stimulation alone, although concentration was less after treatment with Treg than with Teff. Assessment of CD206 (macrophage mannose receptor) and MHC class II expression, revealed that pre- or post-treatment with Treg upregulated both markers for alternative activation, as did post-treatment with Teff (Fig. 2B and C). N-α-syn stimulation reduced microglial phagocytosis of FITC-labeled latex beads as determined by a 68% decrease in MFI compared to unstimulated microglia (Fig. 2D). However, Treg-pretreated microglia consistently engulfed more beads compared to N-α-syn stimulated microglia (+6.8-fold) or Teff-pretreated microglia (+1.9-fold). In contrast, post-treatment with Treg or Teff had no significant effect on phagocytosis compared to N-α-syn stimulation.
FIGURE 2.

Inhibition of proinflammatory cyto/chemokine production requires both cell contact and soluble factors. (A) Cyto/chemokine levels in microglial culture supernatants treated with media alone (CON), or N-α-syn without or with pre-treatment or post-treatment with CD3-activated Treg or Teff were measured by cytometric bead array. Microglia were also assessed by flow cytometry for surface expression of CD206 (B) and MHC class II (C). Alternatively, FITC-conjugated latex beads were added to the microglia cultures 30 min prior to flow cell analysis to evaluate phagocytosis by the mean fluorescence intensity (MFI) of microglia that phagocytized beads (D). [P < 0.05 compared to microglia cultured with amedia alone (CON), bN-α-syn, or cN-α-syn/Teff (panels A-D)]. Microglia were cultured without or with Treg either in direct contact or separated by transwells. Neutralizing antibodies to IL-10, TGF-β and CTLA-4 were added to tandem direct contact cultures of microglia without and with Treg. Cyto/chemokine concentrations (IFN-γ, TNF-α, IL-12, IL-6, MCP-1 and IL-10) in culture supernatants were determined by (E) cytometric bead array or (F) ELISArray (IL-1α and IL-1β). [P < 0.01 compared to microglia cultured with aN-α-syn or with bN-α-syn/Treg in direct contact (panels E and F)]. (A-E) Error bars represent SEM.
Treg-modulated microglial responses require factor secretion and cell contact
To determine whether Treg-mediated attenuation of microglial inflammation depends on T cell-microglia contact or on cytokine support, microglia were co-cultured with Treg either in transwell or with neutralizing antibodies to IL-10, TGF-β, or CTLA-4. After 24 h, inserts, antibodies, and Treg were removed and the microglia stimulated with N-α-syn for 24 h. Inhibition of IFN-γ secretion was not affected by physical contact, but was abrogated or reduced in the presence of neutralizing antibody to IL-10 and TGF-β, respectively (Fig. 2E). Suppression of TNF-α was partially reversed in the presence of neutralizing antibody for IL-10, TGF-β, or CTLA-4, but not in transwell cultures, whereas Inhibition of IL-12 production was dependent on both IL-10 and TGF-β. In contrast, inhibition of MCP-1 was seen in transwell cultures or with neutralizing antibody against IL-10, TGF-β, or CTLA-4 suggesting that both cell contact and soluble factors attenuate MCP-1 production. Suppression of IL-1α was dependent, in part, on cell contact and TGF-β, while inhibition of IL-1β was IL-10 dependent (Fig. 2F). Modulation of phagocytic activity of microglia was primarily dependent on cell contact and was reduced 12-fold in transwells compared to co-culture. Neither blockade of IL-10 nor CTLA-4 altered phagocytic function compared to co-culture, however inhibition of TGF-β resulted in a 2-fold reduction in FITC-gated cells compared to co-culture without antibody (P< 0.05) (data not shown).
Treg and the microglial proteome
To facilitate quantitative detection and to maximize identification of changes in the microglial proteome in response to N-α-syn following co-culture with Treg, microglial cell lysates were subjected to 2D-gel electrophoresis and LC-MS/MS proteomic analyses. Representative analytical 2D-gels and Decyder analyses are shown for cell lysates of N-α-syn stimulated microglia compared with unstimulated controls (Fig. 3A). In comparison to N-α-syn stimulated microglia, co-culture with Treg prior to stimulation resulted in a different proteomic profile (Fig. 3B), as did co-culture with Treg post-activation (Fig. 3C). Analysis was performed on analytical gels from separate lysates comparing microglia cultures stimulated with media alone, N-α-syn, or co-cultured with Treg by BVA software to identify differentially expressed proteins (P≤ 0.05). Proteomic analyses of N-α-syn/Teff co-cultures versus N-α-syn stimulation alone following pre- and post-treatment was also performed (data not shown) to facilitate cross-comparisons between treatments by BVA. All analytical gels were cross-compared by BVA and matched to a preparative gel consisting of pooled protein from the experimental groups (Fig. S2). Identified spots were compared for area and peak height (3D plots) by BVA. Western blots and densitometry confirmed differential expression of several proteins including L-plastin (+1.5 fold), ferritin light chain (+1.3 fold) and peroxiredoxin 1 (+1.5 fold), and cathepsin D (−2.0 fold) in microglial lysates following pre-treatment with Treg compared to stimulated with N-α-syn alone (Fig. 3D).
FIGURE 3.

Analysis of microglial proteome. (A) Flourescence 2D DIGE and Decyder analysis of N-α-syn stimulated microglial cell lysates compared to unstimulated microglia. To assess phenotypic change following interaction with Treg, representative 2D gels and Decyder analysis was performed on microglial cell lysates assessing microglia co-cultured with CD3-activated Treg prior to stimulation with N-α-syn (B, pre-treatment) or added in tandem 12 h following the addition of N-α-syn to the cultures (C, post-treatment). (D) Western blots, and volumetric and area intensity plot analysis by BVA for select proteins identified by LC-MS/MS are shown for cell lysates of unstimulated, N-α-syn stimulated without or with pretreatment with Treg or Teff, and post-treatment with Treg or Teff: L-plastin [spot: 23], ferritin light chain [spot: 28], peroxiredoxin 1 [spot: 65], and cathepsin D [spot: 13] as shown in Fig. S2.
Among the proteomic changes induced by pre-treatment of microglia with Treg and compared to N-α-syn stimulated microglia, were decreased expression in several cytoskeletal proteins such as β-actin, vimentin, cofilin 1, and gelsolin, whose function is to regulate cell motility and vesicle transport. Treatment with Treg also resulted in increased expression of microglial proteins involved in exocytosis such as annexin A1 and annexin A4, and phagocytosis such as L-plastin. Stimulation with N-α-syn decreased expression of proteins associated with the ubiquitin-proteasome system (UPS) greater than 1.5-fold compared to unstimulated microglia, whereas pre-treatment with Treg increased expression of UPS-related proteins including proteasome subunit alpha type-2, proteasome subunit beta type-2, ubiquitin specific protease 19, and ubiquitin fusion degradation. Treatment with Treg also increased the expression of molecular chaperones including heat shock proteins (HSP) and calreticulin; most of which were decreased following stimulation with N-α-syn compared to unstimulated controls. Lysosomal proteases including cathepsins B and D were increased by N-α-syn stimulation alone, however microglia pre-treated with Treg showed decreased abundance of the same proteins. Regulatory proteins involved in cellular metabolism (transaldolase 1) and catabolism (α-mannosidase) were increased in Treg pre-treated cultures.
Changes in several proteins associated with mitochondrial function were observed as a result of stimulation with N-α-syn. Of interest, proteins of the electron transport chain (ETC), specifically complex V, involved in ATP synthesis were decreased in expression. Whereas, ETC proteins such as nicotinamide adenine dinucleotide dehydrogenase (ubiquinone) Fe-S protein-2 of complex I, cytochrome c oxidase of complex III, and the subunits that comprise the components of ATP synthase were increased by microglia in response to N-α-syn stimulation following Treg-pre-treatment. Changes in the mitochondrial response to Treg were not limited to proteins involved in cellular energetics, but included redox proteins, chaperones, and structural proteins. Other proteins increased as a result of treatment with Treg were mitochondrial redox proteins including peroxiredoxins, superoxide dismutase (SOD)2, thioredoxin 1, and catalase. In addition, cytoplasmic redox proteins were also increased including peroxiredoxin 1, SOD1, biliverdin reductase B, and glutaredoxin 1 (data not shown). Interestingly, all were decreased by N-α-syn stimulation compared to unstimulated controls.
For comparison of the microglial phenotype after commitment to activation by N-α-syn stimulation and modulation by CD3-activated T cells, microglia were first stimulated with N-α-syn for 12 h prior to the addition of Treg or Teff for an additional 24 h and the T cells removed prior to microglial cell lysis. Similar proteins were affected by post-treatment with Treg as with pre-treatment, interestingly some exhibited opposite expression patterns observed after pre-treatment with Treg. Western blot analysis and densitometry confirmed differential expression of L-plastin (−1.6 fold), ferritin light chain (+1.2 fold), peroxiredoxin 1 (+1.5 fold), and cathepsin D (+1.5 fold) by post-treatment with Treg compared to N-α-syn alone (Fig. 3D).
Akin to pre-treatment, post-treatment with Treg yielded increased redox-active protein expression by activated microglia including SOD1 and peroxiredoxins 1 and 5. Several proteins differentially expressed in the pre-treatment analysis were also identified in post-treatment analysis, but were opposite in direction including increased expression of structural proteins involved in cell motility, such as β-actin and γ-actin, decreased expression of mitochondrial proteins including ETC complex V, decreased expression in L-plastin. Induction of pro-apoptotic protein expression was observed including increased expression of apoptosis-associated speck-like protein containing a caspase recruitment domain, galectin 3, gelsolin, eukaryotic translation elongation factor 1, and cathepsins B and D. Decreased expression of proteins involved in cellular metabolism such as aldolase I and aldehyde dehydrogenase 2 was also observed in response to Treg post-treatment (data not shown).
Treg affect microglial oxidative stress
To validate that changes in expression of redox-active proteins accurately reflect changes in the oxidative balance of microglia, we measured oxidative stress levels in N-α-syn-activated microglia pre-treated with Treg or Teff. N-α-syn stimulated microglia consistently produced greater levels of H2O2 compared to unstimulated controls, whereas Treg pre-treatment of microglia diminished the levels of H2O2 (Fig. 4A and B). In contrast, pre-treatment with Teff exacerbated H2O2 production by microglia. Analysis of intracellular glutathione levels revealed that microglia stimulated with N-α-syn were depleted of intracellular glutathione, a key oxidative buffer in cells, following 24 h of stimulation as previously shown (24). However, pre-treatment with Treg buffered the loss of glutathione stores in stimulated microglia, whereas Teff provided no significant protection from glutathione loss (Fig. 4C). Western blot and densitometric analysis validated protein expression trends identified by proteomics for select redox-active proteins including thioredoxin 1 (+1.7 fold) (Fig. 4D), biliverdin reductase B (+1.8 fold) (Fig. 4E), HSP 70 (+1.4 fold) (Fig. 4F), and glutaredoxin 1 (+2.0 fold) (Fig. 4G).
FIGURE 4.

CD4+ T cells modulate microglial oxidative stress and cathepsin B activity. (A) Confocal photomicrographs of intracellular ROS production (green) in microglia after 90 min stimulation with media (CON) or N-α-syn without and with T cell pre-treatment (scale bar: 25 μm). (B) Mean fluorescence intensity (MFI) of ROS production per cell. (C) Microglial intracellular glutathione concentration following 24 h exposure to N-α-syn without and with T cell pre-treatment. [P < 0.01 compared to microglia cultured with amedia alone (CON), bN-α-syn, or cN-α-syn/Teff (panels B and C)]. Western blots of select redox-active proteins identified by LC-MS/MS including (D) thioredoxin (THX) 1 [spot: 49], (E) billiverdin reductase (BVR) B [spot: 34], (F) heat shock protein (HSP) 70 [spot: 3] and (G) glutaredoxin (GLU) 1 [spot: 64], as shown in Fig. S2. Cathepsin B (CB) activity (green) in microglia after stimulation with N-α-syn for 24 h is demonstrated by (H) fluorescence photomicrographs (scale bar: 25 μm) and (I) MFI analysis. [P < 0.05 compared with microglia cultured to amedia alone (CON), bN-α-syn, or cN-α-syn/Teff]. (J) Representative Western blot analysis of microglial lysates and culture supernatants for CB [spot: 27 (Fig. S2)] expression and re-probed with antibody against β-actin following pre-treatment with Treg or Teff and stimulation for 24 h with N-α-syn. (B, C, and I) Error bars represent SEM.
Treg modulate microglial cathepsin B activity
Treg pre-treatment revealed decreased expression of cellular proteases including cathepsin B (CB). Therefore, we investigated whether differential protein expression paralleled inhibition of CB enzymatic activity. N-α-syn stimulation of microglia for 24 h increased CB activity compared to unstimulated controls, whereas pre-treatment with Treg prior to stimulation diminished CB activity (Fig. 4H and I). In contrast, stimulated microglia pre-treated with Teff exhibited CB activity similar to that of N-α-syn stimulation alone. Western blot revealed increased abundance of CB both in cell lysates and culture supernatants of N-α-syn stimulated microglia compared to unstimulated controls and cultures pre-treated with either Treg or Teff, whereas pre-treatment with Treg diminished intracellular (−1.6 fold) and secreted (−1.8 fold) CB levels (Fig. 4J).
Pro-apoptotic Treg responses are mediated through Fas-FasL interactions
Evidence that Treg regulate inflammation through induction of apoptosis in activated effector cells, including monocytes/macrophages (35) (J. Liu, N. Gong, A. D. Reynolds, X. Huang, R. L. Mosley, and H. E. Gendelman, manuscript submitted), led us to investigate whether post-treatment with Treg induced microglial apoptosis. We monitored microglial cell viability using independent markers for apoptosis and cell viability: caspase-3 activation, MTT activity, and TUNEL. By Western blot, lysates from microglia cultured for 24 h in the presence of N-α-syn exhibited increased caspase-3 activation compared to unstimulated controls (Fig. 5A). Pre-treatment with Treg or Teff resulted in diminished caspase-3 activation in response to N-α-syn, whereas post-treatment with Treg or Teff increased levels of cleaved caspase-3 products. To confirm those results, analysis of active caspase-3 by flow cytometry revealed that pre-treatment of microglia with either Treg or Teff failed to significantly increase caspase-3 activation (Fig. 5B). In contrast, post-treatment with Treg, but not Teff, resulted in a significant increase in active caspase-3+ cells. In situ staining for active caspase-3+ cells revealed that post-treatment with Treg resulted in profound induction of active caspase-3 relative to any other treatment paradigm (Fig. 5C).
FIGURE 5.

Treg induce microglial apoptosis through Fas-FasL interactions. (A) Western blot for caspase-3 (pro-caspase 3 and cleaved) expression in microglial cell lysates from unstimulated (lane 1), N-α-syn-stimulated alone (lane 2) or pre-treated with Treg or Teff (lanes 3 and 4) or post-treated with Treg or Teff (lanes 5 and 6). (B) Flow cell analysis for mean fluorescence intensity (MFI) of active caspase-3 expression by microglia. [P< 0.05 compared to amedia alone and bN-α-syn stimulation] (C) Confocal photomicrographs and MFI for active caspase-3 (green) on a per cell basis (scale bar: 25 μm). [P < 0.01 compared to microglia cultured in amedia alone (CON), bN-α-syn stimulation alone, or cN-α-syn/Teff]. (D) Flow cell analysis for FasL expression by Treg or Teff immediately following isolation (naïve T cells), following CD3-activation (αCD3 T cells), and after co-culture with N-α-syn stimulated microglia for 24 h (post-co-culture). Mean percentages of FasL+CD4+ T cells shown (P < 0.05 compared to anaive T cells and bαCD3 T cells). (E) Flow cell analysis of Fas expression by microglia treated for 24 h without and with N-α-syn stimulation and T cell post-treatment. Percentages of Fas+ cells are shown [P < 0.05 compared to amedia alone, bN-α-syn stimulation alone, and cN-α-syn/Teff]. (F) MTT assay to assess microglial susceptibility to spontaneous- and anti-CD95 induced apoptosis after culture for 24 h in media alone, N-α-syn without or with T cell pre-treatment. [P < 0.05 compared to amedia alone, bN-α-syn stimulation alone, cN-α-syn/Teff, dmedia alone with anti-CD95 stimulation, eN-α-syn with anti-CD95 stimulation]. (G) TUNEL assay of microglia treated with media (CON), N-α-syn without and with post-treatment with Treg or Teff in the absence or presence of anti-FasL. Photomicrographs (scale bar: 25 μm) and MFI of TUNEL+ cells (green) normalized to the number of DAPI-stained nuclei (blue). FasL dependence in Treg-induced apoptosis of stimulated microglia was also assessed by (H) MTT assay and (I) caspase 3/7 activity assays. Values shown as a percentage of unstimulated controls (MTT) or MFI (caspase-3/7 activity). [P < 0.05 compared to amedia alone, bN-α-syn stimulation alone, cN-α-syn/Teff, dpost-treatment without anti-FasL (panels G, H, and I)]. (B-I) Error bars represent SEM.
To investigate the pro-apoptotic factors involved in the Treg effect on microglia, we assessed by flow cytometry the relative expression of Fas ligand (FasL) on Treg and Teff after fresh isolation (naïve), anti-CD3 activation, or after co-culture with N-α-syn stimulated microglia. Numbers of FasL+ Treg and Teff were increased following anti-CD3 activation (Fig. 5D). In comparison, co-culture with N-α-syn activated microglia induced over 80% of Treg to express FasL, whereas microglial co-culture had no significant additive effect on Teff. N-α-syn activation diminished Fas (CD95) expression by microglia, however co-culture of microglia with either activated T cell subset resulted in significant upregulation of Fas expression amongst activated microglia (Fig. 5E). Moreover, reduced expression of Fas by N-α-syn-stimulated microglia paralleled reduced susceptibility to anti-CD95 induced apoptosis compared to unstimulated controls (Fig. 5F). While pre-treatment with Treg did not reduce microglial viability, pre-treatment with Treg, but not Teff, restored susceptibility of N-α-syn-stimulated microglia to anti-CD95-induced apoptosis. In contrast, post-treatment with T cells resulted in significant apoptosis of microglia compared to unstimulated and N-α-syn-stimulated microglia, with Treg inducing over 2-fold increase in MFI of TUNEL+ microglia (Fig. 5G). T cell-mediated apoptosis of N-α-syn stimulated microglia was mediated through Fas-FasL interactions as anti-FasL returned levels of TUNEL staining to those of N-α-syn stimulated controls. These results were essentially confirmed by MTT assays of microglia showing reduction of microglial cell viability after post-treatment with Treg and Teff, and increased viability after blocking of Treg with anti-FasL (Fig. 5H). This apoptotic response was at least partially caspase-dependent as Treg and Teff post-treatment increased activation of caspase-3/7 in N-α-syn-stimulated microglia compared to controls, while incubation with anti-FasL partially blocked caspase activation (Fig. 5I).
Analysis of the N-α-syn microglial proteome following post-treatment with Treg revealed increased abundance of CB in cell lysates compared to N-α-syn stimulation alone. Treg-induced expression of CB was validated by western blot and densitometry analysis (+1.6 fold) (Fig. 6A). The role for CB activation in Treg-mediated microglial apoptosis was investigated using the cell permeable inhibitor of CB, CA-074ME. In situ staining for active caspase-3+ cells revealed that inhibition of CB partially diminished active caspase 3 expression following stimulation with N-α-syn (Fig. 6B). In comparison, CB inhibition during Treg post-treatment resulted in significant suppression of active caspase-3 expression relative to Treg post-treatment without CB inhibitor. Decreased active caspase 3 was also observed in Teff-treated cultures in response to CB inhibitor. Inhibition of CB partially inhibited loss of Treg-mediated N-α-syn microglial MTT activity, but had no significant affect on Teff-mediated cytotoxicity (Fig. 6C). Similarly, inhibition of CB diminished caspase-3/7 activation in N-α-syn-stimulated microglia treated in the presence or absence of Treg or Teff (Fig. 6D). Analysis by flow cytometry confirmed these observations as inhibition of CB diminished active caspase 3+ cells on average by 11.1 ± 0.5% in N-α-syn stimulated cultures (data not shown). Moreover, flow cytometric analysis revealed that neutralization of FasL during post-treatment resulted in decreased CB protein expression in Treg-treated microglia by 40.2 ± 4.0% (P< 0.05 compared to N-α-syn/Treg post-treatment), whereas blocking of FasL interactions produced no significant effect on diminishing CB expression in Teff-treated cultures (4.8 ± 1.7%). All together, these data support a role for the Fas-FasL pro-apoptotic pathway and the induction of CB to promote apoptosis in the effect of Treg post-stimulation on activated microglia.
FIGURE 6.
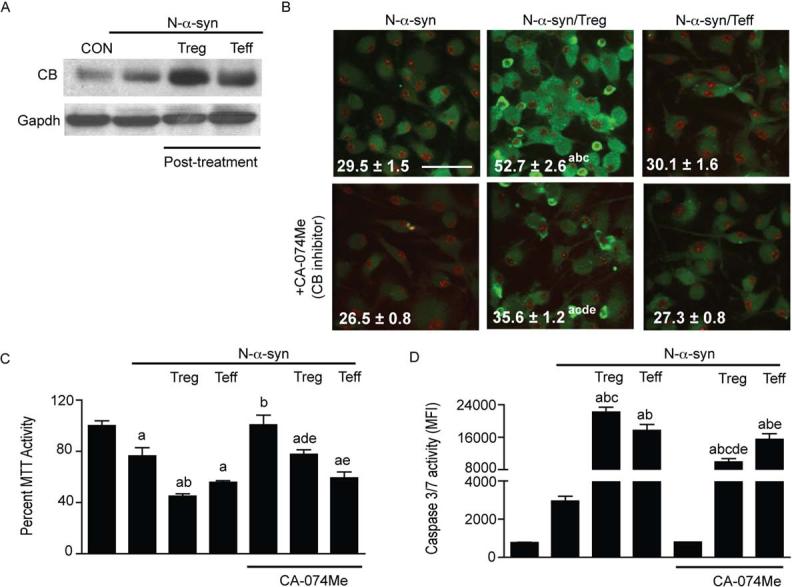
Cathepsin B regulates microglial apoptosis. (A) Western blot for cathepsin B (CB) and Gapdh expression in microglial cell lysates following treatment with media (CON), N-α-syn without and with Treg or Teff after N-α-syn stimulation (post-treatment). (B) Confocal photomicrographs (scale bar: 25 μm) and MFI per cell of active caspase 3 (green) expression in N-α-syn-stimulated microglia in the presence or absence of Treg or Teff in the absence or presence a cell permeable CB inhibitor [CA-074 Me]. The MTT assay (C) and caspase 3/7 activity assay (D) of microglia also revealed that inhibition of CB significantly diminished stimulation-induced apoptosis. Values shown are means (± SEM) of absorbance as a percentage of unstimulated controls (MTT) or MFI (caspase-3/7 activity). (P < 0.05 compared to amedia alone, bN-α-syn stimulation alone, cN-α-syn/Teff, dpost-treatment without CA-074Me, eN-α-syn with CA-074Me).
Discussion
We present a novel hypothesis for the pathogenesis of PD in that the adaptive immune system can modulate microglial inflammatory responses and as such affect the homeostatic environment of the brain (Fig. 7). In this way opposing immune regulatory responses as those affected by Treg or Teff could lead to divergent outcomes in the tempo and progression of disease. This is based on activation of microglial responses by aggregated and oxidized proteins, particularly α-syn. In early stages of disease where limited N-α-syn accumulates in the extracellular brain, the regulatory functions of the immune system predominate and microglial-induced inflammatory responses are controlled. This may occur by limited antigenic stimulae or by alterations in the microglial phenotypes (36). We posit that prior to onset of symptomatic disease (asymptomatic), adaptive immune responses, in which Treg predominate, are operative on microglia to attenuate microglial activation and neuroinflammatory responses. As a result reactive oxygen species (ROS) generation and the degenerative activities that occur subsequent to DA neuronal damage and release of α-syn from LB are controlled. At this stage of disease microglia are actively phagocytic and produce a broad spectrum of regulatory factors that principally maintain central nervous system (CNS) homeostasis. Therefore, aggregation and nitration of α-syn that accumulates in the extravascular space is limited. Such events preclude the development of potent adaptive neurodegenerative immune responses and the widespread, often adverse affects of oxidized and misfolded proteins. Regrettably, there are as yet no diagnostic biomarkers to confirm PD when few dopaminergic neurons are affected by disease. Although it is not clear if Treg is activated more in the early stage and Teff in the later stages of PD our data would support both ideas amongst another notion and that is Treg is active in early stage disease but is dysfunctional in the later stages. On balance, bioimaging data obtained from PD patients and animal models of human disease indicate that levels of activated mid-brain microglia correlate with diminished levels of dopamine transporters in the putamen and that microglial activation is increased with disease or lesion progression (37). During overt disease the presence of N-α-syn engages both innate and adaptive immune responses leading to losses in homeostatic function coupled to robust inflammatory and neurotoxic responses. During active disease, regulation of adaptive immunity breaks down and significantly influences control of the neural homeostatic environment (21, 38, 39). Moreover, changes in T cell populations in PD suggest that peripheral adaptive immune alterations and immune-related inflammation are important in disease pathogenesis (40). However, analysis of T cell subsets in PD and aged populations has yielded conflicting results with regards to CD4+CD25+ Treg numbers and function (40-42). Profound oxidative-associated damage and death of nigral DA neurons lead to increased release of α-syn with subsequent oxidation and misfolding. With increased exposure to N-α-syn, microglia become activated yielding a phenotype with reduced homeostatic activities and increased neurotoxic potential (23-25). During this phase, Treg engage activated microglia to induce apoptosis or affect a neurotrophic phenotype while showing a less robust affect on pro-inflammatory activities. Treg may also be, in part, reduced in numbers and/or function as a result of N-α-syn-mediated immunity. This results in more widespread nigrostriatal damage, recruitment of reactive immunocytes into brain, and pathogenic events that facilitate accelerated neuronal damage. In the aging rodent brain microglia show exaggerated neuroinflammatory responses that affect nitration of α-syn (43-45). In addition, such aged microglia may be less susceptible to Treg regulation than similar cells from neonates, as was used in the current studies. However, data obtained using bone-marrow derived macrophages from adult mice suggest that Treg can modulate aged macrophage activation responses to inflammatory stimuli including N-α-syn or HIV-1 (29) (J. Liu, N. Gong, A. D. Reynolds, X. Huang, R. L. Mosley, and H. E. Gendelman, manuscript submitted). Importantly, the effects of Treg on the macrophage activation and neurotoxicity can be recapitulated in human cells in response to inflammatory stimuli or viral human immunodeficiency virus infection (46) (our unpublished observation). However, changes in percentages, phenotype, TCR repertoire, and function of Treg may preclude these effects in the aging populations (42).
FIGURE 7.

CD4+ T cells in the prevention and pathogenesis of PD prior to onset of symptoms and during overt disease. T cell-mediated immune surveillance has been proposed that may account for a neurotrophic phenotype of resident microglia. The neurotrophic capacity of microglia could be attributed to increased phagocytic and proteasomal function for efficient clearance of misfolded proteins, elevated buffering capacity for oxidative stress, and increased bioenergetics (top panel). At onset of disease due to environmental toxins, age-associated immune dysregulation, or genetic predisposition α-syn becomes aggregated and contributes to microglial activation. The resulting inflammatory cascade then contributes to protein nitration and further aggregation ultimately inciting adaptive immune responses that is associated with PD pathogenesis. A compensatory response attributed to increased regulatory T cell numbers and function ensues to curtail the ongoing inflammatory reaction within the brain and serves to slow disease progression through cell-mediated destruction of activated microglia or conversion back to a homeostatic phenotype (bottom panel). This response however is not sufficient to ameliorate disease, and therefore results in a slowly progressive disease that persists in a chronic state.
Previous works demonstrate that Treg and Teff modulate microglial activation and affect neuroprotection in laboratory and animal models of PD (29), ALS (31), and HIV-associated neurocognitive disorders (30) (J. Liu, N. Gong, A. D. Reynolds, X. Huang, R. L. Mosley, and H. E. Gendelman, manuscript submitted). Previous studies revealed microglial activation within a few hours following MPTP-intoxication, prior to infiltration of CD4+ T cells (47), which may be linked in significant manner to accumulation of nitrated and aggregated α-syn and DA neuronal death (21, 43, 48). This inflammatory reaction then facilitates recruitment of adaptive immune responses to the brain that exacerbate microglial activation and DA neuron death (21). Surprisingly, adoptive transfer of CD3-activated Treg significantly attenuated such neurodegenerative responses (29). We therefore propose that Treg function to prevent robust microglial inflammation and promote DA survival through a concerted mechanism. First, by suppressing primary microglia activation through induction of apoptosis. Second, through modulation of adjacent microglia to suppress secondary activation in response to both innate and adaptive immunity. Third, inducing a microglial phenotype to promote DA survival. This is supported in other model systems including a murine model of HAD (J. Liu, N. Gong, A. D. Reynolds, X. Huang, R. L. Mosley, and H. E. Gendelman, manuscript submitted). Moreover, in vivo, Treg may modulate the adaptive immune responses within the nervous system.
Treg modulation of the N-α-syn-activated microglial proteome is linked to secretory, phagocytic, redox, and enzymatic cell functions. In a significant manner, Treg affected key microglial free radical clearance, glutamate metabolism, proteasome, and protease activities along with cell migration, vesicle transport, and bioenergetic function. These were substantive and paralleled diminished NF-κB activation and secretion of pro-inflammatory cytokines. As such, these results contrast what is well known concerning Treg effects on T cell proliferation in vitro, which requires cell-cell contact (49). Although the suggestion that a higher frequency of Treg could be linked to increased suppressive activity and accelerating neurodegeneration (41) is not supported by the current data set, the precise mechanism for immune regulation of disease remains a new and actively investigated area of study.
Macrophage NF-κB blockade decreases pro-inflammatory responses without affecting phagocytic function (50) and supports the current results. Treg diminished the pro-inflammatory response, and diminished ROS production was coincident with increased glutathione stores. These observations paralleled increased expression of redox-active proteins. The induction of antioxidants and their clearance of noxious oxygen free radicals provide new insights as to how Treg may control microglial neurotoxic responses in disease (51-53). Indeed, redox effects on neuronal function are implicated in a broad range of neurodegenerative diseases regardless of etiology (54-56). Thus, robust increases of 2-fold or greater in microglial biliverdin reductase B and glutaredoxin 1 amongst others suggest that Treg function to increase the cell's buffering capacity against oxidative stress.
Glutaredoxin 1 is important both for sustaining intracellular glutathione and for promoting mitochondrial respiration and oxidative phosphorylation (57). Downregulation of glutaredoxin 1 results in loss of glutathione and mitochondrial complex I activity (58). Moreover, environmental toxins that target mitochondria reproduce PD pathobiology such as DA neuronal loss and α-syn nitration and aggregation (21, 59). One example is the proneurotoxin MPTP, from which its metabolite, MPP+, engages complex I of the ETC and is linked to the formation of ROS (60, 61). Familial forms of PD are associated with mutations in the α-syn gene that influence cellular responses to mitochondrial stress (62). Under oxidative and metabolic stress conditions α-syn translocates from the cytosol to the mitochondrial surface and may play a direct role in mitochondrial physiology (63). Our results demonstrate that N-α-syn induced a functional decline of microglia mitochondrial function. Importantly, Treg promoted mitochondrial function and led to increases in proteins that are associated with the ETC, thus providing mechanisms for Treg-mediated neuroprotection for PD (29). Such findings support the notion that Treg affect mitochondrial respiration leading to an enhanced energetic efficiency of N-α-syn microglial mitochondria. Changes in free radical clearance mechanisms, including increased expression of peroxiredoxins and catalase, further strengthen Treg-induced enhancement of redox processes in N-α-syn stimulated microglia. Treg also regulated expression of HSPs, which affect protein import to the mitochondrial matrix. Overall, these data suggest that Treg enhance microglial mitochondrial functional capacity, decreasing the amount of oxidative stress that results from mitochondrial dysfunction.
Our results indicate that inhibition of oxidative stress is but one Treg neuromodulatory effect. Another is linked to diminished cathepsin activity. Indeed, cathepsin activity is increased in activated microglia and contributes to the their neurotoxic potential (64). In particular, CB is responsible, in part, for the terminal degradation of intracellular proteins (65). It has been implicated in a variety of inflammatory diseases and secretion of both pro-CB and CB by activated microglia leading to the induction of neuronal death (64). In support of this notion, CB inhibitors protect against microglial-mediated neurotoxicity (24, 64). We showed that Treg induced a greater than 2-fold decrease in CB in N-α-syn stimulated microglia along with decreased enzymatic activity, and may play an active role in attenuation of microglial neurotoxicity.
Treg pre-treatment also resulted in significant increases in proteins of the UPS in activated microglia. This is important to disease prevention as UPS functional inhibition of the UPS can affect the accumulation of ubiquinated proteins commonly seen in neurodegenerative diseases, and diminished UPS enzymatic activities are reported in PD (66). Moreover, diminished function of the UPS is linked to α-syn nitration and aggregation (67, 68). Increased UPS function induced by Treg may be either reflective of enhanced clearance mechanisms of misfolded proteins, or protection from decreased proteasome function by aberrant α-syn.
Whereas pre-treatment with Treg resulted in significant diminution of cyto/chemokine secretion, post-treatment analysis was more variable in its effects. Similar to pre-treatment, Treg suppressed the production of inflammatory mediators TNF-α, MCP-1, and IL-12. In contrast, production of IFN-γ was enhanced. Interestingly, IFN-γ was shown to mediate neuroprotective T cell responses (69). This result was coincident with previous reports suggesting that Treg act primarily on the afferent rather than the efferent end of the immune response.
Induction of apoptosis may be another mechanism by which Treg regulate microglial inflammation. Increased expression of the lysosomal proteases including cathepsins B and D may indicate that Treg induce autolysis (70). Our observation that Treg-mediated apoptosis of activated microglia is acting, in part, by Fas-FasL interactions correlates with previous reported studies demonstrating that Treg upregulate FasL expression through which they induce target APC apoptosis (35). Interestingly, N-α-syn stimulation induced transient resistant in microglia to Fas mediated apoptosis, that was reversed by Treg and not Teff, although both T cell subsets were shown in upregulate Fas expression on microglia. The effects of TNF-α were shown to increase cell resistance to Fas-mediated apoptosis (71). Therefore, one possible explanation is that Treg, more so than Teff, decreased TNF-α production by stimulated microglia resulting in increased susceptibility to Fas-mediated apoptosis.
Overall, our data suggest that interactions between Treg and microglia affect microglial processes with conversion of microglia from a neurotoxic to neuroprotective phenotype or induction of apoptosis. This change is multifunctional as the microglial response to stimuli can induce reversion to its original function in maintenance of homeostasis and prevention of neuronal damage. The ability of Treg to regulate microglial inflammation, cell function, and specific enzymatic activities provide novel tools to manipulate ongoing microglial inflammatory responses. In light of these, and previously published findings regarding T cell populations in PD, we now propose a model for disease with regards to a role for Treg in both the prevention and pathogenesis of PD. As such, these data support the use of therapeutics that take advantage of Treg responses within the brain or that target specific protein changes linked to reversion of a neurotoxic microglial phenotype to neurotrophic.
Supplementary Material
Acknowledgments
We thank Dr. Tong Wang, Michael Jacobsen, Eric Anderson, and Megan Marquardt for technical assistance, UNMC Cell Analysis Facility, and Dr. Pawel Ciborowski and Robin Taylor for critical reading of the manuscript.
Footnotes
Publisher's Disclaimer: This is an author-produced version of a manuscript accepted for publication in The Journal of Immunology (The JI). The American Association of Immunologists, Inc. (AAI), publisher of The JI, holds the copyright to this manuscript. This version of the manuscript has not yet been copyedited or subjected to editorial proofreading by The JI; hence, it may differ from the final version published in The JI (online and in print). AAI (The JI) is not liable for errors or omissions in this author-produced version of the manuscript or in any version derived from it by the U.S. National Institutes of Health or any other third party. The final, citable version of record can be found at www.jimmunol.org.
Supported by the Frances and Louie Blumkin Foundation, the Community Neuroscience Pride of Nebraska Research Initiative, the Alan Baer Charitable Trust (to H.E.G.), the UNMC Patterson Fellowship (to A.D.R.), and NIH grants 5P01NS31492, 2R37 NS36126, 2R01 NS034239, P20RR15635, U54NS43011, P01MH64570, and P01 NS43985 (to H.E.G.). The authors have no conflicts of interest to disclose.
References
- 1.Duda JE, Giasson BI, Chen Q, Gur TL, Hurtig HI, Stern MB, Gollomp SM, Ischiropoulos H, Lee VM, Trojanowski JQ. Widespread nitration of pathological inclusions in neurodegenerative synucleinopathies. Am J Pathol. 2000;157:1439–1445. doi: 10.1016/S0002-9440(10)64781-5. [DOI] [PMC free article] [PubMed] [Google Scholar]
- 2.Hurtig HI, Trojanowski JQ, Galvin J, Ewbank D, Schmidt ML, Lee VM, Clark CM, Glosser G, Stern MB, Gollomp SM, Arnold SE. Alpha-synuclein cortical Lewy bodies correlate with dementia in Parkinson's disease. Neurology. 2000;54:1916–1921. doi: 10.1212/wnl.54.10.1916. [DOI] [PubMed] [Google Scholar]
- 3.Giasson BI, Duda JE, Murray IV, Chen Q, Souza JM, Hurtig HI, Ischiropoulos H, Trojanowski JQ, Lee VM. Oxidative damage linked to neurodegeneration by selective alpha-synuclein nitration in synucleinopathy lesions. Science. 2000;290:985–989. doi: 10.1126/science.290.5493.985. [DOI] [PubMed] [Google Scholar]
- 4.Krishnan S, Chi EY, Wood SJ, Kendrick BS, Li C, Garzon-Rodriguez W, Wypych J, Randolph TW, Narhi LO, Biere AL, Citron M, Carpenter JF. Oxidative dimer formation is the critical rate-limiting step for Parkinson's disease alpha-synuclein fibrillogenesis. Biochemistry. 2003;42:829–837. doi: 10.1021/bi026528t. [DOI] [PubMed] [Google Scholar]
- 5.Paxinou E, Chen Q, Weisse M, Giasson BI, Norris EH, Rueter SM, Trojanowski JQ, Lee VM, Ischiropoulos H. Induction of alpha-synuclein aggregation by intracellular nitrative insult. J Neurosci. 2001;21:8053–8061. doi: 10.1523/JNEUROSCI.21-20-08053.2001. [DOI] [PMC free article] [PubMed] [Google Scholar]
- 6.Souza JM, Giasson BI, Chen Q, Lee VM, Ischiropoulos H. Dityrosine cross-linking promotes formation of stable alpha -synuclein polymers. Implication of nitrative and oxidative stress in the pathogenesis of neurodegenerative synucleinopathies. J Biol Chem. 2000;275:18344–18349. doi: 10.1074/jbc.M000206200. [DOI] [PubMed] [Google Scholar]
- 7.McGeer PL, Itagaki S, Boyes BE, McGeer EG. Reactive microglia are positive for HLA-DR in the substantia nigra of Parkinson's and Alzheimer's disease brains. Neurology. 1988;38:1285–1291. doi: 10.1212/wnl.38.8.1285. [DOI] [PubMed] [Google Scholar]
- 8.Cho BP, Sugama S, Shin DH, DeGiorgio LA, Kim SS, Kim YS, Lim SY, Park KC, Volpe BT, Cho S, Joh TH. Microglial phagocytosis of dopamine neurons at early phases of apoptosis. Cell Mol Neurobiol. 2003;23:551–560. doi: 10.1023/A:1025024129946. [DOI] [PMC free article] [PubMed] [Google Scholar]
- 9.Kohutnicka M, Lewandowska E, Kurkowska-Jastrzebska I, Czlonkowski A, Czlonkowska A. Microglial and astrocytic involvement in a murine model of Parkinson's disease induced by 1-methyl-4-phenyl-1,2,3,6-tetrahydropyridine (MPTP). Immunopharmacology. 1998;39:167–180. doi: 10.1016/s0162-3109(98)00022-8. [DOI] [PubMed] [Google Scholar]
- 10.Sugama S, Yang L, Cho BP, DeGiorgio LA, Lorenzl S, Albers DS, Beal MF, Volpe BT, Joh TH. Age-related microglial activation in 1-methyl-4-phenyl-1,2,3,6-tetrahydropyridine (MPTP)-induced dopaminergic neurodegeneration in C57BL/6 mice. Brain Res. 2003;964:288–294. doi: 10.1016/s0006-8993(02)04085-4. [DOI] [PubMed] [Google Scholar]
- 11.Jin J, Shie FS, Liu J, Wang Y, Davis J, Schantz AM, Montine KS, Montine TJ, Zhang J. Prostaglandin E2 receptor subtype 2 (EP2) regulates microglial activation and associated neurotoxicity induced by aggregated alpha-synuclein. J Neuroinflammation. 2007;4:2. doi: 10.1186/1742-2094-4-2. [DOI] [PMC free article] [PubMed] [Google Scholar]
- 12.Ling Z, Chang QA, Tong CW, Leurgans SE, Lipton JW, Carvey PM. Rotenone potentiates dopamine neuron loss in animals exposed to lipopolysaccharide prenatally. Exp Neurol. 2004;190:373–383. doi: 10.1016/j.expneurol.2004.08.006. [DOI] [PubMed] [Google Scholar]
- 13.Luo C, Rajput AH, Akhtar S, Rajput A. Alpha-synuclein and tyrosine hydroxylase expression in acute rotenone toxicity. Int J Mol Med. 2007;19:517–521. [PubMed] [Google Scholar]
- 14.Liu J, Zhou Y, Wang Y, Fong H, Murray TM, Zhang J. Identification of proteins involved in microglial endocytosis of alpha-synuclein. J Proteome Res. 2007;6:3614–3627. doi: 10.1021/pr0701512. [DOI] [PubMed] [Google Scholar]
- 15.McGeer PL, McGeer EG. Inflammation and neurodegeneration in Parkinson's disease. Parkinsonism Relat Disord. 2004;10(Suppl 1):S3–7. doi: 10.1016/j.parkreldis.2004.01.005. [DOI] [PubMed] [Google Scholar]
- 16.Teismann P, Tieu K, Choi DK, Wu DC, Naini A, Hunot S, Vila M, Jackson-Lewis V, Przedborski S. Cyclooxygenase-2 is instrumental in Parkinson's disease neurodegeneration. Proc Natl Acad Sci U S A. 2003;100:5473–5478. doi: 10.1073/pnas.0837397100. [DOI] [PMC free article] [PubMed] [Google Scholar]
- 17.Gao X, Hu X, Qian L, Yang S, Zhang W, Zhang D, Wu X, Fraser A, Wilson B, Flood PM, Block M, Hong JS. Formyl-methionyl-leucyl-phenylalanine-induced dopaminergic neurotoxicity via microglial activation: a mediator between peripheral infection and neurodegeneration? Environ Health Perspect. 2008;116:593–598. doi: 10.1289/ehp.11031. [DOI] [PMC free article] [PubMed] [Google Scholar]
- 18.Huang CF, Li G, Ma R, Sun SG, Chen JG. Thrombin-induced microglial activation contributes to the degeneration of nigral dopaminergic neurons in vivo. Neurosci Bull. 2008;24:66–72. doi: 10.1007/s12264-008-0066-x. [DOI] [PMC free article] [PubMed] [Google Scholar]
- 19.Stefanova N, Reindl M, Neumann M, Kahle PJ, Poewe W, Wenning GK. Microglial activation mediates neurodegeneration related to oligodendroglial alpha-synucleinopathy: implications for multiple system atrophy. Mov Disord. 2007;22:2196–2203. doi: 10.1002/mds.21671. [DOI] [PubMed] [Google Scholar]
- 20.Xiao Q, Zhao W, Beers DR, Yen AA, Xie W, Henkel JS, Appel SH. Mutant SOD1(G93A) microglia are more neurotoxic relative to wild-type microglia. J Neurochem. 2007;102:2008–2019. doi: 10.1111/j.1471-4159.2007.04677.x. [DOI] [PubMed] [Google Scholar]
- 21.Benner EJ, Banerjee R, Reynolds AD, Sherman S, Pisarev VM, Tsiperson V, Nemachek C, Ciborowski P, Przedborski S, Mosley RL, Gendelman HE. Nitrated alpha-synuclein immunity accelerates degeneration of nigral dopaminergic neurons. PLoS ONE. 2008;3:e1376. doi: 10.1371/journal.pone.0001376. [DOI] [PMC free article] [PubMed] [Google Scholar]
- 22.Hodara R, Norris EH, Giasson BI, Mishizen-Eberz AJ, Lynch DR, Lee VM, Ischiropoulos H. Functional consequences of alpha-synuclein tyrosine nitration: diminished binding to lipid vesicles and increased fibril formation. J Biol Chem. 2004;279:47746–47753. doi: 10.1074/jbc.M408906200. [DOI] [PubMed] [Google Scholar]
- 23.Reynolds AD, Glanzer JG, Kadiu I, Ricardo-Dukelow M, Chaudhuri A, Ciborowski P, Cerny R, Gelman B, Thomas MP, Mosley RL, Gendelman HE. Nitrated alpha-synuclein-activated microglial profiling for Parkinson's disease. J Neurochem. 2008;104:1504–1525. doi: 10.1111/j.1471-4159.2007.05087.x. [DOI] [PubMed] [Google Scholar]
- 24.Reynolds AD, Kadiu I, Garg SK, Glanzer JG, Nordgren T, Ciborowski P, Banerjee R, Gendelman HE. Nitrated alpha-synuclein and microglial neuroregulatory activities. J Neuroimmune Pharmacol. 2008;3:59–74. doi: 10.1007/s11481-008-9100-z. [DOI] [PMC free article] [PubMed] [Google Scholar]
- 25.Thomas MP, Chartrand K, Reynolds A, Vitvitsky V, Banerjee R, Gendelman HE. Ion channel blockade attenuates aggregated alpha synuclein induction of microglial reactive oxygen species: relevance for the pathogenesis of Parkinson's disease. J Neurochem. 2007;100:503–519. doi: 10.1111/j.1471-4159.2006.04315.x. [DOI] [PubMed] [Google Scholar]
- 26.Benner EJ, Mosley RL, Destache CJ, Lewis TB, Jackson-Lewis V, Gorantla S, Nemachek C, Green SR, Przedborski S, Gendelman HE. Therapeutic immunization protects dopaminergic neurons in a mouse model of Parkinson's disease. Proc Natl Acad Sci U S A. 2004;101:9435–9440. doi: 10.1073/pnas.0400569101. [DOI] [PMC free article] [PubMed] [Google Scholar]
- 27.Garg SK, Banerjee R, Kipnis J. Neuroprotective immunity: T cell-derived glutamate endows astrocytes with a neuroprotective phenotype. J Immunol. 2008;180:3866–3873. doi: 10.4049/jimmunol.180.6.3866. [DOI] [PubMed] [Google Scholar]
- 28.Laurie C, Reynolds A, Coskun O, Bowman E, Gendelman HE, Mosley RL. CD4+ T cells from Copolymer-1 immunized mice protect dopaminergic neurons in the 1-methyl-4-phenyl-1,2,3,6-tetrahydropyridine model of Parkinson's disease. J Neuroimmunol. 2007;183:60–68. doi: 10.1016/j.jneuroim.2006.11.009. [DOI] [PubMed] [Google Scholar]
- 29.Reynolds AD, Banerjee R, Liu J, Gendelman HE, Mosley RL. Neuroprotective activities of CD4+CD25+ regulatory T cells in an animal model of Parkinson's disease. J Leukoc Biol. 2007;82:1083–1094. doi: 10.1189/jlb.0507296. [DOI] [PubMed] [Google Scholar]
- 30.Gorantla S, Liu J, Wang T, Holguin A, Sneller HM, Dou H, Kipnis J, Poluektova L, Gendelman HE. Modulation of innate immunity by copolymer-1 leads to neuroprotection in murine HIV-1 encephalitis. Glia. 2008;56:223–232. doi: 10.1002/glia.20607. [DOI] [PMC free article] [PubMed] [Google Scholar]
- 31.Banerjee R, Mosley RL, Reynolds AD, Dhar A, Jackson-Lewis V, Gordon PH, Przedborski S, Gendelman HE. Adaptive immune neuroprotection in G93ASOD1 amyotrophic lateral sclerosis mice. PLoS ONE. 2008;3:e2740. doi: 10.1371/journal.pone.0002740. [DOI] [PMC free article] [PubMed] [Google Scholar]
- 32.Dobrenis K. Microglia in cell culture and in transplantation therapy for central nervous system disease. Methods. 1998;16:320–344. doi: 10.1006/meth.1998.0688. [DOI] [PubMed] [Google Scholar]
- 33.Enose Y, Destache CJ, Mack AL, Anderson JR, Ullrich F, Ciborowski PS, Gendelman HE. Proteomic fingerprints distinguish microglia, bone marrow, and spleen macrophage populations. Glia. 2005;51:161–172. doi: 10.1002/glia.20193. [DOI] [PubMed] [Google Scholar]
- 34.Rozek W, Ricardo-Dukelow M, Holloway S, Gendelman HE, Wojna V, Melendez LM, Ciborowski P. Cerebrospinal fluid proteomic profiling of HIV-1-infected patients with cognitive impairment. J Proteome Res. 2007;6:4189–4199. doi: 10.1021/pr070220c. [DOI] [PubMed] [Google Scholar]
- 35.Venet F, Pachot A, Debard AL, Bohe J, Bienvenu J, Lepape A, Powell WS, Monneret G. Human CD4+CD25+ regulatory T lymphocytes inhibit lipopolysaccharide-induced monocyte survival through a Fas/Fas ligand-dependent mechanism. J Immunol. 2006;177:6540–6547. doi: 10.4049/jimmunol.177.9.6540. [DOI] [PubMed] [Google Scholar]
- 36.Glanzer JG, Enose Y, Wang T, Kadiu I, Gong N, Rozek W, Liu J, Schlautman JD, Ciborowski PS, Thomas MP, Gendelman HE. Genomic and proteomic microglial profiling: pathways for neuroprotective inflammatory responses following nerve fragment clearance and activation. J Neurochem. 2007;102:627–645. doi: 10.1111/j.1471-4159.2007.04568.x. [DOI] [PubMed] [Google Scholar]
- 37.Ouchi Y, Yoshikawa E, Sekine Y, Futatsubashi M, Kanno T, Ogusu T, Torizuka T. Microglial activation and dopamine terminal loss in early Parkinson's disease. Ann Neurol. 2005;57:168–175. doi: 10.1002/ana.20338. [DOI] [PubMed] [Google Scholar]
- 38.Brochard V, Combadiere B, Prigent A, Laouar Y, Perrin A, Beray-Berthat V, Bonduelle O, Alvarez-Fischer D, Callebert J, Launay JM, Duyckaerts C, Flavell RA, Hirsch EC, Hunot S. Infiltration of CD4+ lymphocytes into the brain contributes to neurodegeneration in a mouse model of Parkinson disease. J Clin Invest. 2008 doi: 10.1172/JCI36470. in press. [DOI] [PMC free article] [PubMed] [Google Scholar]
- 39.Theodore S, Cao S, McLean PJ, Standaert DG. Targeted overexpression of human alpha-synuclein triggers microglial activation and an adaptive immune response in a mouse model of Parkinson disease. J Neuropathol Exp Neurol. 2008;67:1149–1158. doi: 10.1097/NEN.0b013e31818e5e99. [DOI] [PMC free article] [PubMed] [Google Scholar]
- 40.Baba Y, Kuroiwa A, Uitti RJ, Wszolek ZK, Yamada T. Alterations of T-lymphocyte populations in Parkinson disease. Parkinsonism Relat Disord. 2005;11:493–498. doi: 10.1016/j.parkreldis.2005.07.005. [DOI] [PubMed] [Google Scholar]
- 41.Rosenkranz D, Weyer S, Tolosa E, Gaenslen A, Berg D, Leyhe T, Gasser T, Stoltze L. Higher frequency of regulatory T cells in the elderly and increased suppressive activity in neurodegeneration. J Neuroimmunol. 2007;188:117–127. doi: 10.1016/j.jneuroim.2007.05.011. [DOI] [PubMed] [Google Scholar]
- 42.Zhao L, Sun L, Wang H, Ma H, Liu G, Zhao Y. Changes of CD4+CD25+Foxp3+ regulatory T cells in aged Balb/c mice. J Leukoc Biol. 2007;81:1386–1394. doi: 10.1189/jlb.0506364. [DOI] [PubMed] [Google Scholar]
- 43.Choi DY, Zhang J, Bing G. Aging enhances the neuroinflammatory response and alpha-synuclein nitration in rats. Neurobiol Aging. 2008 doi: 10.1016/j.neurobiolaging.2008.09.010. in press. [DOI] [PubMed] [Google Scholar]
- 44.Miller KR, Streit WJ. The effects of aging, injury and disease on microglial function: a case for cellular senescence. Neuron Glia Biol. 2007;3:245–253. doi: 10.1017/S1740925X08000136. [DOI] [PubMed] [Google Scholar]
- 45.Schell JB, Crane CA, Smith MF, Jr., Roberts MR. Differential ex vivo nitric oxide production by acutely isolated neonatal and adult microglia. J Neuroimmunol. 2007;189:75–87. doi: 10.1016/j.jneuroim.2007.07.004. [DOI] [PMC free article] [PubMed] [Google Scholar]
- 46.Tiemessen MM, Jagger AL, Evans HG, van Herwijnen MJ, John S, Taams LS. CD4+CD25+Foxp3+ regulatory T cells induce alternative activation of human monocytes/macrophages. Proc Natl Acad Sci U S A. 2007;104:19446–19451. doi: 10.1073/pnas.0706832104. [DOI] [PMC free article] [PubMed] [Google Scholar]
- 47.Kurkowska-Jastrzebska I, Wronska A, Kohutnicka M, Czlonkowski A, Czlonkowska A. MHC class II positive microglia and lymphocytic infiltration are present in the substantia nigra and striatum in mouse model of Parkinson's disease. Acta Neurobiol Exp (Wars) 1999;59:1–8. doi: 10.55782/ane-1999-1289. [DOI] [PubMed] [Google Scholar]
- 48.Gao HM, Kotzbauer PT, Uryu K, Leight S, Trojanowski JQ, Lee VM. Neuroinflammation and oxidation/nitration of alpha-synuclein linked to dopaminergic neurodegeneration. J Neurosci. 2008;28:7687–7698. doi: 10.1523/JNEUROSCI.0143-07.2008. [DOI] [PMC free article] [PubMed] [Google Scholar]
- 49.Field EH, Kulhankova K, Nasr ME. Natural Tregs, CD4+CD25+ inhibitory hybridomas, and their cell contact dependent suppression. Immunol Res. 2007;39:62–78. doi: 10.1007/s12026-007-0064-5. [DOI] [PubMed] [Google Scholar]
- 50.Groesdonk HV, Schlottmann S, Richter F, Georgieff M, Senftleben U. Escherichia coli prevents phagocytosis-induced death of macrophages via classical NF-kappaB signaling, a link to T-cell activation. Infect Immun. 2006;74:5989–6000. doi: 10.1128/IAI.00138-06. [DOI] [PMC free article] [PubMed] [Google Scholar]
- 51.Hsiao G, Fong TH, Tzu NH, Lin KH, Chou DS, Sheu JR. A potent antioxidant, lycopene, affords neuroprotection against microglia activation and focal cerebral ischemia in rats. In Vivo. 2004;18:351–356. [PubMed] [Google Scholar]
- 52.Wang JY, Wen LL, Huang YN, Chen YT, Ku MC. Dual effects of antioxidants in neurodegeneration: direct neuroprotection against oxidative stress and indirect protection via suppression of glia-mediated inflammation. Curr Pharm Des. 2006;12:3521–3533. doi: 10.2174/138161206778343109. [DOI] [PubMed] [Google Scholar]
- 53.Wu DC, Teismann P, Tieu K, Vila M, Jackson-Lewis V, Ischiropoulos H, Przedborski S. NADPH oxidase mediates oxidative stress in the 1-methyl-4-phenyl-1,2,3,6-tetrahydropyridine model of Parkinson's disease. Proc Natl Acad Sci U S A. 2003;100:6145–6150. doi: 10.1073/pnas.0937239100. [DOI] [PMC free article] [PubMed] [Google Scholar]
- 54.Butterfield DA, Poon HF, St Clair D, Keller JN, Pierce WM, Klein JB, Markesbery WR. Redox proteomics identification of oxidatively modified hippocampal proteins in mild cognitive impairment: insights into the development of Alzheimer's disease. Neurobiol Dis. 2006;22:223–232. doi: 10.1016/j.nbd.2005.11.002. [DOI] [PubMed] [Google Scholar]
- 55.Siciliano G, Piazza S, Carlesi C, Del Corona A, Franzini M, Pompella A, Malvaldi G, Mancuso M, Paolicchi A, Murri L. Antioxidant capacity and protein oxidation in cerebrospinal fluid of amyotrophic lateral sclerosis. J Neurol. 2007;254:575–580. doi: 10.1007/s00415-006-0301-1. [DOI] [PubMed] [Google Scholar]
- 56.Sultana R, Poon HF, Cai J, Pierce WM, Merchant M, Klein JB, Markesbery WR, Butterfield DA. Identification of nitrated proteins in Alzheimer's disease brain using a redox proteomics approach. Neurobiol Dis. 2006;22:76–87. doi: 10.1016/j.nbd.2005.10.004. [DOI] [PubMed] [Google Scholar]
- 57.Saeed U, Durgadoss L, Valli RK, Joshi DC, Joshi PG, Ravindranath V. Knockdown of cytosolic glutaredoxin 1 leads to loss of mitochondrial membrane potential: implication in neurodegenerative diseases. PLoS ONE. 2008;3:e2459. doi: 10.1371/journal.pone.0002459. [DOI] [PMC free article] [PubMed] [Google Scholar]
- 58.Pai HV, Starke DW, Lesnefsky EJ, Hoppel CL, Mieyal JJ. What is the functional significance of the unique location of glutaredoxin 1 (GRx1) in the intermembrane space of mitochondria? Antioxid Redox Signal. 2007;9:2027–2033. doi: 10.1089/ars.2007.1642. [DOI] [PubMed] [Google Scholar]
- 59.Wang YM, Pu P, Le WD. ATP depletion is the major cause of MPP+ induced dopamine neuronal death and worm lethality in alpha-synuclein transgenic C. elegans. Neurosci Bull. 2007;23:329–335. doi: 10.1007/s12264-007-0049-3. [DOI] [PMC free article] [PubMed] [Google Scholar]
- 60.Stack EC, Ferro JL, Kim J, Del Signore SJ, Goodrich S, Matson S, Hunt BB, Cormier K, Smith K, Matson WR, Ryu H, Ferrante RJ. Therapeutic attenuation of mitochondrial dysfunction and oxidative stress in neurotoxin models of Parkinson's disease. Biochim Biophys Acta. 2008;1782:151–162. doi: 10.1016/j.bbadis.2007.12.006. [DOI] [PubMed] [Google Scholar]
- 61.Kenchappa RS, Ravindranath V. Glutaredoxin is essential for maintenance of brain mitochondrial complex I: studies with MPTP. Faseb J. 2003;17:717–719. doi: 10.1096/fj.02-0771fje. [DOI] [PubMed] [Google Scholar]
- 62.Martin LJ, Pan Y, Price AC, Sterling W, Copeland NG, Jenkins NA, Price DL, Lee MK. Parkinson's disease alpha-synuclein transgenic mice develop neuronal mitochondrial degeneration and cell death. J Neurosci. 2006;26:41–50. doi: 10.1523/JNEUROSCI.4308-05.2006. [DOI] [PMC free article] [PubMed] [Google Scholar]
- 63.Cole NB, Dieuliis D, Leo P, Mitchell DC, Nussbaum RL. Mitochondrial translocation of alpha-synuclein is promoted by intracellular acidification. Exp Cell Res. 2008;314:2076–2089. doi: 10.1016/j.yexcr.2008.03.012. [DOI] [PMC free article] [PubMed] [Google Scholar]
- 64.Gan L, Ye S, Chu A, Anton K, Yi S, Vincent VA, von Schack D, Chin D, Murray J, Lohr S, Patthy L, Gonzalez-Zulueta M, Nikolich K, Urfer R. Identification of cathepsin B as a mediator of neuronal death induced by Abeta-activated microglial cells using a functional genomics approach. J Biol Chem. 2004;279:5565–5572. doi: 10.1074/jbc.M306183200. [DOI] [PubMed] [Google Scholar]
- 65.Reinheckel T, Deussing J, Roth W, Peters C. Towards specific functions of lysosomal cysteine peptidases: phenotypes of mice deficient for cathepsin B or cathepsin L. Biol Chem. 2001;382:735–741. doi: 10.1515/BC.2001.089. [DOI] [PubMed] [Google Scholar]
- 66.McNaught KS, Mytilineou C, Jnobaptiste R, Yabut J, Shashidharan P, Jennert P, Olanow CW. Impairment of the ubiquitin-proteasome system causes dopaminergic cell death and inclusion body formation in ventral mesencephalic cultures. J Neurochem. 2002;81:301–306. doi: 10.1046/j.1471-4159.2002.00821.x. [DOI] [PubMed] [Google Scholar]
- 67.Hyun DH, Lee M, Halliwell B, Jenner P. Proteasomal inhibition causes the formation of protein aggregates containing a wide range of proteins, including nitrated proteins. J Neurochem. 2003;86:363–373. doi: 10.1046/j.1471-4159.2003.01841.x. [DOI] [PubMed] [Google Scholar]
- 68.Miwa H, Kubo T, Suzuki A, Kondo T. Intragastric proteasome inhibition induces alpha-synuclein-immunopositive aggregations in neurons in the dorsal motor nucleus of the vagus in rats. Neurosci Lett. 2006;401:146–149. doi: 10.1016/j.neulet.2006.03.003. [DOI] [PubMed] [Google Scholar]
- 69.Wang Y, Li M, Song M, Xu X, Xiong J, Yang X, Tan J, Bai Y. Expression of OX40 ligand in microglia activated by IFN-gamma sustains a protective CD4(+) T-cell response in vitro. Cell Immunol. 2008;251:86–92. doi: 10.1016/j.cellimm.2008.04.002. [DOI] [PubMed] [Google Scholar]
- 70.Bird PI. Regulation of pro-apoptotic leucocyte granule serine proteinases by intracellular serpins. Immunol Cell Biol. 1999;77:47–57. doi: 10.1046/j.1440-1711.1999.00787.x. [DOI] [PubMed] [Google Scholar]
- 71.Qin Y, Auh S, Blokh L, Long C, Gagnon I, Hamann KJ. TNF-alpha induces transient resistance to Fas-induced apoptosis in eosinophilic acute myeloid leukemia cells. Cell Mol Immunol. 2007;4:43–52. [PubMed] [Google Scholar]
Associated Data
This section collects any data citations, data availability statements, or supplementary materials included in this article.