Abstract
The transcriptional regulatory network governing the establishment of retinal neuron diversity is not well delineated. We report experimental results suggesting proneural gene neurogenin3 (ngn3) participating in this regulatory network. Retinal expression of chick ngn3 was confined to early neurogenesis. Overexpression of ngn3 in chick retina reduced cell proliferation and expanded the population of ganglion cells into the territory normally occupied by amacrine cells. Ngn3 overexpression altered the expression of a number of regulatory genes, including ash1, ath3, ath5, chx10, neuroD, ngn1, ngn2, and NSCL1. Early gene ngn1 was induced, but ash1, ngn2, ath3, and chx10, whose expressions persist through later phases of neurogenesis, were down-regulated. Expression of ath5 was up-regulated at the locale corresponding to young ganglion cells, but was down-regulated at the locale corresponding to progenitor cells. These results suggest that ngn3 regulates retinal neurogenesis by inducing regulatory genes for early-born neurons and repressing those for later-born cells.
Keywords: Transcriptional regulation, bHLH proneural gene, Retinal neurogenesis, Retinal ganglion cells
Introduction
It is unclear how the vertebrate retina achieves a balanced production of its diverse cell types, although the genesis of the different types of cells is known to progress in a stereotyped temporal and spatial order that is conserved among vertebrates (Adler, 2000). Retinal ganglion cells are born first, followed by horizontal cells, cone photoreceptors, amacrine cells, rod photoreceptors, bipolar neurons, and finally Müller glia (Rapaport et al., 2004). Spatially, newborn cells accumulate at their prospective locations, and as the retina matures, they organize into a well defined laminar structure and establish a complex neural circuitry communicating the visual signals initiated by photoreceptors to the brain through the axons of ganglion cells. Studies show that proliferating progenitor cells have some flexibility in adopting a final fate. For example, selective ablation of one neuronal cell type causes more progenitors to adopt that particular fate (Raymond, 1991; Reh, 1991). In addition, early born neurons influence future cell production (Waid and McLoon, 1998; Zhang and Yang, 2001), possibly by affecting progenitor cell proliferation (Mu et al., 2005). At the same time, experiments demonstrate that retinal progenitors show intrinsic variations in their fate potentials (Braisted et al., 1994; Belliveau et al., 2000; Cayouette et al., 2003). Furthermore, lineage-bias (Huang and Moody, 1997; Alexiades and Cepko, 1997) and lineage-dependence (Otteson and Hitchcock, 2003) have been demonstrated. The transcriptional regulatory mechanisms that direct the seemingly rigid yet flexible genesis of neural diversity, and thus ensure a balanced production of the different types of retinal cells, are largely unknown.
Genes encoding the basic helix–loop–helix (bHLH) family of transcriptional factors homologous to the Drosophila proneural genes achaete-scute and atonal play important roles in the generation of neuronal diversity in both the central and the peripheral nervous systems (CNS and PNS). Retinal neurogenesis employs several proneural genes, such as achaete-scute homologue 1 (ash1), atonal homologue 3 (ath3), ath5, neuroD, neurogenin2 (ngn2), NSCL1, and NSCL2 (for reviews, see Vetter and Brown, 2001; Yan et al., 2005).
The mammalian ngn subfamily currently has three members; all are expressed in the developing CNS and PNS (Sommer et al., 1996). Ngn1 and ngn2 are well studied in neural development. Ngn3, on the other hand, is mostly known as a proendocrine factor that determines which precursor cells will become insulin-producing endocrine cells of the islets of Langerhans in the developing pancreas. Reports on ngn3's role in the development of the nervous system are limited. In rodents, ngn3 is expressed in glial precursors in the developing spinal cord (Liu et al., 2002) and regulates glial differentiation (Lee et al., 2003).
We have identified a chick bHLH gene homologous to mammalian ngn3. We found that retinal expression of chick ngn3 was transient and restricted to early neurogenesis. Overexpression of ngn3 affected the expression of a number of regulatory genes: those for early born neurons were up-regulated and those for later born cells were down-regulated. Furthermore, ngn3 altered the expression of regulatory genes in a complex manner, not only activating or repressing specific genes, but also activating and repressing the same gene depending upon the anatomical location. Our study indicates that ngn3 regulates retinal neurogenesis at an early point of an intricate transcriptional network that links diverse cell types in the developing retina.
Results
Ngn3 was transiently expressed in early retinal development
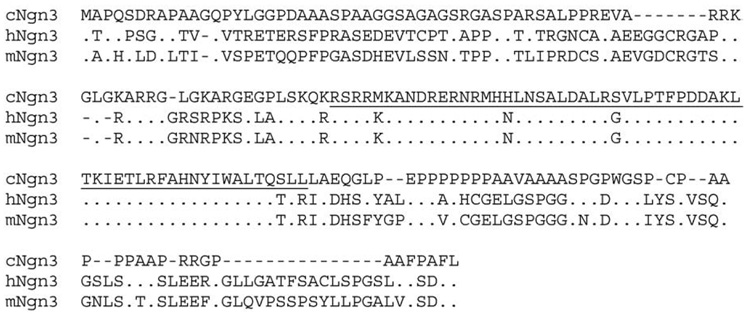
When mouse ngn3 was used as a query to BLAST search the chick genome, the highest sequence identity (85%) was found to a single locus. This locus contained a bHLH domain that was 91% identical to mouse and human Ngn3 (Fig. 1). The full-length polypeptide deduced from the corresponding open reading frame consisted of 186 amino acids and shared 52% overall identity with mouse and human Ngn3 proteins. Because a Blastp search in NCBI's non-redundant database with the chick polypeptide showed Ngn3s from different species as the most homologous sequences (with next in line being Ngn2s from various species), the chick sequence was referred to as chick ngn3.
Fig. 1.
The deduced amino acid sequence of chick ngn3 (cNgn3) and its alignment with human Ngn3 (hNgn3) and mouse Ngn3 (mNgn3). Gaps, indicated by hyphens, are introduced for optimal sequence identities. Dots indicate identical residues in hNgn3 and mNgn3 to that in cNgn3, and the bHLH domain is underlined.
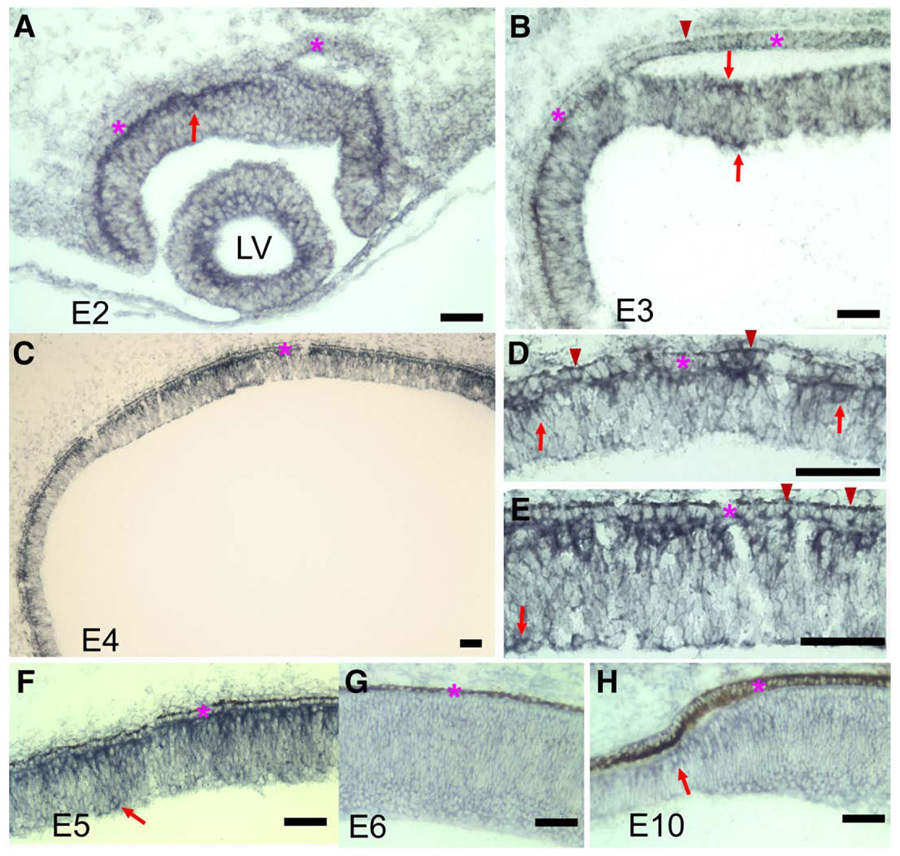
In situ hybridization was carried out to examine ngn3 expression in the developing chick retina. Considering that retinal neurogenesis is mostly active between embryonic day 4 (E4) and E7, we first examined ngn3 expression during these stages. At E4, ngn3 expression was detected in cells localized to the outermost portion of the neuroepithelium (Figs. 2C–E), with a few found in the prospective location of ganglion cells (Fig. 2E, arrow). This pattern of expression was observed in the peripheral region (Fig. 2D) and the central region (Fig. 2E) and in E5 retina (Fig. 2F). By E6, ngn3 expression became undetectable (Fig. 2G), except at the periphery, where development lags behind. In the peripheral retina at E10, only a few cells at the tip of the retinal neuroepithelium showed detectable ngn3 expression, and these cells, like those expressed in E4 and E5 retinas, localized to the RPE side (Fig. 2H). To determine whether the spatially defined expression also occurred in retina younger than E4, we subsequently examined ngn3 expression in retinas of E2 and E3. Expression of ngn3 was detected in E2 retina, in cells confined to the apical side of the retinal neuroepithelium (Fig. 2A, arrow). At E3, some ngn3-expressing cells localized to the vitreal side where prospective ganglion cells reside, while others remained on the RPE side (Fig. 2B, arrows). Expression of ngn3 was also detected in the RPE (Figs. 2B, D, E, arrowheads).
Fig. 2.
The expression of ngn3 in the developing chick retina detected with in situ hybridization. (A, B) Cross-sections of an E2 eye (A) and an E3 eye (B). Arrows points to ngn3-expressing cells in the retina. Arrowhead points to a ngn3-expressing cell in the RPE. (C) E4 retinal neuroepithelium. (D) Higher magnification of a peripheral region of E4. Arrows point to ngn3-expressing cells in the retinal neuroepithelium. Arrowheads point to ngn3-expressing cells in the RPE. (E) Higher magnification of central region of E4. Arrow points to a ngn3-expressing cell in prospective ganglion cell layer. Arrowheads point to ngn3-expressing cells in the RPE. (F) E5 retinal neuroepithelium. Arrow points to a ngn3-expressing cell in the prospective ganglion cell layer. (G) E6 central retina. (H) the peripheral retina at E10. Arrow points to a ngn3-expressing cell at the tip of peripheral retina. The RPE layer is indicated by an asterisk. LV: the lens vesicle. Scale bars: 50 µm.
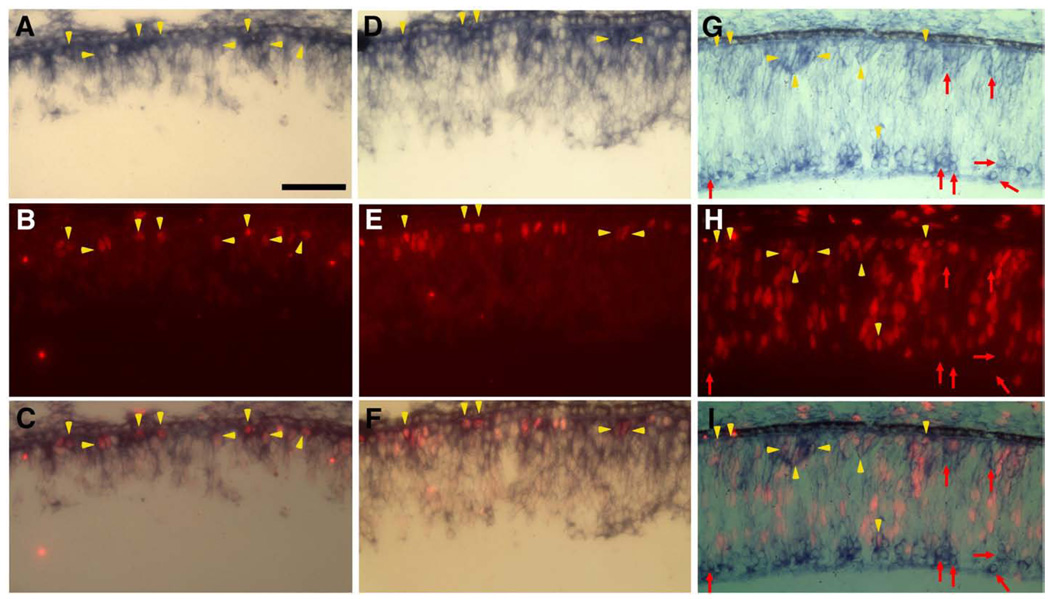
The location of ngn3-exprssing cells on the apical side of the retinal neuroepithelium coincided with where M-phase cells reside. To examine whether cells undergoing mitosis (M-phase) expressed ngn3, double-labeling for ngn3 mRNA and for phosphorylated histone H3 was carried out. Double-labeled cells were detected at E4 (Figs. 3A–C, arrowheads) and in E5 retina (Figs. 3D–F, arrowheads), when cell proliferation activity increases.
Fig. 3.
Double-labeling for ngn3 expression and cell proliferation. (A–F) Double-labeling for ngn3mRNA (blue) and phosphoH3 (red) in E4 retina (A–C) and E5 retina (D–F). (A, D) In situ hybridization for ngn3 mRNA. (B, E) Immunostaining for phosphoH3. (C, F) Simultaneous view of both. Yellow arrowheads point to double-labeled cells (ngn3 mRNA+/phospoH3+). (G–I) Double-labeling for ngn3mRNA (blue) and BrdU incorporation (red) in E5 retina. (G) In situ hybridization for ngn3mRNA. (H) immunostaining for BrdU incorporation. (I) Simultaneous view of both. Red arrows point to ngn3-expressing cells that lacked BrdU incorporation. Yellow arrowheads point to double-labeled cells (ngn3 mRNA+/BrdU+). Scale bars: 50 µm.
Double-labeling for ngn3 expression and BrdU incorporation was carried out to determine whether ngn3-expressing cells were mostly postmitotic. Double-labeled cells were observed (Figs. 3G–I, arrowheads). The majority of the double-labeled cells localized to the outer most portion, where it accounted for more than 50% of ngn3-expressing cells, indicating that at least half of the ngn3-expressing cells at this location were still in the cell cycle. On the vitreal side, fewer than 10% of ngn3-expressing cells were BrdU+.
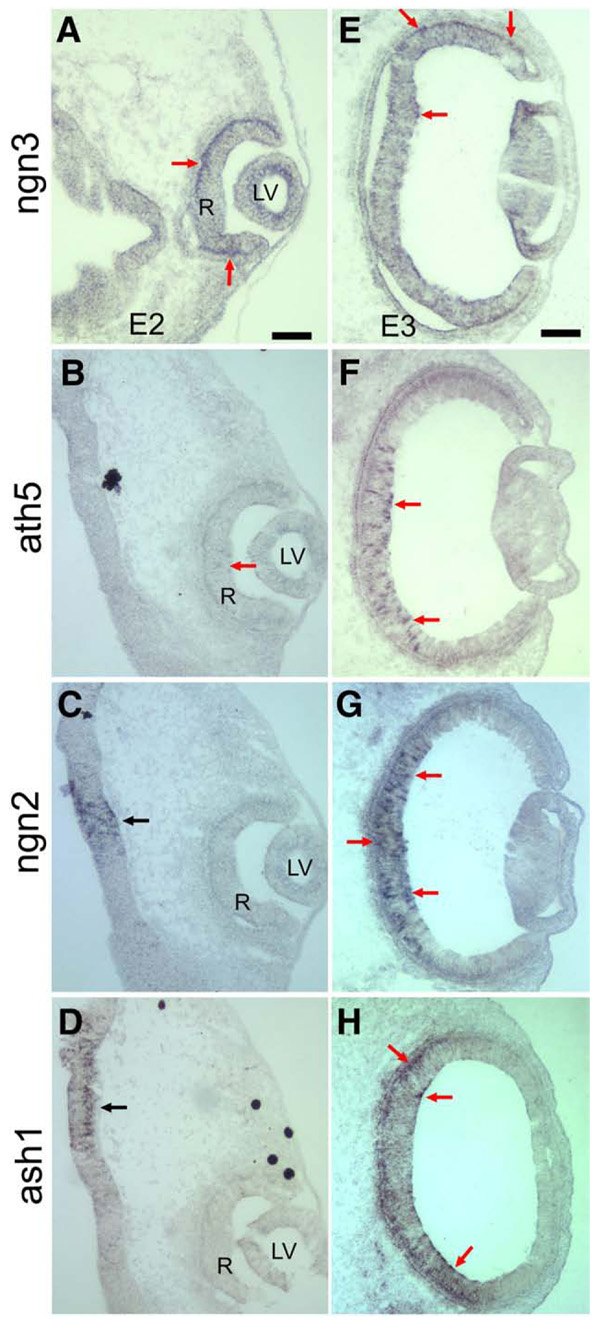
The retinal neurogenesis involves several bHLH genes, such as ath5, ngn2, and ash1 (Matter-Sadzinski et al., 2005; Vetter and Brown, 2001; Yan et al., 2005). To facilitate an understanding of how ngn3 related to these bHLH genes, we compared the spatial pattern of ngn3 expression with that of ath5, ngn2, and ash1 using serial sections of E2 and E3 chick heads. While retinal expression of ngn3 was detected in cells mostly localized to the apical side at E2 (Fig. 4A), expression of ath5 at this early stage was detected only in a few cells in the central region within the retina (Fig. 4B, arrow). Expressions of ngn2 (Fig. 4C) and ash1 (Fig. 4D) at E2 were not detected in the E2 retina, even though their expression was evident in discrete domains of the developing brain (Figs. 4C, D, arrows). In E3 retina, while ngn3 expression was visible in cells either at the RPE side or on the vitreal side in both central and periphery regions (Fig. 4E), the expression of ath5, ngn2, and ash1 was detected in cells of the central region (Figs. 4F–H) within the retinal neuroepithelium. The difference in the spatial patterns of expression indicated that ngn3-exprssing cells belonged to a sub-population different from the ath5-, ngn2-, or ash1-expressing cells. The evident expression of ngn3 in E2 retina and at the peripheral region of E3 retina suggested an earlier expression of ngn3 than that of ath5, ngn2, and ash1.
Fig. 4.
A comparison of the expression of ngn3 with the expression of ath5, ngn2, and ash1. (A–D) Serial sections of an E2 embryo showing the expression of ngn3 (A), ath5 (B), ngn2 (C), and ash1 (D). Red arrows point to cells in the retinal neuroepithelium expressing the genes. (E–G) Expression of ngn3 (E), ath5 (F), ngn2 (G), and ash1 (H) in cross-sections of E3 eye. Arrows point to cells expressing the genes. LV: lens vesicle. R: retinal neuroepithelium. Scale bars: 100 µm.
Ngn3 overexpression altered retinal neurogenesis
Replication-competent retrovirus RCAS was used to drive overexpression and ectopic expression of ngn3 in chick embryos. Concentrated virus was microinjected into the subretinal space, which is still connected with the neural tube at E2. This procedure produces widespread infection within and outside the nervous tissues of the embryo (Yan and Wang, 2001), as a result of both primary infections and subsequent infections by virus released from infected cells. The widespread RCAS viral infection and transduction do not affect retinal development; we have observed no abnormalities either at the gross level or at the microscopic level from hundreds of embryos infected with RCAS or RCAS-GFP (Yan and Wang, 2001; Li et al., 2002; our unpublished data). Embryos receiving RCAS-ngn3 survived to E6, but nearly all died between E7 and E8. Out of more than 100 embryos, one survived to E8, and this surviving embryo was found to have limited RCAS-ngn3 infection.
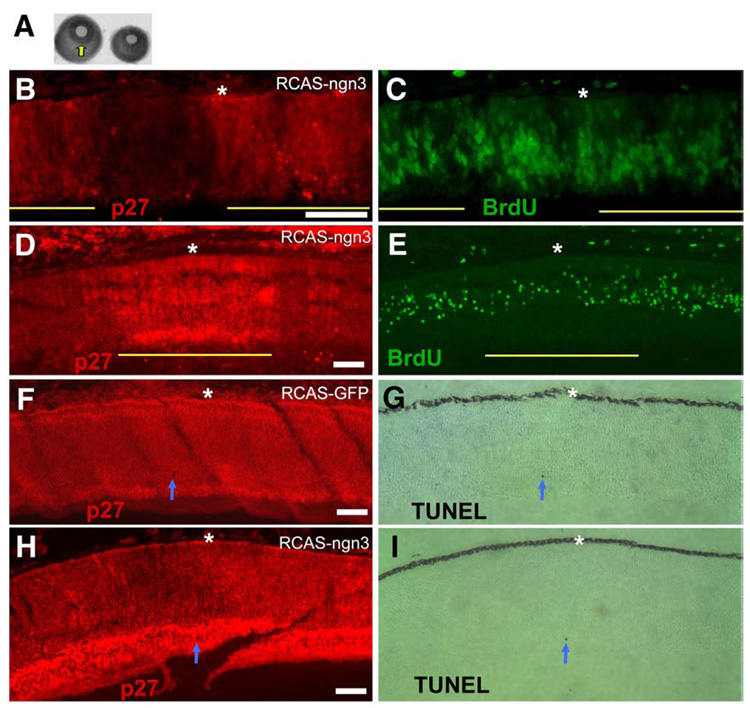
Overexpression of ngn3 resulted in small eyes (Fig. 5A). Small eyes were observed in >95% of the embryos receiving RCAS-ngn3 (n ≥ 100), including dead or dying ones. On average, the total number of cells in an E7.5 retina from RCAS-ngn3 infected embryo was reduced to ~50% of that in the control infected with RCAS-GFP. No small eye was observed with similar overexpression of bHLH genes neuroD (Yan and Wang, 1998) and NSCL2 (Li et al., 2001) or with similar overexpression of more than 10 homeodomain genes (Li et al., 2002; our unpublished data). To determine whether the small eye from ngn3 overexpression was due to enhanced cell death, or reduced cell proliferation, or both, BrdU incorporation and TUNEL assay were carried out. To minimize ambiguities arising from comparing retinas of varied cell proliferation activities due to difference in developmental stages, we compared the number of BrdU+ cells in regions infected by RCAS-ngn3 with adjacent, uninfected regions on the same retinal section. We found that the infected regions contained fewer BrdU+ cells in comparison with the internal control (the adjacent, uninfected region) in E7.5 retina (Figs. 5D, E). On average (10 areas of similar size), the number of BrdU+ cells was reduced by more than 60% in infected region. Reduction of BrdU+ cells was also evident at an early stage, E5 (Figs. 5B, C).
Fig. 5.
Analyses of cell proliferation with BrdU incorporation and of apoptosis with TUNEL assay of retinas infected with RCSA-ngn3. (A) Comparison of the eye size at E7.5 between a normal (left) and an experimental eye (right). Arrow points to the well-formed iris, which is missing in the experimental eye. (B, C) Double-labeling for an RCAS viral protein, p27 (B) and for BrdU incorporation (C) of an E5 retina with partial infection by RCAS-ngn3. The anti-p27 staining was used to identify regions, indicated by yellow lines, which were infected by the virus. (D, E) Double-labeling for the viral protein p27 (D) and for BrdU incorporation (E) of an E7.5 retina with partial infection by RCAS-ngn3. Yellow line indicates the infected region. (F, G) Double-labeling for the viral protein p27 (F) and for TUNEL+ cells (G) of an E7.5 retina infected with RCAS-GFP. Arrow points to a TUNEL+ cell. (H, I) Double-labeling for the viral protein p27 (H) and for TUNEL+ cells (I) of an E7.5 retina infected with RCAS-ngn3. Arrow points to a TUNEL+ cell. Scale bars: 50 µm.
In normal retina, few cells are TUNEL+ before E10, when developmental ganglion cell death commences (Cook et al., 1998). In E7.5 retinas infected with either RCAS-GFP (Figs. 5F, G) or RCAS-ngn3 (Figs. 5H, I), the number of TUNEL+ cells was very low. From a total of 7 retinal cross-sections, 5 cells were found TUNEL+ in retina infected with RCAS-ngn3, while 4 were TUNEL+ in the control infected with RCAS-GFP.
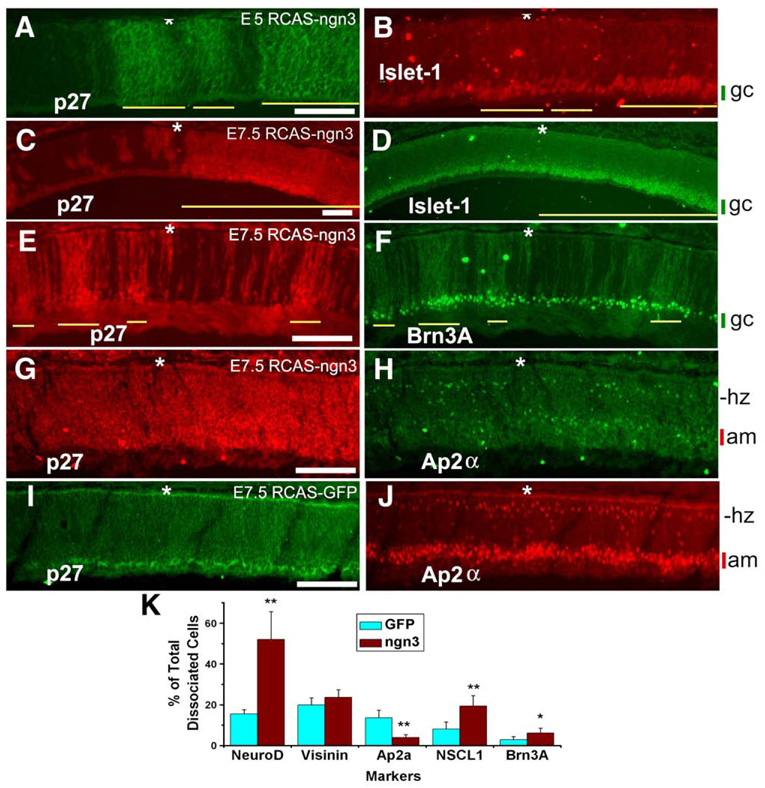
Analyses of the cellular composition with specific markers showed altered retinal neurogenesis. The domain of cells expressing ganglion cell markers Islet-1 and Brn3A was expanded, and the expansion was observed with all embryos examined that showed nearly complete viral infections (n ≥ 5). To avoid ambiguities from comparing different retinal sections that potentially differed in sectioning angle as well as in developmental stage, we used adjacent, uninfected regions in the same retinal section as internal controls. Within the regions infected with RCAS-ngn3, Islet-1+ domain was expanded in comparison with the adjacent, uninfected region, and the expansion was evident at E5 (Figs. 6A, B) and E7.5 (Figs. 6C, D). The extent of expansion varied, from discernible thickening of this particular cell layer to its occupying nearly 1/3 the thickness of the retina (Fig. 6D). The variation was attributed to varied amounts of Ngn3 protein accumulated in the infected cells as a function of variations in the time of viral infection and in the number of viral insertions into host chromosomes. Expansion of Brn3A+ domain was also observed in infection regions (Figs. 6E, F). Additionally, the domain of developing ganglion cells that transiently expressed ath5 and NSCL1 was also expanded (Fig. 7). In contrast to these expansions, domains of cells expressing amacrine cell markers Ap2α (Figs. 6G, H) and the vesicular inhibitory amino acid transporter (VIAAT, data not shown) were reduced in comparison to the control (Figs. 6I, J).
Fig. 6.
Alterations in retinal neurogenesis from ngn3 overexpression. (A, B) Double-labeling for RCAS viral protein p27 to identify infected regions (yellow line) by RCAS-ngn3 (A) and for Islet-1 (B) of E5 retina partially infected by the virus. (C, D) Double-labeling for viral protein p27 (C) and Islet-1 (D) of E7.5 retina partially infected with RCAS-ngn3. Yellow line indicates the infected region. (E, F) Double-labeling for viral protein p27 (E) and Brn3A (F) of E7.5 retina partially infected with RCAS-ngn3. Yellow line indicates the infected region. (G, H) Double-labeling for viral protein p27 (G) and Ap2α (H) of E7.5 retina infected with RCAS-ngn3. (I, J) Double-labeling for viral protein p27 (I) and Ap2α (J) of control E7.5 retina infected with RCAS-GFP. The cellular (presumably ganglion cells, gc) layer that increased in thickness upon ngn3 overexpression is marked by a green vertical bar, whereas the layer (presumably amacrine cells, am) with reduced thickness is marked by a red bar. The prospective location of horizontal cells (hz) is marked for convenience. The RPE layer is indicated by an asterisk. (K) A quantitative analysis of different cell populations using dissociated retinal cells from retinas infected with RCAS-GFP (GFP) or RCAS-ngn3 (ngn3). Shown are the means ± SDs of the calculated percentage of cells identified with each marker among dissociated E7.5 retinal cells. * and ** indicate statistical significance at 0.05 and 0.01 levels, respectively. Scale bars: 100 µm.
Fig. 7.
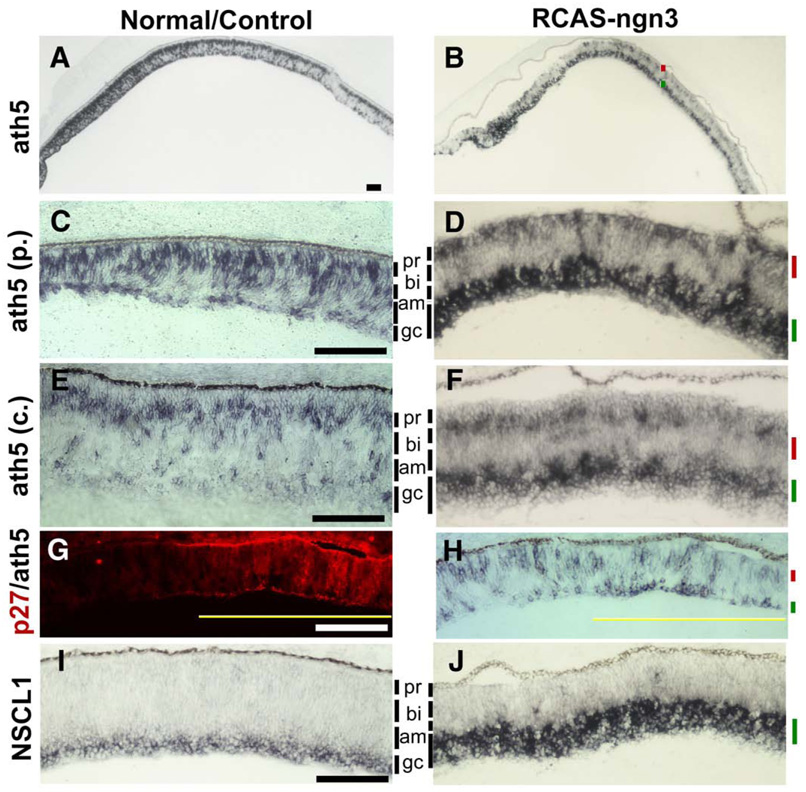
Alterations in the spatial patterns of ath5 and NSCL1 expression in retinas infected by RCAS-ngn3. (A, B) Low magnification views of in situ hybridization for ath5 mRNA in normal retina (A) and experimental retina at E7.5 (B). (C, D) ath5 expression in a peripheral region of the control retina infected with RCAS-GFP (C) and in the experimental retina at E7.5 (D). (E, F) ath5 expression in a central region of the control retina infected with RCAS-GFP (E) or experimental retina (F). (G, H) Double-labeling for RCAS viral protein p27 (G) and ath5 expression (H) of E5 retina partially infected with RCAS-ngn3. Yellow line indicates the infected region. (I, J) The spatial expression patterns of NSCL1 in normal (I) and experimental (J) retinas. The cellular layer with diminished gene expression is marked by a red bar. The cellular layer with increased gene expression is marked by a green bar. To facilitate visualization of the pseudo-stratification of the E7.5 retina, the prospective cell layers are indicated by vertical lines in gray and marked for prospective positions of photoreceptors (pr), bipolar (bi), amacrine (am), and ganglion cells (gc). Scale bars: 100 µm.
For a quantitative analysis, retinas from 3 infected embryos were pooled and their cells dissociated. After seeding for 4 h in a cell culture incubator, cells were fixed and stained with markers that identify different retinal cell populations. Scoring cell numbers revealed a 3-fold reduction in the number of AP2α+ cells, from 13.6% of total cell present in the control to 4.0% in the experimental retinas (Fig. 6K), while the number of Brn3A+ cells was doubled, from 2.9% of total cells in the control to 6.1% in samples infected with RCAS-ngn3 (Fig. 6K). Note that because percentage of total cells is used, changes here reflect both a net increase in the number of a particular type of cells and the reduction of total retinal cell population from ngn3 promoting cell cycle exit.
Cone genesis trails that of ganglion cells and is the dominant photoreceptor cell type in the chick. Cone photoreceptor cells were identified by specific antibodies against visinin, a calcium-binding protein (Yamagata et al., 1990). No significant changes in the number of photoreceptor cells were observed with either retinal cryosections or dissociated retinal cells, even though the territory of neuroD expression was markedly expanded (Figs. 10E, F) and the number of neuroD-expressing cells tripled (Fig. 6K). The death of embryos before E8 precluded in ovo analyses of bipolar and Müller glia populations.
Fig. 10.
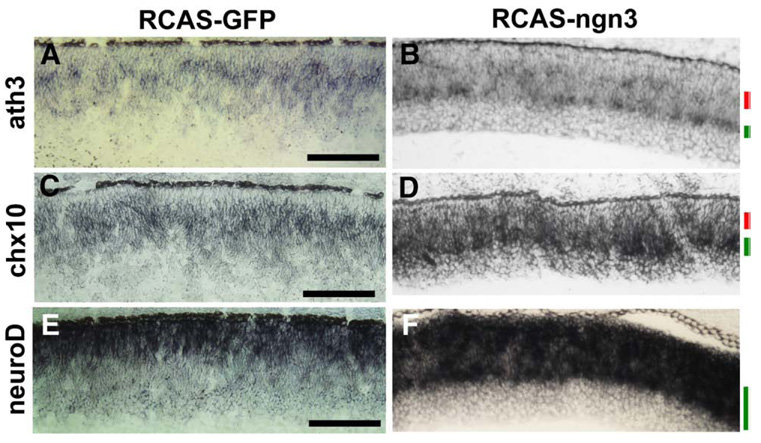
Alterations in the spatial locales of ath3, chx10, and neuroD expression in E7.5 retina infected by RCAS-ngn3. In situ hybridizationwas used to detect spatial expression patterns of ath3 in the control infected with RCAS-GFP (A) and the experimental (B) retinas; of chx10 in the control (C) and the experimental (D) retinas; of neuroD in the control (E) and the experimental (F) retinas. The cellular layer with diminished gene expression is marked by a red bar. The cellular layer with increased gene expression is marked by a green bar. Scale bars: 100 µm.
Overexpression of ngn3 altered the expression of a number of regulatory genes
The confined ngn3 expression to early retinal development suggested the possibility that ngn3 is an early bHLH gene at an initial point of a transcriptional network regulating neuron diversity in the retina. To examine this possibility, we analyzed retinas infected with RCAS-ngn3 for alterations in the expression of genes encoding transcription factors known or implicated to participate in the development of different cell populations. We found alterations in the expression of a number of regulatory genes. Overall, genes associated with early retinal neurogenesis, including ganglion cell production, were up-regulated, and genes involved in progenitor cells and/or later born cells were suppressed or down-regulated. Because the developing retina is a pseudo-stratified structure within which young neurons accumulate at their prospective locations, alterations in gene expression conspicuously exhibited distinctive topographical patterns: (i) up- or down-regulation that occurred more or less evenly across the retina, (ii) up- or down-regulation that was spatially confined, and (iii) simultaneous up-regulation at one topographic location and down-regulation at another. These alterations were observed in all retinas examined that had near complete viral infection (n ≥ 5). Among the embryos, the extent of alterations varied, and the variation was attributed to varied amounts of Ngn3 protein accumulated in the infected cells due to the nature of the viral vector.
Up-regulation of genes for ganglion cell development
A large number of studies have shown that ganglion cell development requires ath5, a bHLH gene predominantly expressed in the retina (for reviews see Vetter and Brown, 2001; Mu and Klein, 2004). Ath5 also participates in the genesis of other retinal cells (Yang et al., 2003; Ma et al., 2004). In a normal retina, ath5 expression spans more or less the entire process of neurogenesis and mostly in two zones of cells, with the outer zone adjacent to the prospective photoreceptor layer and the inner zone coinciding with young ganglion cells or their precursors (Liu et al., 2001; Brown et al., 2001; Ma et al., 2004) (Fig. 7A). Infection with RCAS-GFP did not alter the two zones of ath5 expression (Figs. 7C, E). In retinas infected with RCAS-ngn3, the inner zone of ath5 expression, which corresponded with ganglion cell development, was expanded (Figs. 7B, D, F). On the other hand, the outer zone of expression, presumably in multipotent progenitor cells (Yang et al., 2003), was diminished (Figs. 7B, D, F). The increase in the inner zone and the repression in the outer zone of ath5 expression were apparent at both the peripheral retina (Figs. 7C, D) and the central retina (Figs. 7E, F), and also in E5 retina (Figs. 7G, H). Thus, ngn3 enhanced ganglion cell-related ath5 expression and at the same time suppressed progenitor cell-related ath5 expression.
Another bHLH gene involved in ganglion cell development is NSCL1, which is distantly related to atonal and is expressed transiently in young ganglion cells during retinal neurogenesis and later in Műller cells (Li et al., 1999). Ngn3 overexpression increased the NSCL1-expressing domain corresponding to young ganglion cells (Figs. 7I, J). Scoring cell numbers after dissociation of retinal cells showed a doubling in the number of NSCL1-expressing cells (Fig. 6K).
Induction of early proneural gene ngn1
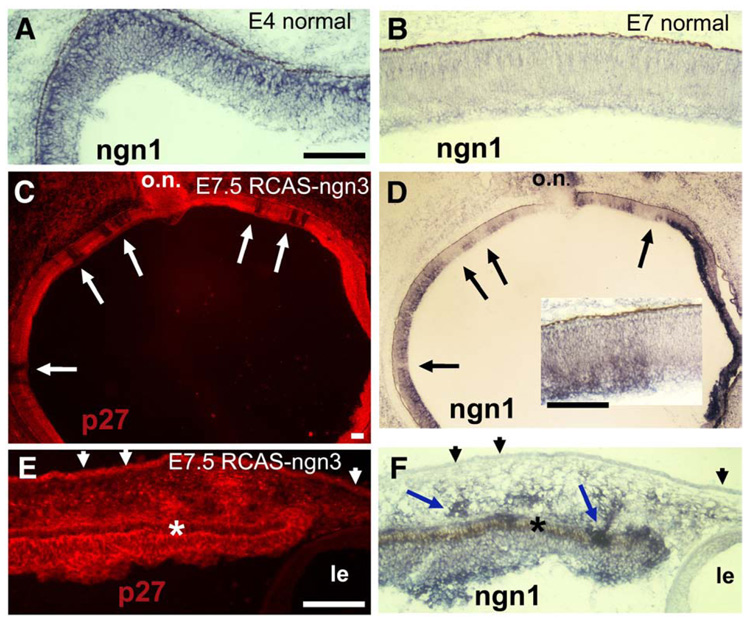
In other regions of the CNS, ngn1 plays a determinative role in generating neural diversity (Bertrand et al., 2002; Ross et al., 2003). In the chick retina, expression of ngn1 was spatially confined to cells localized to the outermost portion of the neuroepithelium (Fig. 8A). Temporally, ngn1 expression was detected in early phases of retinal neurogenesis and became undetectable by E7 (Fig. 8B), even though neurogenesis is still active at this time. This spatial and temporal pattern overlapped with ngn3 expression. In E7.5 retinas infected with RCAS-ngn3, ngn1 mRNA was readily detected, except in a few small regions that appeared to lack viral infection (Fig. 8D). A comparison of the histological locations using serial sections of the same eye showed that the ngn1-expressing domains corresponded well with regions infected with the virus, whereas regions remaining negative for ngn1 expression corresponded with uninfected regions (Figs. 8C, D). The level of ectopic ngn1 expression appeared to display a spatial gradient across the thickness of the retinal neuroepithelium, with the highest level detected on the vitreal side and lowest on the RPE side (Fig. 8D), diametrically different from the normal spatial location of ngn1 expression (Fig. 8A). This induction of ngn1 at ectopic locations and outside the time window of its normal expression indicates that ngn3 played a positive role on ngn1 expression. Induction of ngn1 was also detected in the cortex (data not shown), in some RPE cells at the periphery, and in a subset of head mesenchymal cells (Figs. 8E, F). No induction of ngn1 was detected in head epidermal cells (Figs. 8E, F).
Fig. 8.
Induction of ngn1 in eyes infected with RCAS-ngn3. (A, B) In situ hybridization detection for ngn1 expression in normal retinas at E4 (A) and E7 (B). (C, D) Serial sections of an E7.5 eye infected with RCAS-ngn3 and subjected to immunostaining for RCAS viral protein p27 to identify regions infected with the virus (C) or to in situ hybridization to detect ngn1 expression (D). Inset in D: higher magnification. Arrows point to corresponding regions lacking viral infection (C) and ngn1 expression (D). (E, F) Serial sections of peripheral regions of an E7.5 eye infected with RCAS-ngn3 and stained for viral protein p27 (E) or ngn1 mRNA by in situ hybridization (F). Arrowheads point to head epidermis infected with the virus (E) and lacking ngn1 expression (F). Arrows in F point to ngn1 expression in some mesenchymal cells and RPE cells. RPE is indicated by an asterisk. o.n., optic nerve. Le, lens. Scale bars: 100 µm.
Down-regulation of genes for progenitor cells
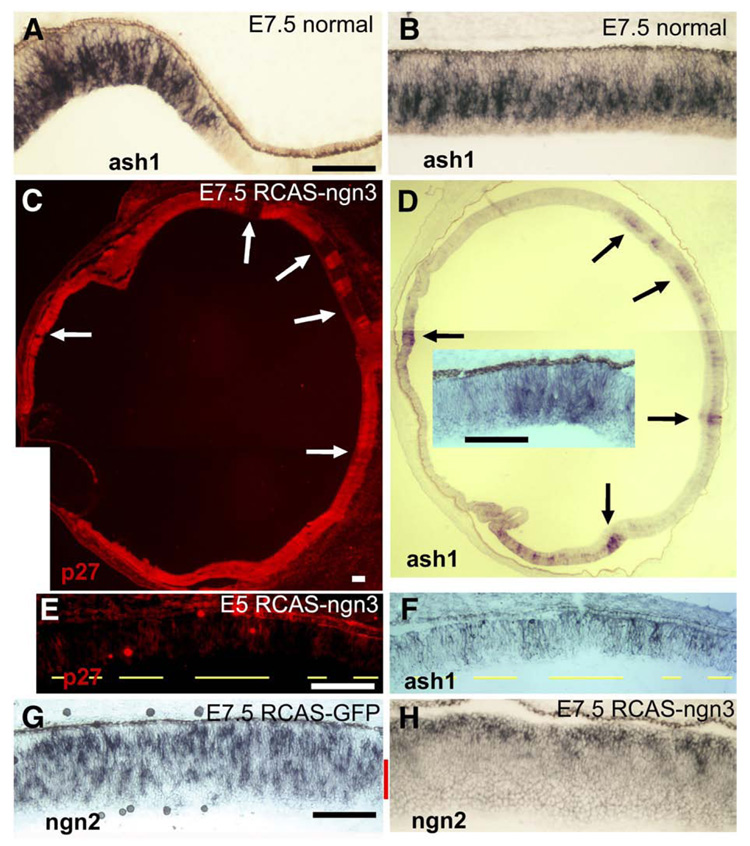
Ash1 plays a determinative role in generating neural diversity in other regions of the CNS (Bertrand et al., 2002; Ross et al., 2003). In the retina, ash1 expression is detected during both early and late phases of neurogenesis in a subpopulation of retinal progenitor cells. Mouse ash1 is thought to participate in the generation of later-born neurons, such as rod photoreceptors and bipolar cells (Tomita et al., 2000), and chick ash1 was believed to also participate in the formation of amacrine cells (Jasoni et al., 1994; Mao and Wang, submitted). In E7.5 retina, expression of ash1 is abundantly detected in cells within the proliferating zone at both the peripheral (Fig. 9A) and the central (Fig. 9B) retina. In retinas infected with RCAS-ngn3, ash1 expression was absent, except at the places corresponding to regions lacking viral infection (Figs. 9C, D). Thus, ash1 expression was specifically inhibited in regions infected with RCAS-ngn3. Inhibition of ash1 expression by ngn3 was also evident at E5 (Figs. 9E, F).
Fig. 9.
Down-regulation of ash1 and ngn2 expression in retinas infected by RCAS-ngn3. (A, B) Expression of ash1 in normal E7.5 retina at the periphery (A) and the central region (B). (C, D) Serial sections of an E7.5 eye infected with RCAS-ngn3 and stained for viral protein p27 to identify regions infected by the virus (C) or stained for ash1 mRNA by in situ hybridization (D). Arrows point to corresponding regions lacking viral infection (C) and retaining ash1 expression (D). (E, F) Double-labeling for viral protein p27 (E) and ash1 expression (F) of E5 retina partially infected with RCAS-ngn3. Yellow lines indicate infected regions. (G, H) The spatial expression patterns of ngn2 in the control infected with RCASGFP (G) and experimental (H) retina. The cellular layer with diminished gene expression is marked by a red bar. Scale bars: 100 µm.
Ngn2 is the third proneural bHLH gene playing a determinative role in generating neural diversity in other regions of the CNS (Bertrand et al., 2002; Ross et al., 2003). In the retina, ngn2 participates in the development of progenitor cells that eventually differentiate into all major types of retinal neurons (Marquardt et al., 2001; Yan et al., 2001; Akagi et al., 2004; Ma and Wang, 2006). Like ath5 and ash1, ngn2 expression spans early and late phases of retinal neurogenesis. In the control E7.5 retina infected with RCAS-GFP, ngn2 was expressed in a large number of progenitor cells distributed more or less across the entire thickness of the retinal neuroepithelium (Fig. 9G). In RCAS-ngn3 infected retinas of the same age, however, ngn2 was down-regulated. The down-regulation appeared location-specific and was confined to the inner portion, leaving a narrow zone at the outer portion where ngn2 expression remained (Fig. 9H). This location-dependent resistance to ngn3's suppression reflects the pseudo-stratified nature of the developing retina and could be due to either ngn3 alone being insufficient to suppress ngn2 expression or other genes/factors promoting ngn2 at the particular location, or both.
Down-regulation of genes for progenitors and bipolar cells
Proneural gene ath3 and homeodomain gene chx10 play important roles in the development of progenitor cells and bipolar cells (Hatakeyama et al., 2001; Burmeister et al., 1996). Expression of ath3 at E7.5 in control retina infected with RCAS-GFP was detected mostly in cells localized to the prospective location of bipolar cells (Fig. 10A). At this location in retinas infected with RCAS-ngn3, ath3 expression was detected in far fewer cells (Fig. 10B). At another cellular layer, where prospective amacrine cells would reside, ath3 was expressed in more cells than in normal retina (Figs.10A, B). Similarly, the number of cells expressing chx10 was reduced at the outer retina, the normal locale of chx10 expression at this stage, but increased at the inner retina (Figs. 10C, D).
Up-regulation of neuroD
Location-dependent regulation by ngn3 was also observed with the expression of proneural gene neuroD. NeuroD plays an important role in photoreceptor production, development, and survival (Yan and Wang, 1998, 2004; Pennesi et al., 2003) and in the differentiation of a specific cone subtype (Liu et al., 2008). In the chick retina, neuroD is predominantly expressed in young photoreceptor cells and their precursors residing on the RPE side (Yan and Wang, 1998, 2004). Infection with RCAS-GFP did not alter this pattern of expression (Fig. 10E). Ngn3 overexpression expanded neuroD expression to territories normally occupied by progenitors or prospective inner neurons (Fig. 10F). Notably, no ectopic neuroD expression was induced by ngn3 at the location of young ganglion cells, where ectopic induction of ngn1 was conspicuous (Fig. 8D). This further indicates the intricacy of the regulatory network governing a balanced production of diverse cell types in the developing retina. When the retinas from 3 infected embryos were pooled, and their cells were dissociated and scored, the number of neuroD-expressing cells was found to be more than tripled, from 15.5% of total cells in the control infected with RCAS-GFP to 52.0% in samples infected with RCAS-ngn3 (Fig. 6K).
Discussion
From NCBI's data base, we identified a chick gene encoding a bHLH protein, whose closest homologues were Ngn3s from different species. Expression of chick ngn3 was detected in the developing retina and in some cells of the non-neural RPE. Mammalian ngn3 is well known for its critical role in endocrine development, where ngn3 determines which precursor cells will become insulin-producing endocrine cells of the islets of Langerhans. In the developing chick retina, expression of ngn3 was detected as early as E2, persisted through E5, and became undetectable at E6 (except at the periphery). Spatially, cells expressing ngn3 were mostly localized to the apical side of retinal neuroepithelium, where M-phase cells reside, with some at the prospective ganglion cell layer. The presence ngn3 mRNA+/BrdU+ and ngn3 mRNA+/phosphoH3+ cells in the developing retina suggests that ngn3 is expressed in a subset of proliferating and dividing progenitors. The spatial and temporal pattern indicates that ngn3 is transiently expressed in early phases of retinal neurogenesis, because at E6, retinal neurogenesis in the chick is still active and the expression bHLH regulatory genes ath5, ngn2, and ash1 remains high. The onset of ngn3 expression appeared to precede that of ath5, ngn2, and ash1, as our comparative analysis using serial sections showed that cells expressing ngn3 were present in E2 retina, which has only a few cells expressing ath5 and no cells expressing ngn2 or ash1. The differences in temporal and spatial patterns of expression of these bHLH genes are consistent with the possibility of ngn3 playing a role in regulating the other bHLH genes.
The early expression of ngn3 suggested a role in the genesis of early-born neurons. Indeed, overexpression of ngn3 expanded the domain of cells expressing ganglion cell markers (Islet-1, Brn3A, ath5, and NSCL1). The expansion of Islet-1+ domain and Brn3A+ domain were detected in internally controlled retinal sections and, thus, may reflect a net increase in the number of cells expressing these markers. A reduction in total cell population due to ngn3 promoting cell cycle exit is expected to affect the ratio of ganglion cells to the total number of retinal cells, not the infection region-specific expansion of domains observed in internally control retinal sections. An increase in the number of cells expressing ganglion cell markers could result from ngn3 promoting premature cell cycle exit, thus increasing the population of cells competent to become ganglion cells. It could also be due to overexpression of ngn3 promoting migration of ath5-expressing cells in the progenitor zone to the prospective ganglion cell zone and/or preventing the proper turnover of ath5, which is known to promote ganglion cell development. The expansion of ganglion cell property appeared to occur at the expense of progenitor cells and of amacrine cells. The reduction of amacrine properties might be related to diminished ash1 expression. While most published studies show ash1 participating in the production of later-born neurons, such as rod photoreceptors and bipolar cells, Jasoni et al. (1994) proposed a role of ash1 in amacrine cell genesis in the chick retina, and our unpublished results support ash1 promoting amacrine cell production in the chick. Notably, the photoreceptor population remained unchanged in retinas overexpressing ngn3, even though the expression of neuroD, a key regulator of photoreceptor development, was expanded into the inner retina. This indicates that the neuroD expression induced at the ectopic location was insufficient to switch cell identities at these places. Other factors required in photoreceptor production may be lacking at these locations or, alternatively, ngn3 also induced genes antagonistic to neuroD or inhibitory to photoreceptor genesis.
In the retina, ngn3 altered the expression of a number of regulatory genes, including ash1, ath3, ath5, chx10, NSCL1, neuroD, ngn1, and ngn2. These genes are associated with a wide range of cell types, including progenitor cells, photoreceptor cells, bipolar cells, amacrine cells, and ganglion cells. Alteration in their expression implies a link between ngn3 and the genetic programs of the major cell populations present in the developing retina. Overall, ngn3 increased the expression of those regulatory genes that are involved in the production of early born cells and suppressed others that are for later born cells. Admittedly, some of the alterations in expression could be indirect. Notably, overexpression of ngn3 altered the expression of all 3 proneural genes (ash1, ngn1, and ngn2) known in other parts of the nervous system to play determinative roles in generating neuronal diversities.
Complexity in the effect of ngn3 on regulatory genes was indicated by the changes in regulation as a function of variations in histological locations within the pseudostratified retinal neuroepithelium. Overexpression of ngn3 both induced and suppressed the expression of ath3, ath5, and chx10, depending upon the histological location. While the location-specific alteration in ath5 expression can be linked to promoting ganglion cell properties, no such link is obvious for the alterations in ath3 and chx10 expression. The location-dependency indicates the importance of cellular context in affecting the manner in which ngn3 regulated gene expression and suggest collaborations between ngn3 and cellular context-defined factors in generating retinal neural diversity. Such a location- or context-dependency was also manifested in ngn3-induced ngn1 induction: not all tissues were competent to ngn3's induction, and not all cells in a “competent” tissue responded to ngn3's induction of ngn1. The competency could reflect the presence of co-factors, an absence of inhibitory factors, or cross-regulation of bHLH genes.
The properties of ngn3, including its expression pattern and its remarkably intricate regulation of a large number of regulatory genes, indicate that ngn3 may reside at an early point of a regulatory network that links diverse cell populations in the developing retina for a balanced production of various cell types, perhaps by promoting early born neurons at the expense of later born ones. The complex manner in which ngn3 altered the expression of other transcriptional factors offers a glimpse into the intricate regulatory network operating during retinal neurogenesis.
Experimental methods
Chick embryos
Fertilized, pathogen-free White Leghorn chicken eggs were purchased from Spafas and incubated in a Petersime incubator. All use of animals adhered to the procedures and policies set by the Institutional Animal Use and Care Committee at the University of Alabama at Birmingham.
Identification of chick ngn3
The mouse ngn3 sequence (Sommer et al., 1996) was used to search for a chicken homologue in GenBank. The highest identity (85%) was found in a region of 157 nucleotides encoding a bHLH domain in Gallus gallus chromosome UNK clone CH261-5M18. The deduced amino acid sequence of the corresponding open reading frame was then compared to that of mouse and human Ngn3.
Generation of RCAS-ngn3 retrovirus
The coding region of chick ngn3 was PCR amplified from E5 chick retina cDNA using primers ccatggccccgcagagcgac and gtcgactcagaggaaggcggggaag. The PCR product was cloned and its sequence verified. From shuttle vector Cla12Nco, a Cla I fragment containing the chick sequence plus the 5 untranslated sequence of the src oncogene was then inserted into proviral vector RCAS (Hughes et al., 1987). Virus particles were produced by transfecting chick embryonic fibroblast cells with the recombinant proviral DNA. Concentrated viral stocks (~8×10⁸ pfu/ml) were prepared as described (Yan and Wang, 1998).
Microinjection of retrovirus into chick embryos
Concentrated virus RCAS-ngn3, or control virus RCAS-GFP (Yan and Wang, 1998), was microinjected into the neural tube and the “subretinal” space (between the two layers of the optic cup) of day 2 chick embryos (E2, stage 15–17), as previously described (Yan and Wang, 1998). At E5 and E7.5, infected eyes were enucleated and fixed with ice-cold 4% paraformaldehyde, cryoprotected with OCT:sucrose (2:1), and frozen with liquid nitrogen. Infection by RCAS viruses (RCAS-ngn3 and RCAS-GFP) was identified by immunostaining with a specific antibody against a viral protein p27.
Dissociated retinal cells
E7.5 retinas were dissected and pooled from 3 embryos receiving RCAS-ngn3 virus at E2, with retinas infected by RCAS-GFP as control. Retinal cellswere dissociated with trypsin-EDTA. Dissociate cells were resuspended in culture medium and seeded onto the bottom of polyornithine-treated 35-mm culture dishes. Because on the average the number of total retinal cells in an E7.5 retina infected with RCAS-ngn3 was reduced to ~50% of that in the control infected with RCAS-GFP, dissociate cells for experimental retinas were resuspended in half the volume of what was used for the control, to achieve equivalent final cell densities at seeding. After 4 h in a cell culture incubator with Medium 199 supplemented with 10% fetal calf serum, cells were fixed with ice-cold 4% paraformaldehyde, before being subjected to immunostaining or in situ hybridization. The number of the positive cells and the number of total cells were scored from 10 view areas, each with 200–470 cells, under a 20× objective. The percentage of positive cells was calculated for one dish, and the means and SDs from 3 dishes were calculated using the computer program Origin 7.0 (OriginLab Corp.).
In situ hybridization
The coding regions of ngn3, ngn1 (Perez et al., 1999), ash1 (Jasoni et al., 1994), and VIAAT (GenBank accession # BI393349) were PCR amplified, based on published sequence information, from cDNA prepared from embryonic chick retina. PCR products were cloned and their sequences verified. Linearized plasmids harboring the sequences were used to synthesize digoxigenin (dig)-labeled antisense RNA probes using the Genius kit (Roche Molecular Biochemicals) following the manufacturer's instructions. Dig-labeled antisense RNA probes against chick ath3, ath5, chx10, neuroD, ngn2, and NSCL1, were prepared as previously described (Yan and Wang, 1998; Li et al., 1999; Yan et al., 2001, Ma et al., 2004). Retinal cryosections of 8–10 µm thick were used for in situ hybridization following procedures described previously (Li et al., 1999).
Immunocytochemistry
Monoclonal antibody RA4 (used at a 1:1000 dilution) was a gift from Dr. Steven McLoon (University of Minnesota). The following monoclonal antibodies were obtained from the Developmental Studies Hybridoma Bank (University of Iowa): anti-bromodeoxyuridine (BrdU, clone G3G4, 1:100; developed by Dr. Stephen J. Kaufman), anti-islet-1 (clone 39.4D5, 1:100; developed by Dr. Thomas Jessell), anti-LIM (clone 4F2, 1:50; developed by Dr. Thomas Jessell), anti-AP2α (3B5, 1:50; developed by Dr. Trevor Williams), and anti-visinin (clone 7G4, 1:500; developed by Dr. Constance Cepko). Antibodies obtained from a commercial source included: monoclonal antibody against Brn3a (1:200; Chemicon); polyclonal antibody against red opsin (1:200; Chemicon); anti-phospho-Histone H3 (1:200; Biotin conjugated; Upstate Biotechnology), and polyclonal antibody against an RCAS viral protein, p27 (1:500; Spafas). Standard immunocytochemistry was performed using the ABC kit from Vector Laboratories with secondary antibodies conjugated with peroxidase, alkaline phosphatase (Vector Laboratories), or fluorophore (Molecular Probes).
Pulse-labeling with BrdU and double staining
BrdU (50 µg in 50 µl of HBSS) was dropped through an opening in the shell onto the vitelline membrane of E5 and E7.5 chick embryos. The embryos were incubated for 4 h before the eyes were harvested and fixed with 4% paraformaldehyde. For double labeling, cryosections on glass slides were first subjected to in situ hybridization with diglabeled anti-ngn3 RNA probes and then to BrdU detection using a specific antibody as previously described (Li et al., 1999).
Acknowledgments
The authors thank Dr. Stephen Hughes for the retroviral vector RCAS (B/P) and shuttle vector Cla12Nco. This work was supported in part by NIH/NEI grant EY11640, EyeSight Foundation FY2005-06-21, a research grant from the International Retinal Research Foundation, and an unrestricted grant to UAB Department of Ophthalmology from Research to Prevent Blindness.
References
- Adler R. A model of retinal cell differentiation in the chick embryo. Prog. Retin. Eye Res. 2000;19:529–557. doi: 10.1016/s1350-9462(00)00008-2. [DOI] [PubMed] [Google Scholar]
- Akagi T, Inoue T, Miyoshi G, Bessho Y, Takahashi M, Lee JE, Guillemot F, Kageyama R. Requirement of multiple basic helix-loop-helix genes for retinal neuronal subtype specification. J. Biol. Chem. 2004;279:28492–28498. doi: 10.1074/jbc.M400871200. [DOI] [PubMed] [Google Scholar]
- Alexiades MR, Cepko CL. Subsets of retinal progenitors display temporally regulated and distinct biases in the fates of their progeny. Development. 1997;124:1119–1131. doi: 10.1242/dev.124.6.1119. [DOI] [PubMed] [Google Scholar]
- Belliveau MJ, Young TL, Cepko CL. Late retinal progenitor cells show intrinsic limitations in the production of cell types and the kinetics of opsin synthesis. J. Neurosci. 2000;20:2247–2254. doi: 10.1523/JNEUROSCI.20-06-02247.2000. [DOI] [PMC free article] [PubMed] [Google Scholar]
- Bertrand N, Castro DS, Guillemot F. Proneural genes and the specification of neural cell types. Nat. Rev., Neurosci. 2002;3:517–530. doi: 10.1038/nrn874. [DOI] [PubMed] [Google Scholar]
- Braisted JE, Essman TF, Raymond PA. Selective regeneration of photoreceptors in goldfish retina. Development. 1994;120:2409–2419. doi: 10.1242/dev.120.9.2409. [DOI] [PubMed] [Google Scholar]
- Brown NL, Patel S, Brzezinski J, Glaser T. Math5 is required for retinal ganglion cell and optic nerve formation. Development. 2001;128:2497–2508. doi: 10.1242/dev.128.13.2497. [DOI] [PMC free article] [PubMed] [Google Scholar]
- Burmeister M, Novak J, Liang MY, Basu S, Ploder L, Hawes NL, Vidgen D, Hoover F, Goldman D, Kalnins VI, Roderick TH, Taylor BA, Hankin MH, McInnes RR. Ocular retardation mouse caused by Chx10 homeobox null allele: impaired retinal progenitor proliferation and bipolar cell differentiation. Nat. Genet. 1996;12:376–384. doi: 10.1038/ng0496-376. [DOI] [PubMed] [Google Scholar]
- Cayouette M, Barres BA, Raff M. Importance of intrinsic mechanisms in cell fate decisions in the developing rat retina. Neuron. 2003;40:897–904. doi: 10.1016/s0896-6273(03)00756-6. [DOI] [PubMed] [Google Scholar]
- Cook B, Portera-Cailliau C, Adler R. Developmental neuronal death is not a universal phenomenon among cell types in the chick embryo retina. J. Comp. Neurol. 1998;396:12–19. doi: 10.1002/(sici)1096-9861(19980622)396:1<12::aid-cne2>3.0.co;2-l. [DOI] [PubMed] [Google Scholar]
- Hatakeyama J, Tomita K, Inoue T, Kageyama R. Roles of homeobox and bHLH genes in specification of a retinal cell type. Development. 2001;128:1313–1322. doi: 10.1242/dev.128.8.1313. [DOI] [PubMed] [Google Scholar]
- Huang S, Moody SA. Three types of serotonin-containing amacrine cells in tadpole retina have distinct clonal origins. J. Comp. Neurol. 1997;387:42–52. [PubMed] [Google Scholar]
- Hughes SH, Greenhouse JJ, Petropoulos CJ, Sutrave P. Adaptor plasmids simplify the insertion of foreign DNA into helper-independent retroviral vectors. J. Virol. 1987;61:3004–3012. doi: 10.1128/jvi.61.10.3004-3012.1987. [DOI] [PMC free article] [PubMed] [Google Scholar]
- Jasoni CL, Walker MB, Morris MD, Reh TA. A chicken achaete-scute homolog (CASH-1) is expressed in a temporally and spatially discrete manner in the developing nervous system. Development. 1994;120:769–783. doi: 10.1242/dev.120.4.769. [DOI] [PubMed] [Google Scholar]
- Lee J, Wu Y, Qi Y, Xue H, Liu Y, Scheel D, German M, Qiu M, Guillemot F, Rao M, Gradwohl G. Neurogenin3 participates in gliogenesis in the developing vertebrate spinal cord. Dev. Biol. 2003;253:84–98. doi: 10.1006/dbio.2002.0868. [DOI] [PubMed] [Google Scholar]
- Li C-M, Yan R-T, Wang S-Z. Misexpression of cNSCL1 disrupts retinal development. Mol. Cell. Neurosci. 1999;14:17–27. doi: 10.1006/mcne.1999.0765. [DOI] [PubMed] [Google Scholar]
- Li C-M, Yan R-T, Wang S-Z. Misexpression of chick NSCL2 causes atrophy of Müller glia and photoreceptor cells. Invest. Ophthalmol. Vis. Sci. 2001;42:3103–3109. [PMC free article] [PubMed] [Google Scholar]
- Li C-M, Yan R-T, Wang S-Z. A novel homeobox gene and its role in the development of retinal bipolar cells. Mech. Dev. 2002;116:85–94. doi: 10.1016/s0925-4773(02)00148-x. [DOI] [PubMed] [Google Scholar]
- Liu W, Mo Z, Xiang M. The Ath5 proneural genes function upstream of Brn3 POU domain transcription factor genes to promote retinal ganglion cell development. Proc. Natl. Acad. Sci. U. S. A. 2001;98:1649–1654. doi: 10.1073/pnas.98.4.1649. [DOI] [PMC free article] [PubMed] [Google Scholar]
- Liu Y, Wu Y, Lee JC, Xue H, Pevny LH, Kaprielian Z, Rao MS. Oligodendrocyte and astrocyte development in rodents: an in situ and immunohistological analysis during embryonic development. Glia. 2002;40:25–43. doi: 10.1002/glia.10111. [DOI] [PubMed] [Google Scholar]
- Liu H, Etter P, Hayes S, Jones I, Nelson B, Hartman B, Forrest D, Reh T. NeuroD1 regulates expression of thyroid hormone receptor β2 and cone opsins in the developing mouse retina. J. Neurosci. 2008;28:749–756. doi: 10.1523/JNEUROSCI.4832-07.2008. [DOI] [PMC free article] [PubMed] [Google Scholar]
- Ma W, Wang S-Z. The final fates of neurogenin2-expressing cells include all major neuron types in the mouse retina. Mol. Cell. Neurosci. 2006;31:463–469. doi: 10.1016/j.mcn.2005.10.018. [DOI] [PMC free article] [PubMed] [Google Scholar]
- Ma W, Yan R-T, Xie W, S-Z A role of ath5 in inducing neuroD and the photoreceptor pathway. J. Neurosci. 2004;24:7150–7158. doi: 10.1523/JNEUROSCI.2266-04.2004. [DOI] [PMC free article] [PubMed] [Google Scholar]
- Matter-Sadzinski L, Puzianowska-Kuznicka M, Hernandez J, Ballivet M, Matter JM. A bHLH transcriptional network regulating the specification of retinal ganglion cells. Development. 2005;132:3907–3921. doi: 10.1242/dev.01960. [DOI] [PubMed] [Google Scholar]
- Marquardt T, Ashery-Padan R, Andrejewski N, Scardigli R, Guillemot F, Gruss P. Pax6 is required for the multipotent state of retinal progenitor cells. Cell. 2001;105:43–55. doi: 10.1016/s0092-8674(01)00295-1. [DOI] [PubMed] [Google Scholar]
- Mu X, Klein WH. A gene regulatory hierarchy for retinal ganglion cell specification and differentiation. Semin. Cell Dev. Biol. 2004;15:115–1231. doi: 10.1016/j.semcdb.2003.09.009. [DOI] [PubMed] [Google Scholar]
- Mu X, Fu X, Sun H, Liang S, Maeda H, Frishman LJ, Klein WH. Ganglion cells are required for normal progenitor-cell proliferation but not cell-fate determination or patterning in the developing mouse retina. Curr. Biol. 2005;15:525–530. doi: 10.1016/j.cub.2005.01.043. [DOI] [PubMed] [Google Scholar]
- Otteson DC, Hitchcock PF. Stem cells in the teleost retina: persistent neurogenesis and injury-induced regeneration. Vis. Res. 2003;43:927–936. doi: 10.1016/s0042-6989(02)00400-5. [DOI] [PubMed] [Google Scholar]
- Pennesi ME, Cho JH, Yang Z, Wu SH, Zhang J, Wu SM, Tsai MJ. BETA2/NeuroD1 null mice: a new model for transcription factor-dependent photoreceptor degeneration. J. Neurosci. 2003;23:453–461. doi: 10.1523/JNEUROSCI.23-02-00453.2003. [DOI] [PMC free article] [PubMed] [Google Scholar]
- Perez SE, Rebelo S, Anderson DJ. Early specification of sensory neuron fate revealed by expression and function of neurogenins in the chick embryo. Development. 1999;126:1715–1728. doi: 10.1242/dev.126.8.1715. [DOI] [PubMed] [Google Scholar]
- Rapaport DH, Wong LL, Wood ED, Yasumura D, LaVail MM. Timing and topography of cell genesis in the rat retina. J. Comp. Neurol. 2004;474:304–324. doi: 10.1002/cne.20134. [DOI] [PubMed] [Google Scholar]
- Raymond PA. Cell determination and positional cues in the teleost retina: development of photoreceptors and horizontal cells. In: Lam D-K, Shatz CJ, editors. Development of the Visual System. Cambridge: The MIT Press; 1991. pp. 59–78. [Google Scholar]
- Reh TA. Determination of cell fate during retinal histogenesis: intrinsic and extrinsic mechanisms. In: Lam D-K, Shatz CJ, editors. Development of the Visual System. Cambridge: The MIT Press; 1991. pp. 79–94. [Google Scholar]
- Ross SE, Greenberg ME, Stiles CD. Basic helix-loop-helix factors in cortical development. Neuron. 2003;39:13–25. doi: 10.1016/s0896-6273(03)00365-9. [DOI] [PubMed] [Google Scholar]
- Sommer L, Ma Q, Anderson DJ. neurogenins, a novel family of atonal-related bHLH transcription factors, are putative mammalian neuronal determination genes that reveal progenitor cell heterogeneity in the developing CNS and PNS. Mol. Cell. Neurosci. 1996;8:221–241. doi: 10.1006/mcne.1996.0060. [DOI] [PubMed] [Google Scholar]
- Tomita K, Moriyoshi K, Nakanishi S, Guillemot F, Kageyama R. Mammalian achaete-scute and atonal homologs regulate neuronal versus glial fate determination in the central nervous system. EMBO J. 2000;19:5460–5472. doi: 10.1093/emboj/19.20.5460. [DOI] [PMC free article] [PubMed] [Google Scholar]
- Vetter ML, Brown NL. The role of basic helix-loop-helix genes in vertebrate retinogenesis. Semin. Cell Dev. Biol. 2001;12:491–498. doi: 10.1006/scdb.2001.0273. [DOI] [PubMed] [Google Scholar]
- Waid DK, McLoon SC. Ganglion cells influence the fate of dividing retinal cells in culture. Development. 1998;125:1059–1066. doi: 10.1242/dev.125.6.1059. [DOI] [PubMed] [Google Scholar]
- Yamagata K, Goto K, Kuo CH, Kondo H, Miki N. Visinin: a novel calcium binding protein expressed in retinal cone cells. Neuron. 1990;4:469–476. doi: 10.1016/0896-6273(90)90059-o. [DOI] [PubMed] [Google Scholar]
- Yan R-T, Wang S-Z. neuroD induces photoreceptor cell overproduction in vivo and de novo generation in vitro. J. Neurobiol. 1998;36:485–496. [PMC free article] [PubMed] [Google Scholar]
- Yan R-T, Wang S-Z. Embryonic abnormalities from misexpression of cNSCL1. Biochem. Biophys. Res. Cummun. 2001;287:949–955. doi: 10.1006/bbrc.2001.5690. [DOI] [PubMed] [Google Scholar]
- Yan R-T, Wang S-Z. Requirement of neuroD for hotoreceptor formation in the chick retina. Invest. Ophthalmol. Vis. Sci. 2004;45:48–58. doi: 10.1167/iovs.03-0774. [DOI] [PMC free article] [PubMed] [Google Scholar]
- Yan R-T, Ma W, Wang S-Z. neurogenin2 elicits the genesis of retinal neurons from cultures of non-neural cells. Proc. Natl. Acad. Sci. U. S. A. 2001;98:15014–15019. doi: 10.1073/pnas.261455698. [DOI] [PMC free article] [PubMed] [Google Scholar]
- Yan R-T, Ma W, Liang L, Wang S-Z. bHLH genes in retinal cell fate specification. Mol. Neurobiol. 2005;32:157–171. doi: 10.1385/MN:32:2:157. [DOI] [PMC free article] [PubMed] [Google Scholar]
- Yang Z, Ding K, Pan L, Deng M, Gan L. Math5 determines the competence state of retinal ganglion cell progenitors. Dev. Biol. 2003;264:240–254. doi: 10.1016/j.ydbio.2003.08.005. [DOI] [PubMed] [Google Scholar]
- Zhang XM, Yang XJ. Regulation of retinal ganglion cell production by sonic hedgehog. Development. 2001;128:943–957. doi: 10.1242/dev.128.6.943. [DOI] [PMC free article] [PubMed] [Google Scholar]


