

Abstract
Conventional approaches to identifying quantitative trait loci (QTLs) regulating bone mass and fragility are limited because they examine cortical and trabecular traits independently. Prior work examining long bones from young adult mice and humans indicated that skeletal traits are functionally related and that compensatory interactions among morphological and compositional traits are critical for establishing mechanical function. However, it is not known whether trait covariation (i.e., phenotypic integration) also is important for establishing mechanical function in more complex, corticocancellous structures. Covariation among trabecular, cortical, and compositional bone traits was examined in the context of mechanical functionality for L4 vertebral bodies across a panel of 16-wk-old female AXB/BXA recombinant inbred (RI) mouse strains. The unique pattern of randomization of the A/J and C57BL/6J (B6) genome among the RI panel provides a powerful tool that can be used to measure the tendency for different traits to covary and to study the biology of complex traits. We tested the hypothesis that genetic variants affecting vertebral size and mass are buffered by changes in the relative amounts of cortical and trabecular bone and overall mineralization. Despite inheriting random sets of A/J and B6 genomes, the RI strains inherited nonrandom sets of cortical and trabecular bone traits. Path analysis, which is a multivariate analysis that shows how multiple traits covary simultaneously when confounding variables like body size are taken into consideration, showed that RI strains that tended to have smaller vertebrae relative to body size achieved mechanical functionality by increasing mineralization and the relative amounts of cortical and trabecular bone. The interdependence among corticocancellous traits in the vertebral body indicated that variation in trabecular bone traits among inbred mouse strains, which is often thought to arise from genetic factors, is also determined in part by the adaptive response to variation in traits describing the cortical shell. The covariation among corticocancellous traits has important implications for genetic analyses and for interpreting the response of bone to genetic and environmental perturbations.
Key words: path analysis, biomechanics, inbred mice, vertebral body, phenotypic integration
INTRODUCTION
Bone is a highly evolved, complex system in which multiple compositional and morphological traits contribute to mechanical functionality (i.e., stiffness and strength for everyday use). A general paradigm of complex systems such as bone is that different genotypes lead to different sets of physical traits resulting in similar functions. Although no single gene is responsible for establishing functionality, genetic variants affecting multiple aspects of a structure can potentially threaten functionality. Additionally, the design challenge of building functional bones is similar to that of building a bridge where functional structures must be built as efficiently as possible using limited resources. Fortunately, nature found a way to meet this design challenge.
Functional (i.e., compensatory) interactions among bone traits play a critical role in determining normal mechanical function. However, little is known about the nature of this phenotypic integration in the context of genetic variants affecting skeletal size, mass, and quality, which are key determinants of bone functionality and fracture susceptibility.(1–9) In long bones, phenotypic integration of morphological and compositional bone traits is critical for establishing mechanically functional structures by compensating for genetic variants leading to slender phenotypes. However, phenotypic integration also contributes to fracture susceptibility by giving rise to genotype-specific trait sets that are more damageable and brittle.(10,11) Thus, improved understanding of the biological processes that contribute to phenotypic integration may provide a novel approach to identifying sets of traits that better predict fracture risk.
We expect phenotypic integration is not limited to long bone but is a general paradigm affecting all skeletal sites including more complex corticocancellous structures. Fractures typically occur in metaphyseal regions such as the distal radius, proximal femur, and vertebral body.(12) Previous studies conducted genetic analyses of corticocancellous structures by examining cortical and cancellous traits independently,(13–15) rarely considering the interdependence among these traits. However, growing evidence suggests that sets of interdependent morphological and compositional traits, in addition to BMD, provide more accurate predictions of fracture risk in more complex corticocancellous sites.(16) Previous work in inbred mouse vertebrae showed that individual strains do not inherit a single bone trait, but a set of trabecular, cortical, and compositional traits that reflect the organ-level mechanical functionality of adult vertebrae.(17) Although never formally tested, other studies speculate that similar coadaptive mechanisms observed in long bones exist in corticocancellous structures.(18,19)
Knowing which traits are functionally related and how these interactions define bone stiffness and strength will advance our understanding of the biological origins of trait variation and will provide alternative phenotypes that can be used in genetic analyses to identify fracture susceptibility genes. Previous studies have generally segregated cortical and trabecular traits and have not considered that phenotypic values of trabecular architecture may depend on cortical traits. Correlations among adult cortical and trabecular traits are thought to arise in part from a common stimulus (e.g., mechanical forces) occurring during growth.(20) Bone cells work in a coordinated manner to construct a functional structure designed to share load among its components with limited available resources (i.e., the amount of tissue is limited to minimize mass).(21,22) As the relative amounts of cortical and trabecular tissue vary in a structure, the load-sharing among these components also varies.(23,24) Because vertebrae are primarily loaded in compression, external size (cross-sectional area) is a phenotypic trait that contributes in a critical way to mechanical function. Genetic controls determining bone size relative to body weight are expected to influence the biomechanical roles of the components during growth and ultimately the observed adult trait interactions. For example, if cortical thickness increases in response to genetic variants decreasing external size (similar to long bones), stress-shielding during growth would be expected to lead to decreased trabecular bone volume fraction in adult vertebrae (Fig. 1).
FIG. 1.

Schematic showing proposed interdependence of cortical and trabecular traits during growth. If cortical thickness increases in response to genetic variants decreasing external size (similar to long bones), stress shielding during growth would be expected to lead to decreased trabecular bone volume fraction in adults.
The goal of this study was to test whether trabecular, cortical, and compositional bone traits are functionally related, because this would imply a strong biological process in bone coadapts traits in corticocancellous structures to meet certain design constraints such as (1) matching stiffness with physiological loads, (2) using minimum mass, (3) distributing the applied loads between cortical and trabecular tissues, and (4) allowing for variation in mineral composition. By viewing bone as a set of interdependent traits, we can identify new associations among physical bone traits that can be translated to the human skeleton(11) and that can be used to refine genetic analyses identifying genes that are directly involved in regulating bone strength. We postulate that cortical and trabecular bone traits will covary with matrix composition and that the subsequent set of traits will lead to stiffness and strength that are proportional to body weight. To test the hypothesis that sets of traits are integrated in a way to achieve mechanical functionality, we used a panel of AXB/BXA recombinant inbred (RI) mouse strains. The unique pattern of randomization of the A/J and C57BL/6J genomes among the RI panel creates subtle, nonpathological trait variation that can be used to measure the tendency for different traits to covary and to study the biology of complex traits.(25) Furthermore, we used percolation theory to evaluate how genetically varying sets of trabecular and cortical traits affect the transfer of compressive loads along the vertebral body. Variable load-transfer pathways in the adult structure (i.e., variable reliance on the cortical shell) may affect the ability of bone cells to maintain strength with aging, when there is a net loss of bone mass.(18)
MATERIALS AND METHODS
RI mouse strains
Female AXB/BXA RI mice derived from A/J and C57BL/6J (B6) progenitor strains were examined in this study. RI strains have a unique pattern of genetic randomization of the parental strain genomes, which creates subtle, nonpathological trait variation that can be used to measure the tendency for different traits to cosegregate or correlate.(25) If the RI strains share common biological controls regulating trait covariation, the RI strains will build mechanically functional bones in slightly different ways depending on the combination of A/J and B6 alleles that were inherited (Fig. 2). Traits can be examined across the panel as a powerful experimental model to quantify functional relationships among traits.(25,26)
FIG. 2.

Coronal sections of vertebral bodies showing widely varying architectures among A/J, B6, and representative AXB/BXA RI strains: AXB10, AXB2, AXB4, and BXA25. Each RI strain contains unique, approximately equal proportions of genetic contributions from the A/J (white chromosomal segments) and B6 (black chromosomal segments) progenitor inbred mouse strains.
A/J, B6, and 20 AXB/BXA RI strains (Table 1) were bred at The Jackson Laboratory (Bar Harbor, ME, USA) and shipped to the Mount Sinai School of Medicine (New York, NY, USA) at 3.5 wk of age (n = 10/strain). The Institutional Animal Care and Use Committee approved the handling and treatment of mice. To standardize environmental conditions, mice were fed a standard rodent chow (Purina Rodent Chow 5001) and water ad libitum, subjected to a 12-h light:dark cycle, and raised with ∼5 mice/cage in the same room. Mice were killed at 16 wk of age because previous studies showed that growth-related changes in traits slowed before this age.(27) Lumbar vertebral segments (L4–L6) were harvested and stored frozen at −20°C in PBS with added calcium.(28)
Table 1.
Variation in Vertebral Body Size, Morphology, Composition, and Whole Bone Stiffness and Strength Among A/J, B6, and 20 AXB/BXA RI Strains

Physical bone traits
Microarchitectural traits and tissue mineral density (TMD) were measured using an eXplore Locus SP PreClinical Specimen MicroComputed Tomography (μCT) system (GE Healthcare, London, Ontario, Canada). The L4 vertebrae were scanned at 16-μm voxel resolution. Vertebral bodies were isolated for analyses and cortical bone was segmented manually from trabecular bone (Fig. 3).(17) Cortical and trabecular volumes were thresholded separately to differentiate bone from nonbone voxels as described previously.(29) Trabecular and cortical morphometry, including trabecular bone volume fraction (BV/TV), trabecular thickness (Tb.Th), trabecular number (Tb.N), trabecular separation (Tb.Sp), cortical area (Ct.Ar), and cortical thickness (Ct.Th), were assessed using MicroView Advanced Bone Analysis (v. 1.23; GE Healthcare). Vertebral body size was measured in 2D as total cross-sectional area (Tt.Ar) averaged for all transverse sections along the height of the vertebral body per bone (16-μm resolution) and in 3D as total vertebral volume (Tt.V = total bone volume [Tt.BV] + marrow volume). The relative amount of cortical area (RCA) was calculated as Ct.Ar/Tt.Ar. TMD was calculated from the μCT images by converting the grayscale output of bone voxels in Hounsfield units (HU) to mineral values (mg/ml of hydroxyapatite) through the use of a calibration phantom containing air, water, and hydroxyapatite (SB3; Gamex RMI, Middleton, WI, USA). TMD is defined as the average bone voxel HU value divided by the average HU value of the hydroxyapatite phantom multiplied by 1130 mg/ml (hydroxyapatite physical density). The same calibration phantom was included in all scans to adjust mineral density measurements for the variability in X-ray attenuation inherent to independent scan sessions.(10) Trabecular TMD (Tb.TMD), cortical TMD (Ct.TMD), and total TMD (Tt.TMD) were calculated.
FIG. 3.

Cortical bone was segmented manually from trabecular bone in μCT images of L4 vertebral bodies. Trabecular traits included BV/TV, Tb.N, Tb.Th, Tb.Sp, and Tb.TMD. Cortical traits included Ct.Ar, Ct.Th, and Ct.TMD.
Network model and percolation parameters
The corticocancellous architecture of a complex skeletal site such as the vertebra or proximal femur is a connected network of bone capable of transferring mechanical loads. A network model based on percolation theory allows us to analyze quantitatively the load transferring behavior of the emergent structure as a function of the connected components.(30) The network topology of the vertebral bodies was assessed from the thresholded μCT images as described previously.(30) Each RI strain consists of a distinct set of physical traits that are expected to transfer load in unique ways depending on the proportions of cortical and trabecular tissue volume fractions. Network percolation theory parameters provided an integrative and quantitative approach to evaluate how different combinations of cortical and trabecular traits transfer load along the cranial–caudal axis. The corticocancellous architecture of the vertebral body was treated as a connected network whose function is to support compressive loads. 2D coronal sections (two per bone) were skeletonized, and nodes and branches were identified using an iterative thinning algorithm (Matlab; The Mathworks, Natick, MA, USA). These 2D sections were taken from each bone at approximately one third and two thirds of the anteroposterior width of the vertebral body. The skeleton graphs were converted into network maps by considering the cortical surface as one highly connected node or hub.
Percolation parameters were calculated as described previously.(30) The inputs into the percolation algorithm are the set of nodes with their connected neighboring nodes and the starting and endpoints or surfaces. Thus, the network inputs did not take morphology of individual trabeculae or the cortex into consideration. The only predefined rules for our network were that information can only travel from the superior surface toward the inferior surface (i.e., load applied to the superior surface can only travel to connected nodes in the network located either horizontal to or below) and the information is self-avoiding (i.e., information cannot travel to a node it has been to previously). The correlation and chemical path lengths measure the load sharing capacity of the network, which is expected to vary with genetic background. The chemical length (ChemL) is the number of nodes along the shortest path of the percolating network that connects opposite boundaries. The correlation length (CorrL) is the average number of nodes along all paths between connected opposite boundaries. To test how genetic variation in the combination of trabecular and cortical traits influences network behavior (i.e., load transfer) CorrL, ChemL, the number of load transfer paths (#paths), the number of nodes (#nodes), and the percentage of existing links connected to the cortex (%hub) were calculated.
Whole bone mechanical properties
Whole bone mechanical properties of intact L4 vertebrae (n = 10/strain) were measured by compressing the vertebral body with a 3-mm-diameter platen as described previously.(17) Mechanical properties, including failure load (F U) and stiffness (S), were measured using a servohydraulic materials testing machine (Instron model 8872; Instron, Canton, MA, USA). F U was defined as the highest load preceding a rapid decrease in the measured load.
Covariation among adult traits
Cosegregation of traits after genetic randomization can be examined using correlation analysis. Trait means and SDs were calculated for each AXB/BXA RI strain. Linear regressions between each of the traits were conducted across the RI panel using the mean values for each RI strain. Pearson correlation coefficients were calculated for all trait–trait comparisons to test whether the morphological traits, mechanical properties, and network parameters correlated significantly with the architectural and compositional traits. The correlation matrix retained the magnitude and direction of each correlation coefficient. Statistically significant correlations were identified by establishing a threshold correlation magnitude determined using permutation tests,(25,31) which corrected for multiple comparisons and established the maximum correlation coefficient that arises when the bone traits are randomly arranged across the RI panel.
Narrow sense heritability
The narrow sense heritability, h 2, estimates the proportion of phenotypic variation attributable to additive genetic effects. h 2 was calculated for all traits and mechanical properties using the method described by Belknap.(32) For the RI panel, h 2 was determined as VA/(VA + VE), where VA is the additive genetic component of variance, VE is the environmental component of variance, and VA + VE is the phenotypic variance, VP. The value of h 2 was estimated using the R 2 value from a one-way ANOVA of traits across the RI panel.
Path analysis
Path analysis is a multivariate analysis that shows how multiple traits covary simultaneously when confounding variables like body size are taken into consideration. Path analysis also offers the flexibility required to represent user-defined models based on hypotheses that best match a particular situation (i.e., directed relationships).(10,33–35) Path analysis allowed us to test whether specific functional relationships among trabecular, cortical, and compositional bone traits exist for the AXB/BXA RI mouse vertebrae. Three path models were examined to test specific aspects of the trait correlations. Trait values were converted to Z-scores as Z-scorei = (x i – x ref)/SDref, where x i is the trait value for each mouse and x ref and SDref are the mean and SD, respectively, calculated using the average values for all 20 AXB/BXA RI strains. Z-transformation standardizes the variables so each trait shows a mean of 0 and an SD of 1 across the RI panel.
Path coefficients, which represent the magnitude of the direct and indirect relationships between traits, were calculated using the Z-transformed data (LISREL v.8.8; Scientific Software International, Lincolnwood, IL, USA). Structural equations were constructed using the path coefficients to specify the interconnected relationships. Observed and model-implied covariance matrices were compared using maximum likelihood estimation, and overall fit was determined by a χ2 test. Unlike conventional null hypothesis testing, Path analysis favors the a priori, theory-based model such that models are only rejected if the observed data and the expectations derived from the model do not match (i.e., if p < 0.05).(33) The root mean square error of approximation (RMSEA) was also reported and is a measure of fit adjusted for population size and degrees of freedom.(36,37) For RMSEA, the p value represents the significance of fit with p < 0.05, indicating close fit, 0.05 < p < 0.08 indicating fair fit, and p > 0.10 indicating poor fit.(36) Preferred models should meet certain standards including (1) it should have at least 1 df; (2) the p value associated with χ2 should be >0.05; (3) individual path coefficients should be significantly different from 0 based on a t-test; (4) path coefficients should be >0.05; and (5) a substantial proportion of phenotypic variance of the endogenous variables (i.e., R 2 values associated with structural equations) should be explained by the model.(26)
Path model to test for phenotypic integration among traits:
To study trait covariation, we focused on a phenotype that, if it were not compensated, would lead to an underdesigned (i.e., weaker) structure. For femora, this phenotype was bone slenderness, which is largely genetically determined.(10) For the vertebral body, the structure is loaded primarily in compression, and stiffness and strength are related to external size. Thus, genetic variants affecting total vertebral volume (Tt.V) relative to body size must be compensated by variation in other traits; otherwise the structure will be underdesigned to support applied loads. A path model was constructed to test the hypothesis that functional interactions among cortical, trabecular, and compositional traits compensate for genetic variants affecting skeletal size and mass (Fig. 4). Independent variables in the model included body weight, total vertebral volume (Tt.V), and total bone volume (Tt.BV). Body weight and Tt.V were included to incorporate genetic variants affecting vertebral size relative to body weight. Tt.BV was included as a constraint imposed on the amount of tissue that can be used to construct functional vertebrae. Dependent variables included the relative amounts of cortical area (RCA), trabecular bone volume (BV/TV), and total tissue mineral density (Tt.TMD). These traits were selected because functional interactions among the set of cortical (RCA), trabecular (BV/TV), and compositional (Tt.TMD) bone traits during growth and development collectively define adult whole bone stiffness and strength. Furthermore, these particular bone traits were used to construct the path model because they move us one step closer to the underlying biological processes involved in the formation and resorption of bone tissue during growth and development (RCA, periosteal and endosteal activity; BV/TV, endosteal activity; Tt.TMD, mineralization; Tt.V, growth plate biology and subperiosteal expansion) and the interactions among them.
FIG. 4.

The proposed path model specified paths among select bone traits related to biological processes involved in the formation and resorption of bone tissue. Variation in body size, bone size, and bone mass is expected to influence the interdependence among cortical traits and trabecular traits, ultimately influencing whole bone mechanical properties.
Path model to test for robustness of interactions among cortical and trabecular traits:
A separate path analysis was performed to specifically examine interactions among cortical and trabecular traits. Simplified path models were developed that removed the biological constraints imposed on the amount of bone tissue (Tt.BV). The first model tested the hypothesis that cortical traits determine trabecular traits. Independent variables included body weight, Tt.Ar, cortical area (Ct.Ar), and the cortical tissue mineral density (Ct.TMD). Dependent variables included trabecular thickness (Tb.Th), trabecular number (Tb.N), and trabecular tissue mineral density (Tb.TMD). The second model tested the reverse hypothesis that trabecular traits determine cortical traits. Independent variables included body weight, Tt.Ar, and Tb.TMD. Dependent variables included Ct.Ar and Ct.TMD.
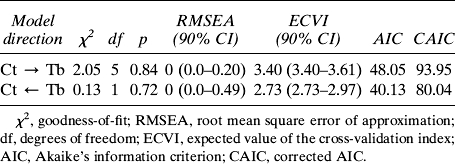
Model selection methods (Table 4) include Akaike's information criterion (AIC), which provides a penalized likelihood statistic for model comparison.(26,38) CAIC is an adjustment of AIC to correct for bias in small sample sizes and is recommended for our models because the ratio of the sample size to the number of estimable parameters is <40.(39) A model with the smallest value of AIC or CAIC among several candidate models is preferred. The expected value of the cross-validation index (ECVI) also estimates the overall error and predictive validity of a model.(40)
Table 4.
Model Comparison for Relationship Between Cortical and Trabecular Traits
Path models to test for functional interactions among physical bone traits and network topology:
A path model was constructed to test how the phenotypic integration among physical bone traits contributes to the variation in network topology. Correlation length (CorrL), the number of paths (# paths), and the percentage of links to the cortical shell (%hub) were added to the model testing the interactions among trabecular (BV/TV), cortical (RCA), and compositional (TMD) traits. This model describes how the amount and the distribution of trabecular and cortical tissue specifically are arranged to transfer compressive loads in the cranial–caudal direction. A separate model was constructed to test how the genetic variants affecting skeletal size and mass directly affect the percolation parameters. Independent variables in the model included body weight, total vertebral volume (Tt.V), and total bone volume (Tt.BV). Dependent variables included the correlation length (CorrL), the number of paths (# paths), and the percentage of links to the cortical shell (%hub).
RESULTS
Variation in physical bone traits, mechanical properties, and network topology among AXB/BXA RI mouse strains
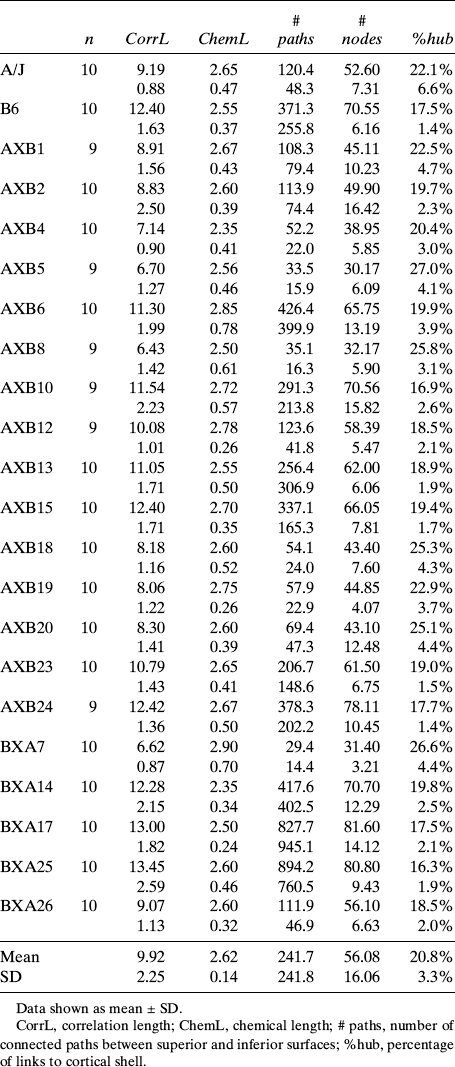
Randomization of the A/J and B6 genomes resulted in wide variation in vertebral size, composition, and network architecture among the RI strains (Table 1). The mean values were normally distributed across the RI panel for all bone traits (p > 0.1, Kolmogorov-Smirnov test). Mean values of each trait showed that the size and architecture of the RI vertebral bodies ranged from being smaller in total volume (Tt.V) than A/J to larger in volume compared with B6 vertebrae. Body weight and Tt.TMD varied within and beyond the values of the A/J and B6 progenitor strains. Whole bone stiffness (S) and strength (F U) also showed wide variation among the RI strains. Percolation parameters ranged within and beyond the values for the A/J and B6 inbred strains (Table 2), indicating that the genetically varying trait sets arising from the functional interactions transfer mechanical load along the vertebral body in different ways among the RI strains.
Table 2.
Variation in Network Topology Quantified by Percolation Theory Among A/J, B6, and AXB/BXA RI Strains
Cosegregation of physical bone traits across the AXB/BXA RI panel
A correlation analysis using the mean values for each RI strain was performed to identify physical bone traits that cosegregated (correlated) in a significant manner (Table 3). Permutation tests for 20 AXB/BXA RI strains and 20 traits indicated that a correlation coefficient of 0.69 corresponded to a significance level of p < 0.10, a correlation coefficient of 0.72 corresponded to p < 0.05, and a correlation coefficient of 0.77 corresponded to p < 0.01. The analysis showed that 38% (72 of 190) of the correlations examined were significant (r > ±0.72, p < 0.05). Thus, many physical bone traits covaried after genetic randomization. Narrow sense heritability values, h 2, were significant for all traits (Table 3). Trabecular and cortical morphological traits varied in h 2 from 0.54 to 0.83. Mineral density and mechanical properties ranged in h 2 from 0.30 to 0.58. Percolation parameters varied in h 2 from 0.09 to 0.75.
Table 3.
Pearson Correlation Coefficients Relating Vertebral Body Morphology, Composition, Whole Bone Mechanical Properties, and Network Topology

The data indicated that all RI strains built functional vertebrae with stiffness and strength values proportional to body weight (BW versus S, r = 0.64; BW versus F U, r = 0.76). Relationships between certain traits such as Tb.N and BV/TV (r = 0.97) and Tb.N and Tb.Sp (r = −0.99) were expected based on geometric scaling and mathematical relationships. Most percolation parameters correlated with morphology as expected. CorrL, # paths, # nodes, and %hub were significantly correlated with trabecular morphology (BV/TV, Tb.N, Tb.Sp). Percolation parameters were also significantly related to stiffness and strength. ChemL did not significantly correlate with any parameter and had the lowest h 2. This was a result of defining the cortical shell as a hub, which resulted in small variation in ChemL among the RI strains because each vertebral body had the same shortest load transfer path between superior and inferior surfaces—through the cortex. Unexpected relationships such as the relationship between body weight and Tb.Th and the relationships between Tb.Th and cortical traits were also observed.
Phenotypic integration among physical bone traits contributes to whole bone stiffness and strength
The first path model, which tested whether phenotypic integration of cortical, trabecular, and compositional traits arises from genetic variants affecting body weight and vertebral size, and constraints imposed on the amount of tissue that can be used to construct functional vertebrae, fit the data extremely well (χ2 = 9.11; p = 0.76; RMSEA = 0.000). The structural equations derived from the model explained 61–96% of the variation in adult Tt.TMD, RCA, and BV/TV (Fig. 5). The structural equations indicated that if the total amount of tissue used to construct vertebrae is constrained (i.e., fixed Tt.BV) for a given body weight (i.e., fixed weight), a mouse showing a 1 SD decrease in Tt.V (i.e., small vertebral size relative to body size) would also show a 0.76 SD increase in Tt.TMD [0.38 (direct) + −1.42 × 0.80 (indirect)], a 1.42 SD increase in RCA, and a 1.25 SD increase in BV/TV [−1.78 (direct) + −1.42 × −0.37 (indirect)]. The path analysis also confirmed that cortical and trabecular bone traits were functionally related. Path coefficients reflect the strength of association among traits (line thickness). In particular, the proportional amount of cortical bone (RCA) was negatively related (−0.37) to the proportional amount of trabecular bone (BV/TV) and positively related to Tt.TMD (0.80). Thus, holding all other variables fixed, a 1 SD increase in RCA would result in a 0.37 SD decrease in BV/TV and a 0.80 SD increase in Tt.TMD.
FIG. 5.

Path model showing how functional interactions among cortical and trabecular traits compensate for genetic variants affecting vertebral size and contribute to mechanical properties. Path coefficients (located next to arrows), which were calculated using Z-transformed data, represent the magnitude of the direct and indirect relationships between traits. Structural equations were constructed using the path coefficients to specify the interconnected relationships.
The structural equations derived from the path model showed that the functional interactions among Tt.TMD, RCA, and BV/TV explained 66% of adult stiffness and 91% of adult strength. Furthermore, the dependence of adult stiffness and strength on physical bone traits was split equally between Tt.TMD (mineralization) and trabecular BV/TV. These results indicated that mean trait values covaried among the RI strains such that smaller vertebrae relative to body size achieved mechanical functionality by increasing Tt.TMD and the relative amounts of cortical and trabecular bone.
Functional interactions among cortical and trabecular traits
The first path model (Fig. 5) confirmed that trabecular mass and mineralization depend on cortical traits. The inclusion of arrows from RCA to Tt.TMD and BV/TV was critical for the model to fit the data. Reversing the direction of one of these arrows or removing one of these arrows decreased the goodness of fit, suggesting that the relative amount of cortical bone used to construct vertebrae was functionally related to the amount and composition of trabecular bone in the adult structure. Next, path models were constructed to test the robustness of the relationship between cortical and trabecular traits (Figs. 6A and 6B). Total vertebral body cross-sectional area (Tt.Ar) and body weight were included to take body size into consideration. Goodness-of-fit statistics indicated that both models fit the data (Table 4). Model selection statistics (Table 4) indicated that the model with the trabecular traits determining the cortical traits (Fig. 6B) is slightly preferred over the model testing the reverse direction (Fig. 6A). However, caution is recommended in this interpretation because the physical traits are the result of multiple effects, some of which may be influenced by unobserved factors.
FIG. 6.

Path models testing the robustness of the functional interactions among cortical and trabecular traits. (A) Variation in cortical traits dictate observed variation in trabecular traits. (B) Variation in trabecular traits dictate observed variation in cortical traits. Goodness-of-fit statistics indicated that both models fit the data exceptionally well.
Phenotypic integration among physical bone traits contributes to network topology
Including selected percolation parameters to the path model (Fig. 7A) showed that network topology was related to the phenotypic integration among physical bone traits. The structural equations derived from the path model showed that the functional interactions among Tt.TMD, RCA, and BV/TV explained 88% of correlation length (CorrL), 74% of the number of load transfer paths (# paths), and 77% of the percentage of connections to the cortical shell (%hub). These results indicated that the functional interactions among trabecular, cortical, and compositional traits influence how the architecture is designed to transfer load. Thus, the coadaptation of traits in response to genetic variants affecting skeletal size and mass occurred in a manner that created different functional load transfer networks. Mean trait values covaried among the RI strains such that smaller vertebrae relative to body size achieved mechanical functionality by increasing the number of load transfer paths through trabeculae in the center of the vertebral body. Therefore, %hub decreased and CorrL (i.e., load sharing capacity of the network) increased.
FIG. 7.

(A) Path model showing how interactions among trabecular and cortical traits influence network topology. The structural equations showed that the functional interactions among Tt.TMD, RCA, and BV/TV explained 88% of correlation length (CorrL), 74% of the number of load transfer paths (#paths), and 77% of the percentage of connections to the cortical shell (%hub), indicating that the coadaptation of traits in response to genetic variants affecting skeletal size and mass occurred in a manner that created different functional load transfer networks. (B) Removing the physical bone traits (BV/TV, RCA, Tt.TMD) from the path model and directly linking body weight, vertebral size (Tt.V), and the total amount of bone tissue (Tt.BV) to percolation parameters (CorrL, #paths, %hub) resulted in a significant fit between the model and the data indicating that network measures provided by percolation theory coadapt in direct response to genetic variants affecting skeletal size and mass.
The path analysis also showed that network measures provided by percolation theory coadapt in direct response to genetic variants affecting skeletal size and mass (Fig. 7B). Removing the physical bone traits (BV/TV, RCA, Tt.TMD) from the path model and directly linking body weight, vertebral size (Tt.V), and the total amount of bone tissue (Tt.BV) to percolation parameters (CorrL, # paths, %hub) resulted in a significant fit between the model and the data (χ2 = 0.06; p = 0.80; RMSEA = 0.000). The reduced structural equations showed the same relationship between changes in skeletal size and mass, and network topology existed as in the model that included the physical bone traits. Variation in body weight, Tt.V, and Tt.BV accounted for 82% of the variation in CorrL, 70% of the variation in # paths, and 66% of the variation in %hub (reduced structural equations; Figs. 7A and 7B).
DISCUSSION
Phenotypic integration provides insight into the biological basis of skeletal functionality and fragility
The data showed that cortical and trabecular traits are functionally related and that phenotypic integration among trabecular, cortical, and compositional traits plays a key role in achieving organ-level mechanical functionality. Although each of the RI strains inherited a random set of A/J and B6 alleles, examination of trait values across the panel showed that the RI strains did not inherit a random set of traits. Instead, the RI strains inherited highly integrated sets of traits with the apparent aim of transferring load as efficiently as possible (i.e., using limited available resources). The data thus indicated that, within the range of nonpathological genetic variation, there is tremendous order in the way a functional bone is constructed. The variation in trait values observed among inbred mouse strains has traditionally been attributed to genetic factors,(41,42) and several studies have mapped QTLs regulating individual bone traits.(14,43–47) However, the inheritance of nonrandom trait sets by the RI strains indicated that individual bone traits are not regulated by independent genes. These results indicated that variation in cortical and trabecular trait values among inbred mouse strains may also result from adaptive processes that covary traits to achieve mechanical functionality. Because our analysis of adult traits did not allow us to establish the causal nature of these functional relationships, an examination of how cortical and trabecular traits co-develop during growth will be important for determining which traits are directly influenced by genetic variants and which traits are indirectly influenced through compensatory adaptive mechanisms.
The path models presented here provide insight into the genetic basis of skeletal fragility by suggesting that the covariation observed among adult traits is a result of biological processes that coadapt traits during growth. Based on the analyses of the RI strains, smaller vertebrae relative to body size achieved stiffness sufficient for mechanical functionality by increasing TMD and the relative amounts of cortical and trabecular bone. Without this phenotypic integration, smaller vertebrae relative to body size would be unable to support daily loads (i.e., not functional). However, because mineralization is involved, phenotypic integration may lead to a set of traits that is functional for daily loading, yet susceptible to fracture under extreme loading (i.e., fall). This is consistent with previous work examining phenotypic integration in the mouse and human skeletons that offered a different perspective on how fracture susceptibility may arise: (1) some sets of traits arising from phenotypic integration may be susceptible to fracture under challenging physiological conditions and (2) genetic or environmental variants that disrupt the biological processes involved in phenotypic integration would be expected to affect functionality.(10,11)
Systems approach identified functionally related traits
Assessment of physical bone traits that determine mechanical strength of corticocancellous bone largely centers on BMD of individual components (i.e., trabecular BV/TV). However, few studies are conducted with knowledge of the relationships among genes, cellular processes, physical traits of cortical and trabecular bone, and mechanical function. Prior studies reported functional relationships among physical bone traits using correlation analysis.(17,42,48,49) In this study, the observed trait correlations in the bivariate analysis did not fully describe the relationship between traits. However, in a complex system such as bone, the overall nature of the interactions of multiple traits in the context of function is better understood through a systems analysis.(25) The path analysis explained how bone traits interacted and how the interactions defined mechanical functionality. For example, the bivariate analysis (Table 3) showed a positive relationship between BV/TV and Tt.V. The path analysis showed that, in the context of body weight and the amount of bone, Tt.V and BV/TV had a net negative relationship (Fig. 5). Thus, the systems analysis showed the compensatory nature of the relationships among traits that was not evident from the bivariate analysis.
The functional interactions among traits observed in this study resulted from a cross between A/J and B6 inbred mouse strains. We expect that a similar study conducted using a cross between different genotypes (e.g., B6 × C3H/HeJ) may show differences in the functional interactions among traits given that different inbred strains construct vertebral bodies using different amounts of tissue (i.e., different set points).(17,50) However, we expect that traits will be functionally related as this interdependence seems to be part of the inherent adaptive nature of bone.
Integrative network approach can be used to characterize how trait sets contribute to fracture risk
Although traditional measures of cortical and trabecular bone adequately characterize the phenotypes of each bone type, knowledge of the trait values themselves does not fully show how function is established for each genotype. Phenotypic integration ensures that the vertebral body is mechanically functional for normal activity during growth.(22,51,52) However, this design is not perfect, because certain trade-offs establish function that can lead to fracture risk. For example, previous work revealed that slender long bones showed increased mineralization resulting in deleterious consequences in the context of extreme load conditions.(10,11,53,54) This study showed that smaller vertebrae compensated in terms of morphology and increased mineralization, presumably to compensate for limitations of reduced overall size. Whether the compensatory increase in mineralization has a negative effect on postyield properties is more complex in compression than it is in bending and is not understood fully.
Another potentially deleterious outcome could be variation in load transfer characteristics. In engineering, designs often have to balance between competing objectives to satisfy a criterion when available resources are limited.(55) Ongoing work showed that the amount of tissue that can be used to construct a functional structure is genetically defined and limited. Thus, Tt.BV was included as an independent variable in the path models. Together with the limited amount of bone tissue available, the covariation among cortical and trabecular traits resulted in different sets of traits, each having a unique mechanism of transferring load in the cranial–caudal direction. This may lead to the construction of a functional structure for daily activity, but phenotypic integration may have long-term consequences on skeletal fragility because compensatory trait interactions lead to variability in the distribution of loads among cortical and cancellous tissues.
Furthermore, not all genotypes are expected to show the same capacity to maintain strength with aging.(56–58) Age-related changes in bone may be an extension of the inherent adaptive nature of bone that establishes bone strength during growth. It is unclear how genetic variation in osteoblast and osteoclast activity on existing bone surfaces impacts whole bone mechanical properties with aging.(59) The age-related changes in trabecular bone mass are associated with age-related changes in cortical bone morphology, suggesting that expansion of the cortical shell may compensate mechanically for the loss of trabecular bone mass.(18) How the compensatory relationship between cortical and trabecular traits affects the ability of bone to maintain function with aging is not understood fully. Analysis of variability in aging across the RI panel provides a model to begin to understand these complex interactions in more quantitative ways. Furthermore, we previously developed novel traits based on percolation theory to quantify the architecture of the vertebral body in an integrative way.(30) The percolation parameters provide quantitative measures of the load transferring behavior of a developing system as a function of the connected cortical and trabecular components. The network topology of the adult structure (quantified by percolation theory) thus has potential for determining the structural stability, dynamic behavior, robustness, and attack tolerance of a structure caused by loss with aging.(30)
Interdependence among cortical and trabecular traits has relevance to genetic and environmental perturbation studies
Trabecular bone begins as an isotropic structure and then matures during growth into a highly adapted, anisotropic structure.(51,60) Given that physiological forces are important for the normal development of trabecular tissue, the amount of load imparted to the trabecular tissue during growth may be a critical determinant of adult bone mass and architecture. The amount of load imparted to the trabecular tissue will depend on the amount of load borne by the cortical shell. Paths critical to load transfer are expected to be retained and paths that are not critical to load transfer would be expected to be resorbed. Thus, the degree of load sharing between the cortical and trabecular components during growth may play an important role in the development of trabecular bone. Furthermore, the degree of load sharing will depend on the genetic and/or environmental factors affecting the structural stiffness of the cortical shell.
Because the relationships between RCA and Tt.TMD and between RCA and BV/TV were critical for the path model of the mouse vertebral body (Fig. 5), we examined the specific nature of the relationships between cortical and trabecular traits. We postulate that there exists a temporal and ordered relationship between cortical and trabecular traits such that during growth, the amount and composition of the cortical shell determine the amount, morphology, and composition of the trabecular bone in corticocancellous structures (Fig. 1). Although the model with the trabecular traits determining the cortical traits was slightly preferred based on model selection criteria (Table 4), both models (Fig. 6) fit the data well, indicating that the functional relationships are tightly coupled, and it is not possible to clearly state which traits determine which. Thus, the true nature of the relationship between adult cortical and trabecular traits may not be determined without knowledge of how the traits develop over multiple time points during growth.(27,60,61) Furthermore, the data provide an integrative approach for interpreting genetic and environmental perturbation studies. Rather than simply characterizing the effect of perturbations on cortical and trabecular traits independently, genetic or environmental perturbations during growth would be expected to affect both components because of the interdependence among cortical and trabecular traits.(18,19) Perturbations after the maturation process would be expected to have much less effect on multiple traits. Thus, understanding the biological control mechanisms coordinating the set of trabecular and cortical traits into functional networks during growth and with aging is important to improving analyses studying the genetic basis of skeletal fragility.
Phenotypic integration in inbred mouse vertebrae has relevance to the human skeleton
Inbred mouse models have proven to be an extremely valuable resource for understanding the genetic basis of complex traits.(48) RI mouse strains are a powerful experimental model to quantify phenotypic integration among traits.(25,26) Random segregation of naturally occurring allelic variants during meiosis results in each RI strain having a random assortment of parental genomic regions. This randomization results in a wide range of phenotypes among the strains. The specific combination of adult traits for each RI strain is a reflection of how the particular genes for that strain work together to influence cellular activities involved in phenotypic integration.
Inbred mouse models also have proven to be reliable models for studying both growth(27) and aging(18,62) of human bone. Although mouse bone is small and does not have an extensive osteonal microstructure compared with human bone, the biological concepts learned from the mouse diaphysis(10,53) have been successfully translated to the human skeleton.(11,63,64) This suggests that phenotypic integration needed to establish mechanical function is similar in mouse and human long bone. Although the mouse vertebral body has proportionally fewer trabeculae compared with the human vertebral body, the age-related changes in mouse trabecular bone and the associated changes in the cortex are consistent with those observed in the human skeleton.(18) Furthermore, the cortical shell of the mouse vertebral body comprises 20–26% of the total area fraction of the structure, consistent with the human vertebrae.(23) Mouse models in spine research are limited in the comparison with human vertebrae because of differences in posture and locomotive forces. However, recent studies have shown that tensile forces from muscles and ligaments control the posture of a quadruped spine, and consequently, the spine is mainly loaded by axial compression.(65) Thus, the mouse vertebral body provides a relevant model to study phenotypic integration in the human skeleton.
Summary
The results of this study showed that phenotypic integration among trabecular and cortical traits contributes to the mechanical functionality of corticocancellous structures. Based on the RI analysis, smaller vertebrae relative to body size achieved stiffness sufficient for mechanical functionality by increasing TMD and the relative amounts of cortical and trabecular bone. A network analysis using measures provided by percolation theory indicated that this phenotypic integration among cortical and trabecular traits responds to genetic variants affecting skeletal size and mass relative to body size in a manner that creates functional load transfer networks. Together, the data suggested that there is tremendous order in the way a functional bone is constructed. This order, which improved the predictability of whole bone mechanical properties, may be necessary to buffer the deleterious effects of certain genetic variants by allowing the skeletal system to construct functional structures in different ways. The impact of these various heritable trait sets on fracture susceptibility later in life has yet to be determined. The current data are consistent with previous work examining phenotypic integration in the mouse and human long bones.(10,11) The results of these studies and this study have great clinical significance because they provide two new areas of focus in studying skeletal fragility: (1) sets of traits arising from phenotypic integration that may be susceptible to fracture under challenging physiological conditions and (2) genetic or environmental variants that disrupt the biological processes involved in phenotypic integration and thus affect functionality. This study showed that, together, the systems and network analyses offer the potential to identify sets of traits that are susceptible to fracture and the biological mechanisms controlling phenotypic integration for corticocancellous structures. A better understanding of the genetic factors regulating the interaction among sets of traits will allow genetic analyses to be conducted in a novel way by focusing on the processes that establish function, rather than on individual trait values alone.
ACKNOWLEDGMENTS
We thank the National Institutes of Health (AR44927, RR12305) for support of this research.
REFERENCES
- 1.Albright F, Smith PH, Richardson AM. Post-menopausal osteoporosis. Its clinical features. JAMA. 1941;116:2465–2474. [Google Scholar]
- 2.Beck TJ, Ruff CB, Mourtada FA, Shaffer RA, Maxwell-Williams K, Kao GL, Sartoris DJ, Brodine S. Dual-energy X-ray absorptiometry derived structural geometry for stress fracture prediction in male U.S. Marine Corps recruits. J Bone Miner Res. 1996;11:645–653. doi: 10.1002/jbmr.5650110512. [DOI] [PubMed] [Google Scholar]
- 3.Duan Y, Parfitt A, Seeman E. Vertebral bone mass, size, and volumetric density in women with spinal fractures. J Bone Miner Res. 1999;14:1796–1802. doi: 10.1359/jbmr.1999.14.10.1796. [DOI] [PubMed] [Google Scholar]
- 4.Duan Y, Seeman E, Turner CH. The biomechanical basis of vertebral body fragility in men and women. J Bone Miner Res. 2001;16:2276–2283. doi: 10.1359/jbmr.2001.16.12.2276. [DOI] [PubMed] [Google Scholar]
- 5.Duan Y, Turner CH, Kim BT, Seeman E. Sexual dimorphism in vertebral fragility is more the result of gender differences in age-related bone gain than bone loss. J Bone Miner Res. 2001;16:2267–2275. doi: 10.1359/jbmr.2001.16.12.2267. [DOI] [PubMed] [Google Scholar]
- 6.Giladi M, Milgrom C, Simkin A, Stein M, Kashtan H, Margulies J, Rand N, Chisin R, Steinberg R, Aharonson Z. Stress fractures and tibial bone width. A risk factor. J Bone Joint Surg Br. 1987;69:326–329. doi: 10.1302/0301-620X.69B2.3818769. [DOI] [PubMed] [Google Scholar]
- 7.Gilsanz V, Loro ML, Roe TF, Sayre J, Gilsanz R, Schulz EE. Vertebral size in elderly women with osteoporosis. Mechanical implications and relationship to fractures. J Clin Invest. 1995;95:2332–2337. doi: 10.1172/JCI117925. [DOI] [PMC free article] [PubMed] [Google Scholar]
- 8.Milgrom C, Giladi M, Simkin A, Rand N, Kedem R, Kashtan H, Stein M, Gomori M. The area moment of inertia of the tibia: A risk factor for stress fractures. J Biomech. 1989;22:1243–1248. doi: 10.1016/0021-9290(89)90226-1. [DOI] [PubMed] [Google Scholar]
- 9.Vega E, Ghiringhelli G, Mautalen C, Rey Valzacchi G, Scaglia H, Zylberstein C. Bone mineral density and bone size in men with primary osteoporosis and vertebral fractures. Calcif Tissue Int. 1998;62:465–469. doi: 10.1007/s002239900462. [DOI] [PubMed] [Google Scholar]
- 10.Jepsen KJ, Hu B, Tommasini SM, Courtland HW, Price C, Terranova CJ, Nadeau JH. Genetic randomization reveals functional relationships among morphologic and tissue-quality traits that contribute to bone strength and fragility. Mamm Genome. 2007;18:492–507. doi: 10.1007/s00335-007-9017-5. [DOI] [PMC free article] [PubMed] [Google Scholar]
- 11.Tommasini SM, Nasser P, Hu B, Jepsen KJ. Biological co-adaptation of morphological and composition traits contributes to mechanical functionality and skeletal fragility. J Bone Miner Res. 2008;23:236–246. doi: 10.1359/JBMR.071014. [DOI] [PMC free article] [PubMed] [Google Scholar]
- 12.National Osteoporosis Foundation. National Osteoporosis Foundation Fast Facts on Osteoporosis. Available online at http://www.nof.org/osteoporosis/diseasefacts.htm. Accessed May 20, 2008.
- 13.Kohler T, Stauber M, Donahue LR, Muller R. Automated compartmental analysis for high-throughput skeletal phenotyping in femora of genetic mouse models. Bone. 2007;41:659–667. doi: 10.1016/j.bone.2007.05.018. [DOI] [PubMed] [Google Scholar]
- 14.Bouxsein ML, Uchiyama T, Rosen CJ, Shultz KL, Donahue LR, Turner CH, Sen S, Churchill GA, Muller R, Beamer WG. Mapping quantitative trait loci for vertebral trabecular bone volume fraction and microarchitecture in mice. J Bone Miner Res. 2004;19:587–599. doi: 10.1359/JBMR.0301255. [DOI] [PubMed] [Google Scholar]
- 15.Patterson PH, Cook ME, Crenshaw TD, Sunde ML. Mechanical properties of the tibiotarsus of broilers and poults loaded with artificial weight and fed various dietary protein levels. Poult Sci. 1986;65:1357–1364. doi: 10.3382/ps.0651357. [DOI] [PubMed] [Google Scholar]
- 16.Faulkner RA, Bailey DA. Osteoporosis: A pediatric concern? Med Sport Sci. 2007;51:1–12. doi: 10.1159/000102993. [DOI] [PubMed] [Google Scholar]
- 17.Tommasini SM, Morgan TG, van der Meulen M, Jepsen KJ. Genetic variation in structure-function relationships for the inbred mouse lumbar vertebral body. J Bone Miner Res. 2005;20:817–827. doi: 10.1359/JBMR.041234. [DOI] [PubMed] [Google Scholar]
- 18.Glatt V, Canalis E, Stadmeyer L, Bouxsein ML. Age-related changes in trabecular architecture differ in female and male C57BL/6J mice. J Bone Miner Res. 2007;22:1197–1207. doi: 10.1359/jbmr.070507. [DOI] [PubMed] [Google Scholar]
- 19.Waarsing JH, Day JS, Verhaar JA, Ederveen AG, Weinans H. Bone loss dynamics result in trabecular alignment in aging and ovariectomized rats. J Orthop Res. 2006;24:926–935. doi: 10.1002/jor.20063. [DOI] [PubMed] [Google Scholar]
- 20.Cheverud JM. Developmental integration and the evolution of pleiotropy. Am Zool. 1996;36:44–50. [Google Scholar]
- 21.Currey JD, Alexander RMcN. The thickness of the walls of tubular bones. J Zool. 1985;206:453–468. [Google Scholar]
- 22.Frost HM. Bone “mass” and the “mechanostat”: A proposal. Anat Rec. 1987;219:1–9. doi: 10.1002/ar.1092190104. [DOI] [PubMed] [Google Scholar]
- 23.Eswaran SK, Gupta A, Adams MF, Keaveny TM. Cortical and trabecular load sharing in the human vertebral body. J Bone Miner Res. 2006;21:307–314. doi: 10.1359/jbmr.2006.21.2.307. [DOI] [PubMed] [Google Scholar]
- 24.Silva MJ, Keaveny TM, Hayes WC. Load sharing between the shell and centrum in the lumbar vertebral body. Spine. 1997;22:140–150. doi: 10.1097/00007632-199701150-00004. [DOI] [PubMed] [Google Scholar]
- 25.Nadeau JH, Burrage LC, Restivo J, Pao YH, Churchill G, Hoit BD. Pleiotropy, homeostasis, and functional networks based on assays of cardiovascular traits in genetically randomized populations. Genome Res. 2003;13:2082–2091. doi: 10.1101/gr.1186603. [DOI] [PMC free article] [PubMed] [Google Scholar]
- 26.Li R, Tsaih SW, Shockley K, Stylianou IM, Wergedal J, Paigen B, Churchill GA. Structural model analysis of multiple quantitative traits. PLoS Genet. 2006;2:e114. doi: 10.1371/journal.pgen.0020114. [DOI] [PMC free article] [PubMed] [Google Scholar]
- 27.Price C, Herman BC, Lufkin T, Goldman HM, Jepsen KJ. Genetic variation in bone growth patterns defines adult mouse bone fragility. J Bone Miner Res. 2005;20:1983–1991. doi: 10.1359/JBMR.050707. [DOI] [PubMed] [Google Scholar]
- 28.Gustafson MB, Martin RB, Gibson V, Storms DH, Stover SM, Gibeling J, Griffin L. Calcium buffering is required to maintain bone stiffness in saline solution. J Biomech. 1996;29:1191–1194. doi: 10.1016/0021-9290(96)00020-6. [DOI] [PubMed] [Google Scholar]
- 29.Otsu N. A threshold selection method from gray-level histograms. IEEE Trans Syst Man Cybern. 1979;9:62–66. [Google Scholar]
- 30.Tommasini SM, Wearne SL, Hof PR, Jepsen KJ. Percolation theory relates corticocancellous architecture to mechanical function in vertebrae of inbred mouse strains. Bone. 2008;42:743–750. doi: 10.1016/j.bone.2007.12.009. [DOI] [PMC free article] [PubMed] [Google Scholar]
- 31.Churchill GA, Doerge RW. Empirical threshold values for quantitative trait mapping. Genetics. 1994;138:963–971. doi: 10.1093/genetics/138.3.963. [DOI] [PMC free article] [PubMed] [Google Scholar]
- 32.Belknap JK. Effect of within-strain sample size on QTL detection and mapping using recombinant inbred mouse strains. Behav Genet. 1998;28:29–38. doi: 10.1023/a:1021404714631. [DOI] [PubMed] [Google Scholar]
- 33.Grace JB. Cambridge, United Kingdom: Cambridge University Press; 2006. Structural Equation Modeling and Natural Systems. [Google Scholar]
- 34.Linkhart TA, Linkhart SG, Kodama Y, Farley JR, Dimai HP, Wright KR, Wergedal JE, Sheng M, Beamer WG, Donahue LR, Rosen CJ, Baylink DJ. Osteoclast formation in bone marrow cultures from two inbred strains of mice with different bone densities. J Bone Miner Res. 1999;14:39–46. doi: 10.1359/jbmr.1999.14.1.39. [DOI] [PubMed] [Google Scholar]
- 35.Sharkey NA, Lang DH. Genes in context: Probing the genetics of fracture resistance. Exerc Sport Sci Rev. 2007;35:86–96. doi: 10.1097/jes.0b013e31809ff2ca. [DOI] [PubMed] [Google Scholar]
- 36.MacCallum RC, Hong S. Power analysis in covariance structural modeling using GFI and AGFI. Multivariate Behav Res. 1997;32:193–210. doi: 10.1207/s15327906mbr3202_5. [DOI] [PubMed] [Google Scholar]
- 37.Stieger JH, Lind JM. Statistically based tests for the number of common factors. Annual Meeting of the Psychometric Society; May 28–30, 1980; Iowa City, IA, USA. 1980. [Google Scholar]
- 38.Akaike H. Information theory as an extension of the maximum likelihood principle. In: Petrov B, Csaki F, editors. Second Inernational Symposium on Information Theory. Budapest, Hungary: Akademiai Kiado; 1973. pp. 297–281. [Google Scholar]
- 39.Burnham K, Anderson D. New York, NY, USA: Springer; 1998. Model Selection and Multimodel Inference: A Practical Information-Theoretic Approach. [Google Scholar]
- 40.Browne M, Cudeck R. Alternative ways of assessing model fit. In: Bollen K, Long S, editors. Testing Structural Equation Models. Thousand Oaks, CA, USA: Sage Press; 1993. pp. 136–162. [Google Scholar]
- 41.Beamer WG, Donahue LR, Rosen CJ, Baylink DJ. Genetic variability in adult bone density among inbred strains of mice. Bone. 1996;18:397–403. doi: 10.1016/8756-3282(96)00047-6. [DOI] [PubMed] [Google Scholar]
- 42.Turner CH, Hsieh YF, Muller R, Bouxsein ML, Baylink DJ, Rosen CJ, Grynpas MD, Donahue LR, Beamer WG. Genetic regulation of cortical and trabecular bone strength and microstructure in inbred strains of mice. J Bone Miner Res. 2000;15:1126–1131. doi: 10.1359/jbmr.2000.15.6.1126. [DOI] [PubMed] [Google Scholar]
- 43.Beamer WG, Shultz KL, Churchill GA, Frankel WN, Baylink DJ, Rosen CJ, Donahue LR. Quantitative trait loci for bone density in C57BL/6J and CAST/EiJ inbred mice. Mamm Genome. 1999;10:1043–1049. doi: 10.1007/s003359901159. [DOI] [PubMed] [Google Scholar]
- 44.Bower AL, Lang DH, Vogler GP, Vandenbergh DJ, Blizard DA, Stout JT, McClearn GE, Sharkey NA. QTL analysis of trabecular bone in BXD F2 and RI mice. J Bone Miner Res. 2006;21:1267–1275. doi: 10.1359/jbmr.060501. [DOI] [PubMed] [Google Scholar]
- 45.Klein RF, Mitchell SR, Phillips TJ, Belknap JK, Orwoll ES. Quantitative trait loci affecting peak bone mineral density in mice. J Bone Miner Res. 1998;13:1648–1656. doi: 10.1359/jbmr.1998.13.11.1648. [DOI] [PubMed] [Google Scholar]
- 46.Lang DH, Sharkey NA, Mack HA, Vogler GP, Vandenbergh DJ, Blizard DA, Stout JT, McClearn GE. Quantitative trait loci analysis of structural and material skeletal phenotypes in C57BL/6J and DBA/2 second-generation and recombinant inbred mice. J Bone Miner Res. 2005;20:88–99. doi: 10.1359/JBMR.041001. [DOI] [PMC free article] [PubMed] [Google Scholar]
- 47.Volkman SK, Galecki AT, Burke DT, Paczas MR, Moalli MR, Miller RA, Goldstein SA. Quantitative trait loci for femoral size and shape in a genetically heterogeneous mouse population. J Bone Miner Res. 2003;18:1497–1505. doi: 10.1359/jbmr.2003.18.8.1497. [DOI] [PubMed] [Google Scholar]
- 48.Rosen CJ, Beamer WG, Donahue LR. Defining the genetics of osteoporosis: Using the mouse to understand man. Osteoporos Int. 2001;12:803–810. doi: 10.1007/s001980170030. [DOI] [PubMed] [Google Scholar]
- 49.Ng AH, Wang SX, Turner CH, Beamer WG, Grynpas MD. Bone quality and bone strength in BXH recombinant inbred mice. Calcif Tissue Int. 2007;81:215–223. doi: 10.1007/s00223-007-9047-8. [DOI] [PubMed] [Google Scholar]
- 50.Turner CH, Hsieh YF, Muller R, Bouxsein ML, Rosen CJ, McCrann ME, Donahue LR, Beamer WG. Variation in bone biomechanical properties, microstructure, and density in BXH recombinant inbred mice. J Bone Miner Res. 2001;16:206–213. doi: 10.1359/jbmr.2001.16.2.206. [DOI] [PubMed] [Google Scholar]
- 51.Tanck E, Hannink G, Ruimerman R, Buma P, Burger EH, Huiskes R. Cortical bone development under the growth plate is regulated by mechanical load transfer. J Anat. 2006;208:73–79. doi: 10.1111/j.1469-7580.2006.00503.x. [DOI] [PMC free article] [PubMed] [Google Scholar]
- 52.van Oers RF, Ruimerman R, Tanck E, Hilbers PA, Huiskes R. A unified theory for osteonal and hemi-osteonal remodeling. Bone. 2008;42:250–259. doi: 10.1016/j.bone.2007.10.009. [DOI] [PubMed] [Google Scholar]
- 53.Jepsen KJ, Akkus OJ, Majeska RJ, Nadeau JH. Hierarchical relationship between bone traits and mechanical properties in inbred mice. Mamm Genome. 2003;14:97–104. doi: 10.1007/s00335-002-3045-y. [DOI] [PubMed] [Google Scholar]
- 54.Jepsen KJ, Pennington DE, Lee YL, Warman M, Nadeau J. Bone brittleness varies with genetic background in A/J and C57BL/6J inbred mice. J Bone Miner Res. 2001;16:1854–1862. doi: 10.1359/jbmr.2001.16.10.1854. [DOI] [PubMed] [Google Scholar]
- 55.Petroski H. NY, USA: Vintage, New York; 2004. Small Things Considered: Why There Is No Perfect Design. [Google Scholar]
- 56.Duan Y, Wang XF, Evans A, Seeman E. Structural and biomechanical basis of racial and sex differences in vertebral fragility in Chinese and Caucasians. Bone. 2005;36:987–998. doi: 10.1016/j.bone.2004.11.016. [DOI] [PubMed] [Google Scholar]
- 57.Christian JC, Yu PL, Slemenda CW, Johnston CC., Jr Heritability of bone mass: A longitudinal study in aging male twins. Am J Hum Genet. 1989;44:429–433. [PMC free article] [PubMed] [Google Scholar]
- 58.Kelly PJ, Nguyen T, Hopper J, Pocock N, Sambrook P, Eisman J. Changes in axial bone density with age: A twin study. J Bone Miner Res. 1993;8:11–17. doi: 10.1002/jbmr.5650080103. [DOI] [PubMed] [Google Scholar]
- 59.Waarsing JH, Day JS, van der Linden JC, Ederveen AG, Spanjers C, De Clerck N, Sasov A, Verhaar JA, Weinans H. Detecting and tracking local changes in the tibiae of individual rats: A novel method to analyse longitudinal in vivo micro-CT data. Bone. 2004;34:163–169. doi: 10.1016/j.bone.2003.08.012. [DOI] [PubMed] [Google Scholar]
- 60.Fazzalari NL, Moore AJ, Byers S, Byard RW. Quantitative analysis of trabecular morphogenesis in the human costochondral junction during the postnatal period in normal subjects. Anat Rec. 1997;248:1–12. doi: 10.1002/(SICI)1097-0185(199705)248:1<1::AID-AR1>3.0.CO;2-Z. [DOI] [PubMed] [Google Scholar]
- 61.Tanck E, Homminga J, van Lenthe GH, Huiskes R. Increase in bone volume fraction precedes architectural adaptation in growing bone. Bone. 2001;28:650–654. doi: 10.1016/s8756-3282(01)00464-1. [DOI] [PubMed] [Google Scholar]
- 62.Halloran BP, Ferguson VL, Simske SJ, Burghardt A, Venton LL, Majumdar S. Changes in bone structure and mass with advancing age in the male C57BL/6J mouse. J Bone Miner Res. 2002;17:1044–1050. doi: 10.1359/jbmr.2002.17.6.1044. [DOI] [PubMed] [Google Scholar]
- 63.Tommasini SM, Nasser P, Jepsen KJ. Sexual dimorphism affects tibia size and shape but not tissue-level mechanical properties. Bone. 2007;40:498–505. doi: 10.1016/j.bone.2006.08.012. [DOI] [PubMed] [Google Scholar]
- 64.Tommasini SM, Nasser P, Schaffler MB, Jepsen KJ. The relationship between bone morphology and bone quality in male tibiae: Implications for stress fracture risk. J Bone Miner Res. 2005;20:1372–1380. doi: 10.1359/JBMR.050326. [DOI] [PubMed] [Google Scholar]
- 65.Smit TH. The use of a quadruped as an in vivo model for the study of the spine - biomechanical considerations. Eur Spine J. 2002;11:137–144. doi: 10.1007/s005860100346. [DOI] [PMC free article] [PubMed] [Google Scholar]