

Abstract
Glucocorticoid (GC) effects on skeletal development have not been established. The objective of this pQCT study was to assess volumetric BMD (vBMD) and cortical dimensions in childhood steroid-sensitive nephrotic syndrome (SSNS), a disorder with minimal independent deleterious skeletal effects. Tibia pQCT was used to assess trabecular and cortical vBMD, cortical dimensions, and muscle area in 55 SSNS (age, 5–19 yr) and >650 control participants. Race-, sex-, and age-, or tibia length–specific Z-scores were generated for pQCT outcomes. Bone biomarkers included bone-specific alkaline phosphatase and urinary deoxypyridinoline. SSNS participants had lower height Z-scores (p < 0.0001) compared with controls. In SSNS, Z-scores for cortical area were greater (+0.37; 95% CI = 0.09, 0.66; p = 0.01), for cortical vBMD were greater (+1.17; 95% CI = 0.89, 1.45; p < 0.0001), and for trabecular vBMD were lower (−0.60; 95% CI, = −0.89, −0.31; p < 0.0001) compared with controls. Muscle area (+0.34; 95% CI = 0.08, 0.61; p = 0.01) and fat area (+0.56; 95% CI = 0.27, 0.84; p < 0.001) Z-scores were greater in SSNS, and adjustment for muscle area eliminated the greater cortical area in SSNS. Bone formation and resorption biomarkers were significantly and inversely associated with cortical vBMD in SSNS and controls and were significantly lower in the 34 SSNS participants taking GCs at the time of the study compared with controls. In conclusion, GCs in SSNS were associated with significantly greater cortical vBMD and cortical area and lower trabecular vBMD, with evidence of low bone turnover. Lower bone biomarkers were associated with greater cortical vBMD. Studies are needed to determine the fracture implications of these varied effects.
Key words: nephrotic syndrome, glucocorticoids, children, pQCT, BMD
INTRODUCTION
Glucocorticoid (GC) medications are highly effective and widely prescribed for the treatment of varied inflammatory conditions in children and adults. However, GC therapy in children is associated with multiple adverse side effects, including obesity, impaired linear growth, and increased fracture rates.(1,2) Numerous studies in adults and animal models have shown that GCs result in preferential trabecular bone loss.(3,4) The effects of GCs on cortical volumetric BMD (vBMD) and dimensions have not been established. Studies have consistently shown that GCs result in sustained reductions in bone formation because of decreased osteoblast differentiation and activity and increased osteoblast and osteocyte apoptosis.(5) However, studies of GC effects on bone resorption have produced conflicting results. GCs promote osteoclastogenesis and inhibit osteoclast apoptosis(4); however, GCs also directly impair osteoclast adherence to bone and bone degradation,(6) resulting in a state of low bone turnover. The growing skeleton may be particularly vulnerable to the detrimental effects of chronic GC therapy on bone metabolism.
Inflammation, the target of GC therapy, has multiple deleterious effects on bone metabolism. Similar to the effects of GCs, pro-inflammatory cytokines, such as TNF-α and interleukin-6 (IL-6), inhibit osteoblast differentiation and function and promote osteoblast and osteocyte apoptosis.(7,8) These cytokines also promote osteoclastogenesis and bone resorption.(9,10) Therefore, studies of the effects of GC therapy on bone metabolism, density, and structure in patients with chronic inflammatory conditions may be confounded by these underlying cytokine effects.
Most childhood diseases that are treated with chronic GCs, such as inflammatory bowel disease and juvenile idiopathic arthritis, are characterized by persistent inflammation and elevated cytokine levels. In contrast, childhood steroid sensitive nephrotic syndrome (SSNS) responds promptly and completely to GC therapy, and the nephrotic state is quiescent during high-dose GC therapy. Unfortunately, SSNS relapses in the majority of children when the GCs are reduced, resulting in protracted, repeated courses of GCs. The standard prednisone dose for relapses is 2 mg/kg/d,(11) far exceeding the 5 mg/d considered a risk factor for GC-induced osteoporosis in adults.(12) Although SSNS relapses are associated with transient increases in cytokines, these abnormalities promptly resolve with GC therapy and disease remission.(13) Therefore, we propose SSNS as a clinical model, without significant systemic inflammation, to examine the independent effects of GCs on the growing skeleton.
We previously used DXA to examine GC effects on bone and body composition in children with SSNS.(14,15) These studies showed modest deficits in BMC in the lumbar spine but greater whole body BMC and femoral shaft dimensions in the SSNS participants compared with controls. The greater whole body BMC and femoral shaft dimensions were attributed to the greater body mass index (BMI; kg/m2) and lean mass observed in SSNS. However, DXA is a 2D imaging technique that does not provide estimates of trabecular and cortical vBMD or bone dimensions. Therefore, the impact of chronic GCs on these parameters has not been established.
In contrast, pQCT provides 3D estimates of cortical and trabecular compartment vBMD and cortical geometry that are highly correlated with fracture load.(16,17) pQCT also provides measures of muscle and fat cross-sectional area (CSA). The objectives of this study were (1) to use SSNS as a clinical model to determine the effects of chronic high-dose GCs on pQCT measures of trabecular and cortical vBMD and cortical dimensions in children and adolescents, and (2) to determine the effects of GC-associated alterations in body composition on bone outcomes. Secondary analyses examined differences in DXA lumbar spine areal BMD, vitamin D status, and bone biomarkers in SSNS compared with controls.
MATERIALS AND METHODS
Study participants
Children and adolescents diagnosed with SSNS, as defined by the International Society of Kidney Disease in Children,(18) were identified through a systematic review of the medical records in the Division of Nephrology at the Children's Hospital of Philadelphia. Inclusion criteria included age 5–21 yr, normal glomerular filtration rate (GFR; >90 ml/min/1.73 m2) as estimated by the Schwartz formula,(19) at least a 6-mo interval since SSNS diagnosis, and a history of systemic GC therapy for SSNS within the prior 12 mo. Participants were excluded for illnesses or medications, unrelated to SSNS, that may impact growth, nutritional status, pubertal development, or bone accrual. A total of 61 eligible participants were enrolled; however, the data presented here are limited to the 55 subjects in documented urinary remission at the time of the study visit to avoid overestimates of muscle mass and BMI caused by edema.
Participants with SSNS were compared with reference data from healthy controls, ages 5–21 yr. The control participants were recruited from general pediatrics practices in the greater Philadelphia area and through newspaper advertisements. Control participants were ineligible if they had a height or BMI below the third percentile for age and sex or a history of illnesses or medications that may affect growth, nutritional status, pubertal development, or bone accrual. Because of changes in the scanning protocols over the study interval and exclusion of scans with movement or other artifacts, DXA scans of the lumbar spine and pQCT measures of muscle and fat were available for comparison with participants with SSNS in 803–865 control participants, whereas pQCT measures of trabecular and cortical bone outcomes were available in 652–676 control participants. A total of 909 control participants provided pQCT and/or DXA reference data. The distributions of age, sex, race, height, and BMI did not differ across the reference groups contributing data for each measurement.
The study protocol was approved by the Institutional Review Board at the Children's Hospital of Philadelphia. Informed consent was obtained directly from study participants >18 yr of age and assent along with parental consent from participants <18 yr of age.
Anthropometry, physical maturity, and race
Height was measured with a stadiometer (Holtain, Crymych, UK) and weight with a digital scale (Scaletronix, White Plains, NY, USA). The stage of pubertal development was determined using a validated self-assessment questionnaire and classified according to the method of Tanner.(20,21) A questionnaire regarding menstrual histories was administered. Study participants and their parents were asked to categorize the participant's race according to the NIH categories.
SSNS disease characteristics and medications
The medical charts were reviewed for date of diagnosis of SSNS, prior therapies, and current medications. Participants and parents were interviewed at the study visit to confirm current medications and the date of the last dose of oral or intravenous GC therapy.
Bone and muscle assessment by pQCT
Bone and muscle measures in the left tibia were obtained by pQCT using a Stratec XCT2000 device (Orthometrix, White Plains, NY, USA) with a 12-detector unit, voxel size of 0.4 mm, slice thickness of 2.3 mm, and scan speed of 25 mm/s. Scans were analyzed with Stratec software version 5.50. A scout view was obtained to place the reference line at the proximal border of the distal tibia growth plate, and measurements were obtained at 3% and 38% of tibia length proximal to the reference line. At the 3% metaphyseal site, scans were analyzed for trabecular vBMD (TrabBMD, mg/cm3). At the 38% diaphyseal site, scans were analyzed for cortical vBMD (CortBMD, mg/cm3), cortical content (CortBMC, mg), cortical CSA (mm2), periosteal circumference (mm), endosteal circumference (mm), polar section modulus (Zp, mm3), and polar strength strain index (SSIp, mm3). The Zp is a function of the cortical periosteal and endosteal dimensions and is strongly associated with bone failure load.(16) SSIp, another commonly reported correlate of failure load, is the integrated product of the Zp and cortical vBMD.(22) Muscle CSA (mm2) and fat CSA (mm2) were evaluated at the 66% site. The manufacturer's hydroxyapatite phantom was scanned daily for quality assurance. In our laboratory, the CV for short-term precision ranged from 0.5% to 1.6% for pQCT outcomes in children and adolescents.
DXA
DXA scans of the spine were performed using a Delphi/Discovery (Hologic, Bedford, MA, USA) densitometer with a fan beam in the array mode, and analyzed with software version 12.3. DXA scans of the posteroanterior (PA; L1–L4) and lateral lumbar spine (L2–L4) were obtained using standardized positioning techniques in the supine position. Measures of areal BMD (g/cm2) were derived from the PA scan of L1–L4. Because of rib interference with L2 in 31% of participants and iliac crest interference with L4 in 17% of participants on the lateral scans, the lateral scan results were limited to L3. Paired PA-lateral DXA scans of lumbar vertebrae L3 were used to derive width-adjusted BMD (WA BMD; g/cm3).(23) This technique incorporates the dimensions of the vertebral body on the PA and lateral scans to estimate vertebral volume. Vertebral body BMC is measured on the lateral scan, thereby excluding the cortical spinous processes, and is divided by the estimate of vertebral volume to generate WA-BMD.
PA spine scans of a lumbar spine phantom were performed daily. In our institution, the in vitro CV for PA spine scans was <0.6% and the in vivo CV in adults was 1.0%. Precision data for the lateral spine are not available in children; however, in adults, the CV for supine lateral L3 measurements was 1–4%.(24,25)
Laboratory studies
Nonfasting blood and urine specimens were collected at the time of the study visit. Serum bone-specific alkaline phosphatase (BSALP; μg/liter) was measured as a marker of bone formation in the participants with SSNS and in the 409 controls that agreed to phlebotomy. BSALP was performed at Quest Diagnostics Laboratories (San Juan Capistrano, CA, USA) using a two-site immunoradiometric assay with an interassay CV of 8.5%. The ratio of urinary deoxypyridinoline to creatinine (DPD; nmol/mmol creatinine) in a nonfasting spot sample was used as a marker of bone resorption in the SSNS participants and in 612 controls. Urine DPD was assayed using high-performance liquid chromatography at Quest Diagnostics Laboratories, with an interassay CV of 7.8%.
Serum 25(OH)D and 1,25(OH)2D were quantified by radioimmunoassay with I125-labeled tracer; the interassay CV ranged from 2% to 9%.(26) Vitamin D deficiency was defined as a 25(OH)D level <15 ng/ml. Intact PTH (iPTH) levels were measured with the Nichols chemiluminescence assay, with an interassay CV of 7–9%. Serum vitamin D and iPTH levels in the controls that were assayed with the same method used in the SSNS participants were available in 207 and 554 participants, respectively.
Statistical analysis
Stata 9.0 (Stata Corp., College Station, TX, USA) was used for all statistical analyses. A p value of <0.05 was considered statistically significant, and two-sided tests of hypotheses were used throughout. Group differences were assessed using Student's t-test or the Wilcoxon rank sum test if the data were not normally distributed. Differences in proportions were assessed using the χ2 test.
Age- and sex-specific Z-scores (SD scores) for height and BMI were calculated using National Center for Health Statistics 2000 Center for Disease Control growth data.(27) Obesity was defined as a BMI greater than the 95th percentile for age and sex.(28) The pQCT and DXA outcomes were converted to Z-scores using the LMS method,(29) which accounts for the nonlinearity, heteroscedasticity, and skew of bone data in growing children. All of the DXA and pQCT Z-scores were sex and race specific (black versus all others) and were generated using the LMS Chartmaker Program version 2.3 based on the data in the healthy controls.(30) The pQCT density outcomes (TrabBMD and CortBMD) and the DXA spine outcomes (PA areal BMD and WA BMD) were assessed relative to age. The remaining pQCT outcomes (CortBMC, cortical CSA, endosteal and periosteal circumference, Zp, SSIp, muscle CSA, and fat CSA) were highly correlated with tibia length (all p < 0.0001); therefore, the Z-scores for these parameters were generated relative to tibia length. The LMS method fits three parameters (LMS) as cubic splines by nonlinear regression. The three parameters represent the median (M), SD (S), and power in the Box-Cox transformation (L) that vary as a function of age (for BMD measures) or tibia length (for cortical dimensions, muscle, and fat measures). The LMS method does not allow for simultaneous adjustment for age and tibia length. Therefore, the Z-scores that were generated relative to tibia length were subsequently adjusted for age using linear regression analyses with age2 also included, as indicated. Tanner stage was not significant, independent of age, and was not included in these models.
To determine whether alterations in BMI or body composition contributed to alterations in bone outcomes in the participants with SSNS, multivariate linear regression models were adjusted for BMI or body composition Z-scores. Tanner stage was not significant in these models and was not included.
The biomarkers of bone turnover (BSALP and DPD), serum iPTH, and vitamin D levels were natural log transformed to achieve normal distributions using the lnskew0 function in Stata 9.0. Linear regression models were used to compare the bone turnover biomarkers in SSNS, compared with controls, adjusted for age, sex, Tanner stage, and the significant sex × Tanner interaction,(31) and to examine associations between bone biomarkers and BMD Z-scores, adjusted for age, sex, Tanner stage, and the sex × Tanner interaction. Multivariate logistic regression models were used to determine the odds of vitamin D deficiency in the participants with SSNS, compared with controls, adjusted for age, race, winter season, and BMI Z-score.(32)
RESULTS
Participant and disease characteristics
Demographic and anthropometric characteristics of the participants with SSNS and the reference population are summarized in Table 1. Pubertal maturation was not significantly delayed (assessed as age relative to Tanner stage) in the SSNS participants compared with controls. The proportion of males was significantly greater in participants with SSNS consistent with the demographics of childhood SSNS.(33) The significantly lower height Z-scores, greater BMI Z-scores, and greater prevalence of obesity in the SSNS participants were consistent with GC effects. Among the five girls >12 yr of age, three were menarcheal. The two that had not yet achieved menarche were 12.3 and 13.7 yr of age and Tanner stages 3 and 2, respectively. Among the three menarcheal girls, two reported regular menses and one reported irregular menses; however, she was only 6 mo postmenarcheal.
Table 1.
SSNS and Control Participant Characteristics

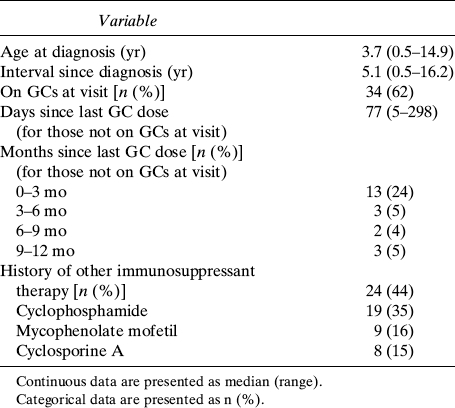
The SSNS disease characteristics are summarized in Table 2. At the time of the study visit, 34 (62%) participants were taking oral GC therapy. Seven participants were taking daily prednisone (median dose [range]: 40 mg/d [36–80 mg/d]) and 25 participants were taking alternate day prednisone (median dose [range]: 25 mg on alternate days [6–80 mg on alternate days]). GC data were incomplete in two participants. The majority of the remaining participants had been treated with GCs in the prior 3-mo interval. Twenty-four (44%) participants had been treated with steroid-sparing therapies including cyclophosphamide, mycophenolate mofetil, and/or cyclosporine A. Among these, four participants had been treated with two medications and four with all three medications in the past. At the time of the study visit, two participants were taking cyclosporine A and five were taking mycophenolate mofetil. No participants were taking diuretics at the time of the study visit. Overall, 6 and 23 SSNS participants had a history of prior short-term therapy with thiazide diuretics or furosemide, respectively.
Table 2.
SSNS Disease Characteristics
pQCT and DXA outcomes
The Z-scores for the pQCT and DXA outcomes in the participants with SSNS are summarized in the first column in Table 3; the p value represents the comparison with the controls. The greatest differences were observed for pQCT measures of trabecular and cortical vBMD. TrabBMD Z-scores were significantly lower (p < 0.0001) and CortBMD Z-scores were significantly greater (p < 0.0001) in SSNS compared with controls. The distributions of the absolute values (mg/cm3) and the Z-scores for CortBMD (Fig. 1) and TrabBMD (Fig. 2) in SSNS and controls are shown relative to age. The figures depicting the absolute values are limited to white males given sex and racial differences in these parameters. Among the participants with SSNS, CortBMD Z-scores were inversely correlated with age (R = −0.46, p < 0.001) and were marginally greater in participants with lower height Z-scores (R = −0.26, p = 0.06). Adjustment of CortBMD Z-scores for cortical thickness or cortical CSA did not alter the results, confirming that group differences were not affected by CT partial volume effects.(34) TrabBMD Z-scores in the participants with SSNS were not associated with age or with height Z-scores. CortBMD Z-scores were comparable in males and females with SSNS (1.13 ± 1.19 versus 1.25 ± 1.15; p = 0.70), respectively. There were no significant sex differences in any of the bone parameters presented in Table 3. However, TrabBMD Z-scores were lower in the males compared with females (−0.84 ± 1.53 versus −0.18 ± 1.07; p = 0.09). Height Z-scores and SSNS disease characteristics (age at diagnosis, interval since diagnosis, and GC dose) did not differ between males and females.
Table 3.
pQCT and DXA Outcomes in Participants With SSNS Compared With Controls

FIG. 1.

Distributions of (A) absolute CortBMD (mg/cm3) and (B) CortBMD Z-scores are shown relative to age in SSNS participants and healthy controls. The absolute CortBMD data in A are limited to white males, given race and sex effects on CortBMD. The age-, sex-, and race-specific CortBMD Z-scores in B are shown for all SSNS and control participants. Absolute CortBMD values increase with age in the healthy controls, as expected. The age-specific CortBMD Z-scores do not increase with age in the healthy controls, as expected.
FIG. 2.

Distributions of (A) absolute TrabBMD (mg/cm3) and (B) TrabBMD Z-scores are shown relative to age in SSNS participants and healthy controls. The absolute TrabBMD data in A are limited to white males, given race and sex effects on TrabBMD. The age-, sex-, and race-specific TrabBMD Z-scores in B are shown for all SSNS and control participants. Absolute TrabBMD values increase with age in the healthy controls, as expected. The age-specific TrabBMD Z-scores do not increase with age in the healthy controls, as expected.
The cortical CSA Z-scores were significantly greater in the SSNS participants compared with controls (p = 0.01). The periosteal circumference Z-scores were also greater in SSNS participants compared with controls (0.22; 95% CI, −0.07, 0.51); however, the difference was not significant (p = 0.13). The endosteal circumference Z-scores were comparable in SSNS participants compared with controls (−0.03; 95% CI, −0.28, 0.27; p = 0.98). Both muscle CSA (p = 0.01) and fat CSA (p < 0.001) Z-scores were greater in the participants with SSNS and were highly correlated with BMI Z-scores (muscle: R = 0.53, p < 0.0001; fat: R = 0.85, p < 0.0001).
DXA PA areal BMD Z-scores were comparable in participants with SSNS and controls. However, the WA BMD Z-scores were significantly lower in SSNS (p = 0.002). Although the mean Z-scores for pQCT measures of TrabBMD and DXA measures of WA BMD were comparable in magnitude, the correlation between these measures was only moderate (R = 0.34, p = 0.01).
Within the control participants, greater muscle and BMI Z-scores were each significantly and positively associated with the Z-scores for all of the pQCT and DXA bone outcomes (all p < 0.0001), with the exception of CortBMD (p = 0.34). Given the associations between muscle, BMI, and bone outcomes, each of the bone outcome Z-scores in Table 3 was adjusted for muscle CSA Z-score or BMI Z-score. The second column in Table 3 shows the effects of adjusting the pQCT and DXA outcomes for muscle CSA Z-scores. Consistent with the positive association between muscle and all of the bone Z-scores (except CortBMD) observed in the controls, adjustment for the greater muscle CSA Z-scores in the SSNS subjects decreased the point estimates of all of the bone Z-scores (except CortBMD). When the models were adjusted for muscle CSA Z-scores and fat CSA Z-scores simultaneously, the muscle CSA Z-scores remained significant, but fat CSA Z-scores were not significant in each model (independent of muscle), and inclusion of fat CSA Z-scores in the models did not alter the point estimates for the SSNS effects (data not shown).
Adjustment for BMI Z-score yielded results for pQCT TrabBMD and DXA WA BMD Z-scores that were similar to the effects of adjustment for muscle CSA Z-score. For the CortBMC, cortical CSA, Zp, and SSIp Z-scores, the adjustment for BMI Z-score yielded point estimates for the SSNS effects that were intermediate between the unadjusted estimates and the models adjusted for muscle Z-scores.
Biomarkers of bone turnover
When the participants with SSNS were compared with controls, BSALP and DPD levels were marginally lower (BSALP: β coefficient [95% CI]: −0.04 [−0.09, 0.01], p = 0.09; DPD: −0.15 [−0.30, 0.01], p = 0.06), adjusted for age, sex, and Tanner stage. However, when the analyses were limited to the SSNS participants that were taking GCs at the time of the study visit, adjusted BSALP and DPD levels were significantly lower compared with controls (BSALP: −0.06 [−0.12, −0.001], p = 0.04; DPD: −0.32 [−0.52, −0.12], p = 0.002).
Vitamin D and iPTH levels
The proportion of SSNS participants with vitamin D deficiency (25%) was not significantly greater compared with controls (18%). However, multivariate logistic regression showed that the odds of vitamin D deficiency in SSNS were significantly greater compared with controls (OR = 3.21; 95% CI = 1.26, 8.14; p = 0.014) when adjusted for age, black race, and season. Serum 1,25(OH)2 vitamin D levels were also significantly lower in the participants with SSNS compared with controls (median, 34.6 versus 38.8; p = 0.008) and were not associated with age, race, or season. Furthermore, iPTH levels relative to 25(OH)D and relative to 1,25(OH)2D were significantly lower in SSNS compared with controls (p < 0.001 and p < 0.01, respectively), as evaluated by linear regression. Vitamin D and iPTH levels were not associated with the bone or body composition Z-scores in the healthy controls. However, 25(OH)D levels were positively associated with TrabBMD Z-scores in the SSNS participants (R = 0.34, p < 0.02). TrabBMD Z-scores were significantly lower in SSNS participants with 25(OH)D levels <15 ng/ml compared with those >15 ng/ml (−1.32 ± 0.92 versus −0.35 ± 1.35; p < 0.02); however, TrabBMD Z-scores did not differ according to 25(OH)D levels less than versus greater than 30 ng/ml. Within the controls, TrabBMD and CortBMD Z-scores were not associated with 25(OH)D levels.
None of the SSNS participants were prescribed calcium, vitamin D, or other bone protective treatments. However, 23 of the 55 SSNS participants were taking a multivitamin that contained vitamin D. The vitamin D dose administered as a multivitamin varied from 40 to 400 IU/d. Serum 25(OH)D levels were significantly greater in the 16 SSNS participants taking 400 IU/d compared with those taking <400 IU/d or no vitamin D (median vitamin D level: 27 versus 19 ng/ml, p = 0.006), independent of age.
Sixteen of the SSNS participants were taking a multivitamin or supplement that contained calcium. Of these, six were taking at least 200 mg/d, with one participant taking 500 mg and one taking 1000 mg. None of the pQCT or laboratory measures differed between the six participants taking at least 200 mg/d compared with the remaining participants. iPTH levels in the SSNS participants were not associated with prior diuretic use or current calcium or vitamin D supplementation.
Associations between GCs, disease characteristics, and pQCT and DXA outcomes
Within the SSNS participants, concurrent GC therapy at the time of the study visit was not associated with height, BMI, muscle CSA, or fat CSA Z-scores. Duration since disease diagnosis was significantly and positively associated with fat CSA Z-score (R = 0.33, p = 0.016).
Participants with SSNS that were treated with GCs at the time of the study visit had lower TrabBMD Z-scores compared with the SSNS participants not currently taking GCs (−0.87 ± 1.50 versus −0.13 ± 1.113, p = 0.06). A greater duration since disease diagnosis was associated with significantly lower TrabBMD Z-scores (R = −0.39, p = 0.003). Current or prior cyclosporine A therapy and prior diuretic therapy were not associated with TrabBMD Z-scores. WA BMD Z-scores were not associated with concurrent GC therapy but were associated with SSNS disease duration (R = −0.29, p = 0.04). PA areal BMD Z-scores were not associated with concurrent GC therapy but were negatively associated with greater SSNS disease duration (R = −0.31, p = 0.02). However, this relation did not persist when adjusted for height Z-scores, consistent with the confounding effect of skeletal size on areal BMD Z-scores.
Participants with SSNS that were treated with GCs at the time of the study visit had greater CortBMD Z-scores compared with the SSNS participants off GCs (1.38 ± 1.20 versus 0.84 ± 1.04); however, the difference was not significant (p = 0.10). CortBMD Z-scores were not associated with disease duration, independent of age, at the time of the study visit. Current GC therapy and the interval since SSNS diagnosis were not associated with any of the other cortical outcomes.
Associations between iPTH levels, bone biomarkers, and vBMD Z-scores
Multivariable regression models showed that CortBMD Z-scores were inversely and significantly associated with BSALP levels both within the healthy controls (each unit decrease in log transformed BSALP was associated with a 1.18 SD greater CortBMD Z-score, β = −1.18, 95% CI: −1.77, −0.59; p < 0.001) and within the SSNS participants (β = −3.00, 95% CI: −5.23, −0.78; p = 0.009), adjusted for sex and Tanner stage. To determine whether these relations were affected by growth, the models were further adjusted for height Z-scores. Adjustment for height Z-scores did not attenuate the significant negative associations between BSALP levels and cortical vBMD Z-scores within the controls (β = −1.17, 95% CI: −1.77, −0.58; p < 0.001) or SSNS participants (β = −2.84, 95% CI: −5.18, −0.51; p = 0.018). Similar associations were observed with DPD levels: DPD levels were inversely and significantly associated with cortical vBMD Z-scores both within the healthy controls (β = −0.16, 95% CI: −0.31, −0.02; p = 0.028) and within the SSNS participants (β = −1.18, 95% CI: −1.87, −0.49; p = 0.001), adjusted for sex and Tanner stage. When adjusted for height Z-scores, these associations persisted in the SSNS participants (β = −1.18, 95% CI: −1.84, −0.53; p < 0.001) and were marginal in the controls (β = −0.15, 95% CI: −-0.29, 0.00; p = 0.05). Bone biomarkers were not associated with TrabBMD Z-scores in SSNS or controls.
In multivariable log-transformed models adjusted for sex and Tanner stage, iPTH levels were positively correlated with BSALP (β = 0.09, 95% CI: 0.05, 0.13; p < 0.0001) and DPD (β = 0.15, 95% CI: −0.01, 0.30; p = 0.07) levels within the control subjects. These relations were not evident within the SSNS participants (BSALP: β = 0.06, 95% CI: −0.05, 0.16; p = 0.3; DPD: β = 0.02, 95% CI: −0.30, 0.34; p = 0.9).
In multivariate analyses, iPTH levels were not significantly associated with CortBMD Z-scores within the SSNS subjects or controls, adjusted for sex and Tanner stage. In contrast, iPTH levels were negatively associated with TrabBMD Z-scores in the SSNS subjects (β = −0.84; 95% CI: −1.62, −0.07; p = 0.03); this relation was not observed in the controls (β = −0.23; 95% CI: −0.51, 0.05; p = 0.10). Adjustment for iPTH levels eliminated the positive association observed between 25(OH)D levels and TrabBMD Z-scores in the SSNS participants.
DISCUSSION
This study extends the findings of previous studies(14,15,35) by evaluating the effects of GCs on pQCT estimates of cortical and trabecular vBMD, cortical structure and biomarkers of bone metabolism in children and adolescents with SSNS. These data showed significant, but divergent, alterations in trabecular and cortical vBMD. Despite the greater muscle area and BMI Z-scores in the SSNS participants compared with controls, cortical dimensions did not differ significantly, with the exception of modest elevations in cortical CSA. Finally, biomarkers of bone turnover were inversely associated with CortBMD in SSNS participants and controls and were lower in SSNS participants treated with GCs at the time of the study visit compared with controls.
Our previous DXA studies in an earlier cohort of children and adolescents with SSNS showed that the greater whole body BMC relative to height in SSNS was associated with GC-induced increases in BMI Z-scores.(14) Similarly, the greater femoral shaft dimensions in SSNS were associated with greater whole body lean mass.(15) These findings were consistent with our prior reports in otherwise healthy obese children that greater BMI and lean mass were associated with greater whole body BMC and femoral shaft dimensions.(2,36,37) However, the pQCT data presented here did not show significantly greater cortical dimensions in this cohort of SSNS participants compared with controls, with the exception of moderate increases in cortical CSA. The significantly greater CortBMC Z-scores in SSNS were predominantly caused by the significantly greater CortBMD. Although these two populations of children and adolescents with SSNS were recruited from the same nephrology clinic with comparable enrollment criteria, the elevation in mean BMI Z-scores in this more recent cohort was less pronounced (0.81 ± 1.05 versus 1.24 ± 1.00) compared with the prior cohort. The greater use of steroid-sparing therapies in recent years may have attenuated GC-induced obesity and consequent increases in bone dimensions.
The greatest alterations in bone outcomes in SSNS were observed for trabecular and cortical vBMD. pQCT measures of vBMD reflect “compartment density”: the amount of mineral divided by the volume of the trabecular or cortical compartment. The resolution of pQCT is insufficient to define individual trabeculae or cortical canals and lacunae. Rather, the trabecular compartment includes the marrow space, and the cortical compartment includes Haversian canals, canaliculi, and lacunae.(38) In the metaphysis, the trabecular compartment vBMD is a function of the bone volume fraction and the material BMD distribution (BMDD) within the individual trabeculae. In the diaphysis, the cortical compartment vBMD is a function of the volume occupied by canals, canaliculi, and lacunae, as well as the material BMDD of the compact bone. To our knowledge, no studies have examined the impact of GC on the material BMDD of cortical or trabecular bone.
As described by Dalle Carbonare et al.,(39) bone mineralization occurs in phases. After the osteoblasts replace the bone within each bone-remodeling unit, secondary mineralization progressively increases the mineral content of the bone matrix. Newer techniques, such as quantitative backscattered electron imaging, have shown that the BMDD reflects bone turnover because new bone within the bone-remodeling unit is less mineralized.(40) For example, higher bone turnover in postmenopausal osteoporosis is associated with lower BMDD, and reductions in bone turnover caused by antiresorptive therapy result in an increase in BMDD.(41) Therefore, GC-induced reductions in bone resorption and formation could extend the phase of secondary mineralization, increasing the cortical and trabecular BMDD.
Our finding of significantly lower trabecular compartment vBMD in SSNS participants is consistent with prior histomorphometric reports that GCs result in preferential trabecular bone loss with reductions in bone volume fraction, trabecular thickness, and trabecular connectivity.(3) Trabecular compartment vBMD measures cannot distinguish between alterations in bone volume fraction and BMDD. We hypothesize that the lower trabecular vBMD observed here is not caused by lower BMDD; rather it is more likely caused by reductions in bone volume fraction, perhaps because of a greater reduction in bone formation relative to the reduction in bone resorption over time. Given the greater muscle CSA Z-scores in SSNS participants, it is unlikely that decreased physical activity contributed to the trabecular vBMD deficits. The sex differences in TrabBMD observed here require further study.
The lower trabecular vBMD is largely consistent with prior QCT studies of trabecular outcomes in SSNS. Hegarty et al.(35) reported that trabecular vBMD was significantly reduced in the distal radius in 34 adults with a history of childhood SSNS. Similarly, a study of 26 children with SSNS reported lower radius trabecular vBMD.(42) A longitudinal spine QCT study in 20 children with SSNS showed that prednisone was associated with a 12% reduction in spine BMC over 1 yr.(43) In contrast, one series of 16 children with SSNS did not show significant reductions in radius trabecular vBMD, likely because of the small sample size and heterogeneous sample.(44)
This study is the first to report that GC therapy was associated with significantly greater cortical compartment vBMD. However, the few prior studies of GC effects on cortical bone were likely confounded by the effects of the underlying inflammatory disease and proresorptive cytokines. The only bone biopsy study to examine cortical bone histomorphometry in participants treated with GCs reported greater cortical porosity and greater numbers of Haversian canals, with a lower proportion of actively remodeling canals, compared with controls.(45) Cortical thickness was not affected. The authors attributed the greater cortical porosity to an early transient increase in activation frequency coupled with low bone formation, followed by a chronic phase of low bone turnover. The degree of matrix mineralization was not reported. As the investigators noted, the effects of the underlying inflammatory disease may have contributed to the observed changes in cortical porosity. Lian et al.(46) assessed cortical vBMD by QCT in the proximal femur in GC-treated osteoporotic postmenopausal women on hormone replacement therapy compared with osteoporotic postmenopausal controls. Whereas the GC-treated participants had significantly lower cortical vBMD and endocortical thinning in the femoral neck and trochanter, they had long-standing (13 yr, on average) underlying chronic inflammatory conditions, chiefly rheumatoid arthritis, systemic lupus erythematosus, or vasculitis, which likely contributed to cortical bone loss.(47)
Cortical vBMD was examined in one study of children with SSNS(42); however, the pQCT scans were obtained in the distal metaphysis and the vBMD was likely underestimated because of partial volume effects in the thin cortical shell at this site.(34) Whereas cortical vBMD was reduced in SSNS participants overall, cortical vBMD was higher in the subjects treated with high cumulative GC doses compared with those with lower doses. Of note, the study of adults with a history of childhood SSNS reported reduced trabecular vBMD but normal total bone vBMD in the distal metaphysis,(35) suggesting that greater cortical vBMD may have offset trabecular bone deficits.
Our finding of greater cortical compartment vBMD may represent greater cortical BMDD or lower cortical porosity. We hypothesize that chronic GC therapy in SSNS resulted in low bone turnover (as suggested by the bone biomarker results), effectively resulting in older bone within the bone remodeling unit, with greater secondary mineralization. This hypothesis is further supported by the significant associations between lower bone biomarkers and higher CortBMD within the SSNS participants and the healthy controls. Newly formed bone is less mineralized than mature bone. Therefore, potential adverse GC effects on bone modeling (linear growth, periosteal bone accrual, and endocortical resorption) may also contribute to the greater CortBMD Z-scores observed in the SSNS participants. However, given that cortical CSA Z-scores were greater in the SSNS participants compared with controls, it is unlikely that impairment of modeling contributed to the elevated CortBMD Z-scores observed in the participants with SSNS. It has also been reported that accelerated linear growth during growth hormone therapy is associated with declines in cortical vBMD in children.(48) Therefore, the greater CortBMD Z-scores observed in SSNS may be caused, in part, by GC-induced impairment in growth. However, adjustment for height Z-scores did not attenuate the significant inverse relations between bone biomarkers and CortBMD in SSNS participants or controls.
It is not known if the greater cortical vBMD and SSIp in SSNS results in greater bone strength, or alternatively, indicates poor quality bone with reduced strength. Whereas greater bone mineralization imparts greater stiffness to bone, too great a degree of mineralization can induce fragility through a decrease in toughness (the energy needed to cause a fracture).(49,50) Furthermore, low turnover conditions are associated with an increase in crystal size, resulting in bones that are more prone to breaking because of brittleness.(51) For optimal bone strength, there should be a wide distribution of crystal size, as seen under conditions of normal bone remodeling.(49) Animal studies have shown that denser bones are more brittle and susceptible to microdamage accumulation,(52) and a study in cadaveric human tibias confirmed these findings.(53) Similarly, composite pQCT cortical bone measurements that incorporate structure and density (e.g., SSIp) are less accurate in the prediction of radius failure load than measurements assessing structure alone.(22)
The DXA lumbar spine results in this study showed that SSNS was associated with significantly lower WA BMD Z-scores compared with controls; however, conventional areal BMD Z-scores did not differ. WA BMD includes a lateral projection that measures BMC contained with the predominantly trabecular vertebral body, excluding the cortical spinous process. Given the opposing effects of GCs on trabecular and cortical vBMD reported here, the normal PA areal BMD Z-scores may be caused by superimposed cortical and trabecular bone within the projected bone area. We recently reported similar patterns of WA BMD and PA areal BMD Z-scores in children with juvenile idiopathic arthritis.(54) We concluded that WA BMD may be more sensitive to disease and GC effects in children because it selectively measures the trabecular rich vertebral body and is independent of growth-related changes in the BMC of the dense cortical spinous processes. These conclusions are consistent with reports that WA BMD provides greater fracture discrimination than PA areal BMD or estimates of vBMD based on the PA scans alone (i.e., bone mineral apparent density [BMAD]) in adults,(24) and use of lateral scans provides a more sensitive indicator of GC-induced bone loss.(55)
Last, this study showed that SSNS was associated with greater odds of vitamin D deficiency and lower 1,25(OH)2D levels. However, the lower vitamin D levels were not associated with the expected compensatory elevation in iPTH levels compared with controls. It is possible that the lower vitamin D levels in SSNS were caused by chronic urinary losses of vitamin D binding protein with maintenance of normal free (unbound) vitamin D levels, as previously described.(56) The association between trabecular vBMD Z-scores and vitamin D levels may also reflect greater GC therapy and greater urinary losses of vitamin D binding protein in subjects with more frequent or sustained relapses, rather than a mineralization defect caused by vitamin D deficiency. Given the substantially elevated CortBMD Z-scores observed here, it is unlikely that vitamin D deficiency results in impaired mineralization in SSNS.
iPTH levels were positively correlated with bone biomarkers within controls subjects. These relations were not evident within the SSNS participants, likely because of the smaller sample size or potentially because of direct GC effects on bone remodeling and modeling. The etiology of the lower iPTH levels in the SSNS participants compared with controls is not known. Recent studies reported that proinflammatory cytokines (IL-6 and IL-1β) upregulated calcium-sensing receptor gene transcription, resulting in decreased circulating PTH and 1,25(OH)2D levels.(57,58) To our knowledge, no studies have assessed the effects of glucocorticoids on the calcium-sensing receptor.
The greatest limitations of this study are the cross-sectional design and the absence of dynamic bone histomorphometry to assess bone remodeling rates and mineralization. However, this is the first study to examine cortical vBMD in the diaphysis in children and adolescents with SSNS and the first pQCT study to use a large, robust control population to adjust for age, sex, race, bone length, and body composition. Furthermore, this is the first study to show a significant inverse relation between levels of biomarkers of bone metabolism and CortBMD Z-scores. Despite the established adverse effects of GCs on bone formation by osteoblasts, this study did not show any deficits in cortical bone cross-sectional geometry, suggesting bone modeling on the periosteal and endosteal surfaces relative to bone length was not adversely affected. The greater muscle CSA in the SSNS participants may have exerted a protective effect on bone modeling because of greater biomechanical loading. The low TrabBMD Z-scores in the SSNS participants are consistent with established GC effects. Future longitudinal studies are needed to determine the associations between concurrent GC exposure, and changes in bone histomorphometry, microarchitecture, BMDD, and fracture rates in children and adolescents.
ACKNOWLEDGMENTS
We greatly appreciate the dedication and enthusiasm of the children and their families who participated in this study. We thank Drs Bernard Kaplan, Jorge Baluarte, Kevin Meyers, and Madhura Pradhan in the Division of Nephrology and Dr Richard Reitz at Quest Diagnostics-Nichols Institute for performance of the iPTH levels and biomarkers of bone metabolism. This project was supported by Grants R01-DK060030 and K24-DK076808, as well as Grant UL1-RR-024134, from the National Center for Research Resources. The content is solely the responsibility of the authors and does not necessarily represent the official views of the National Center for Research Resources or the National Institutes of Health.
REFERENCES
- 1.van Staa TP, Cooper C, Leufkens HG, Bishop N. Children and the risk of fractures caused by oral corticosteroids. J Bone Miner Res. 2003;18:913–918. doi: 10.1359/jbmr.2003.18.5.913. [DOI] [PubMed] [Google Scholar]
- 2.Foster BJ, Shults J, Zemel BS, Leonard MB. Interactions between growth and body composition in children treated with high-dose chronic glucocorticoids. Am J Clin Nutr. 2004;80:1334–1341. doi: 10.1093/ajcn/80.5.1334. [DOI] [PubMed] [Google Scholar]
- 3.Dalle Carbonare L, Arlot ME, Chavassieux PM, Roux JP, Portero NR, Meunier PJ. Comparison of trabecular bone microarchitecture and remodeling in glucocorticoid-induced and postmenopausal osteoporosis. J Bone Miner Res. 2001;16:97–103. doi: 10.1359/jbmr.2001.16.1.97. [DOI] [PubMed] [Google Scholar]
- 4.Canalis E, Mazziotti G, Giustina A, Bilezikian JP. Glucocorticoid-induced osteoporosis: Pathophysiology and therapy. Osteoporos Int. 2007;18:1319–1328. doi: 10.1007/s00198-007-0394-0. [DOI] [PubMed] [Google Scholar]
- 5.O'Brien CA, Jia D, Plotkin LI, Bellido T, Powers CC, Stewart SA, Manolagas SC, Weinstein RS. Glucocorticoids act directly on osteoblasts and osteocytes to induce their apoptosis and reduce bone formation and strength. Endocrinology. 2004;145:1835–1841. doi: 10.1210/en.2003-0990. [DOI] [PubMed] [Google Scholar]
- 6.Kim HJ, Zhao H, Kitaura H, Bhattacharyya S, Brewer JA, Muglia LJ, Ross FP, Teitelbaum SL. Glucocorticoids suppress bone formation via the osteoclast. J Clin Invest. 2006;116:2152–2160. doi: 10.1172/JCI28084. [DOI] [PMC free article] [PubMed] [Google Scholar]
- 7.Gilbert L, He X, Farmer P, Rubin J, Drissi H, van Wijnen AJ, Lian JB, Stein GS, Nanes MS. Expression of the osteoblast differentiation factor RUNX2 (Cbfa1/AML3/Pebp2alpha A) is inhibited by tumor necrosis factor-alpha. J Biol Chem. 2002;277:2695–2701. doi: 10.1074/jbc.M106339200. [DOI] [PubMed] [Google Scholar]
- 8.Ahuja SS, Zhao S, Bellido T, Plotkin LI, Jimenez F, Bonewald LF. CD40 ligand blocks apoptosis induced by tumor necrosis factor alpha, glucocorticoids, and etoposide in osteoblasts and the osteocyte-like cell line murine long bone osteocyte-Y4. Endocrinology. 2003;144:1761–1769. doi: 10.1210/en.2002-221136. [DOI] [PubMed] [Google Scholar]
- 9.Kudo O, Fujikawa Y, Itonaga I, Sabokbar A, Torisu T, Athanasou NA. Proinflammatory cytokine (TNFalpha/IL-1alpha) induction of human osteoclast formation. J Pathol. 2002;198:220–227. doi: 10.1002/path.1190. [DOI] [PubMed] [Google Scholar]
- 10.Kwan Tat S, Padrines M, Theoleyre S, Heymann D, Fortun Y. IL-6, RANKL, TNF-alpha/IL-1: Interrelations in bone resorption pathophysiology. Cytokine Growth Factor Rev. 2004;15:49–60. doi: 10.1016/j.cytogfr.2003.10.005. [DOI] [PubMed] [Google Scholar]
- 11.Brodehl J. The treatment of minimal change nephrotic syndrome: Lessons learned from multicentre co-operative studies. Eur J Pediatr. 1991;150:380–387. doi: 10.1007/BF02093714. [DOI] [PubMed] [Google Scholar]
- 12.van Staa TP, Leufkens HG, Cooper C. The epidemiology of corticosteroid-induced osteoporosis: A meta- analysis. Osteoporos Int. 2002;13:777–787. doi: 10.1007/s001980200108. [DOI] [PubMed] [Google Scholar]
- 13.Daniel V, Trautmann Y, Konrad M, Nayir A, Scharer K. T-lymphocyte populations, cytokines and other growth factors in serum and urine of children with idiopathic nephrotic syndrome. Clin Nephrol. 1997;47:289–297. [PubMed] [Google Scholar]
- 14.Leonard MB, Feldman HI, Shults J, Zemel BS, Foster BJ, Stallings VA. Long-term, high-dose glucocorticoids and bone mineral content in childhood glucocorticoid-sensitive nephrotic syndrome. N Engl J Med. 2004;351:868–875. doi: 10.1056/NEJMoa040367. [DOI] [PubMed] [Google Scholar]
- 15.Burnham JM, Shults J, Petit MA, Semeao E, Beck TJ, Zemel BS, Leonard MB. Alterations in proximal femur geometry in children treated with glucocorticoids for Crohn disease or nephrotic syndrome: Impact of the underlying disease. J Bone Miner Res. 2007;22:551–559. doi: 10.1359/jbmr.070110. [DOI] [PubMed] [Google Scholar]
- 16.Augat P, Reeb H, Claes LE. Prediction of fracture load at different skeletal sites by geometric properties of the cortical shell. J Bone Miner Res. 1996;11:1356–1363. doi: 10.1002/jbmr.5650110921. [DOI] [PubMed] [Google Scholar]
- 17.Liu D, Manske SL, Kontulainen SA, Tang C, Guy P, Oxland TR, McKay HA. Tibial geometry is associated with failure load ex vivo: A MRI, pQCT and DXA study. Osteoporos Int. 2007;18:991–997. doi: 10.1007/s00198-007-0325-0. [DOI] [PubMed] [Google Scholar]
- 18.1981 The primary nephrotic syndrome in children. Identification of patients with minimal change nephrotic syndrome from initial response to prednisone. A report of the International Study of Kidney Disease in Children. J Pediatr 98:561–564. [DOI] [PubMed]
- 19.Schwartz GJ, Haycock GB, Edelmann CM, Jr, Spitzer A. A simple estimate of glomerular filtration rate in children derived from body length and plasma creatinine. Pediatrics. 1976;58:259–263. [PubMed] [Google Scholar]
- 20.Tanner JM. 2nd ed. Oxford, UK: Blackwell Scientific Publications; 1962. Growth at Adolescence. [Google Scholar]
- 21.Morris NM, Udry JR. Validation of a self-administered instrument to assess stage of adolescent development. J Youth Adolesc. 1980;9:271–280. doi: 10.1007/BF02088471. [DOI] [PubMed] [Google Scholar]
- 22.Ashe MC, Khan KM, Kontulainen SA, Guy P, Liu D, Beck TJ, McKay HA. Accuracy of pQCT for evaluating the aged human radius: An ashing, histomorphometry and failure load investigation. Osteoporos Int. 2006;17:1241–1251. doi: 10.1007/s00198-006-0110-5. [DOI] [PubMed] [Google Scholar]
- 23.Leonard MB, Shults J, Zemel BS. DXA estimates of vertebral volumetric bone mineral density in children: Potential advantages of paired posteroanterior and lateral scans. J Clin Densitom. 2006;9:265–273. doi: 10.1016/j.jocd.2006.05.008. [DOI] [PubMed] [Google Scholar]
- 24.Jergas M, Breitenseher M, Gluer CC, Yu W, Genant HK. Estimates of volumetric bone density from projectional measurements improve the discriminatory capability of dual X-ray absorptiometry. J Bone Miner Res. 1995;10:1101–1110. doi: 10.1002/jbmr.5650100715. [DOI] [PubMed] [Google Scholar]
- 25.Jergas M, Breitenseher M, Gluer CC, Black D, Lang P, Grampp S, Engelke K, Genant HK. Which vertebrae should be assessed using lateral dual-energy X-ray absorptiometry of the lumbar spine. Osteoporos Int. 1995;5:196–204. doi: 10.1007/BF02106100. [DOI] [PubMed] [Google Scholar]
- 26.Hollis BW. Quantitation of 25-hydroxyvitamin D and 1,25-dihydroxyvitamin D by radioimmunoassay using radioiodinated tracers. Methods Enzymol. 1997;282:174–186. doi: 10.1016/s0076-6879(97)82106-4. [DOI] [PubMed] [Google Scholar]
- 27.Ogden CL, Kuczmarski RJ, Flegal KM, Mei Z, Guo S, Wei R, Grummer-Strawn LM, Curtin LR, Roche AF, Johnson CL. Centers for Disease Control and Prevention 2000 growth charts for the United States: Improvements to the 1977 National Center for Health Statistics version. Pediatrics. 2002;109:45–60. doi: 10.1542/peds.109.1.45. [DOI] [PubMed] [Google Scholar]
- 28.Krebs NF, Jacobson MS. Prevention of pediatric overweight and obesity. Pediatrics. 2003;112:424–430. doi: 10.1542/peds.112.2.424. [DOI] [PubMed] [Google Scholar]
- 29.Cole TJ. The LMS method for constructing normalized growth standards. Eur J Clin Nutr. 1990;44:45–60. [PubMed] [Google Scholar]
- 30.Cole TJ, Green PJ. London, UK: Child Growth Foundation; 2006. LMS Chartmaker Pro. [Google Scholar]
- 31.Tuchman S, Thayu M, Shults J, Zemel BS, Burnham JM, Leonard MB. Interpretation of biomarkers of bone metabolism in children: Impact of growth velocity and body size in healthy children and chronic disease. J Pediatr. 2008;153:484–490. doi: 10.1016/j.jpeds.2008.04.028. [DOI] [PMC free article] [PubMed] [Google Scholar]
- 32.Weng FL, Shults J, Leonard MB, Stallings VA, Zemel BS. Risk factors for low serum 25-hydroxyvitamin D concentrations in otherwise healthy children and adolescents. Am J Clin Nutr. 2007;86:150–158. doi: 10.1093/ajcn/86.1.150. [DOI] [PubMed] [Google Scholar]
- 33.Clark A, Barratt TM. Steroid-responsive nephrotic syndrome. In: Barratt TM, Avner ED, Harmon WE, editors. Pediatric Nephrology. 4th ed. Baltimore, MD, USA: Lipppincott, Williams & Wilkins; 1999. pp. 731–748. [Google Scholar]
- 34.Binkley TL, Specker BL. pQCT measurement of bone parameters in young children: Validation of technique. J Clin Densitom. 2000;3:9–14. doi: 10.1385/jcd:3:1:009. [DOI] [PubMed] [Google Scholar]
- 35.Hegarty J, Mughal MZ, Adams J, Webb NJ. Reduced bone mineral density in adults treated with high-dose corticosteroids for childhood nephrotic syndrome. Kidney Int. 2005;68:2304–2309. doi: 10.1111/j.1523-1755.2005.00690.x. [DOI] [PubMed] [Google Scholar]
- 36.Petit MA, Beck TJ, Lin HM, Bentley C, Legro RS, Lloyd T. Femoral bone structural geometry adapts to mechanical loading and is influenced by sex steroids: The Penn State Young Women's Health Study. Bone. 2004;35:750–759. doi: 10.1016/j.bone.2004.05.008. [DOI] [PubMed] [Google Scholar]
- 37.Leonard MB, Shults J, Wilson BA, Tershakovec AM, Zemel BS. Obesity during childhood and adolescence augments bone mass and bone dimensions. Am J Clin Nutr. 2004;80:514–523. doi: 10.1093/ajcn/80.2.514. [DOI] [PubMed] [Google Scholar]
- 38.Rauch F, Schoenau E. Changes in bone density during childhood and adolescence: An approach based on bone's biological organization. J Bone Miner Res. 2001;16:597–604. doi: 10.1359/jbmr.2001.16.4.597. [DOI] [PubMed] [Google Scholar]
- 39.Dalle Carbonare L, Bertoldo F, Valenti MT, Zenari S, Zanatta M, Sella S, Giannini S, Cascio VL. Histomorphometric analysis of glucocorticoid-induced osteoporosis. Micron. 2005;36:645–652. doi: 10.1016/j.micron.2005.07.009. [DOI] [PubMed] [Google Scholar]
- 40.Roschger P, Paschalis EP, Fratzl P, Klaushofer K. Bone mineralization density distribution in health and disease. Bone. 2008;42:456–466. doi: 10.1016/j.bone.2007.10.021. [DOI] [PubMed] [Google Scholar]
- 41.Roschger P, Rinnerthaler S, Yates J, Rodan GA, Fratzl P, Klaushofer K. Alendronate increases degree and uniformity of mineralization in cancellous bone and decreases the porosity in cortical bone of osteoporotic women. Bone. 2001;29:185–191. doi: 10.1016/s8756-3282(01)00485-9. [DOI] [PubMed] [Google Scholar]
- 42.Lettgen B, Jeken C, Reiners C. Influence of steroid medication on bone mineral density in children with nephrotic syndrome. Pediatr Nephrol. 1994;8:667–670. doi: 10.1007/BF00869084. [DOI] [PubMed] [Google Scholar]
- 43.Broyer M, Terzi F, Lehnert A, Gagnadoux MF, Guest G, Niaudet P. A controlled study of deflazacort in the treatment of idiopathic nephrotic syndrome. Pediatr Nephrol. 1997;11:418–422. doi: 10.1007/s004670050308. [DOI] [PubMed] [Google Scholar]
- 44.Tenbrock K, Kruppa S, Mokov E, Querfeld U, Michalk D, Schoenau E. Analysis of muscle strength and bone structure in children with renal disease. Pediatr Nephrol. 2000;14:669–672. doi: 10.1007/s004670000360. [DOI] [PubMed] [Google Scholar]
- 45.Vedi S, Elkin SL, Compston JE. A histomorphometric study of cortical bone of the iliac crest in patients treated with glucocorticoids. Calcif Tissue Int. 2005;77:79–83. doi: 10.1007/s00223-004-0205-y. [DOI] [PubMed] [Google Scholar]
- 46.Lian KC, Lang TF, Keyak JH, Modin GW, Rehman Q, Do L, Lane NE. Differences in hip quantitative computed tomography (QCT) measurements of bone mineral density and bone strength between glucocorticoid-treated and glucocorticoid-naive postmenopausal women. Osteoporos Int. 2005;16:642–650. doi: 10.1007/s00198-004-1736-9. [DOI] [PubMed] [Google Scholar]
- 47.Lane NE, Sanchez S, Modin GW, Genant HK, Pierini E, Arnaud CD. Parathyroid hormone treatment can reverse corticosteroid-induced osteoporosis. Results of a randomized controlled clinical trial. J Clin Invest. 1998;102:1627–1633. doi: 10.1172/JCI3914. [DOI] [PMC free article] [PubMed] [Google Scholar]
- 48.Schweizer R, Martin DD, Schwarze CP, Binder G, Georgiadou A, Ihle J, Ranke MB. Cortical bone density is normal in prepubertal children with growth hormone (GH) deficiency, but initially decreases during GH replacement due to early bone remodeling. J Clin Endocrinol Metab. 2003;88:5266–5272. doi: 10.1210/jc.2003-030432. [DOI] [PubMed] [Google Scholar]
- 49.Davison KS, Siminoski K, Adachi JD, Hanley DA, Goltzman D, Hodsman AB, Josse R, Kaiser S, Olszynski WP, Papaioannou A, Ste-Marie LG, Kendler DL, Tenenhouse A, Brown JP. Bone strength: The whole is greater than the sum of its parts. Semin Arthritis Rheum. 2006;36:22–31. doi: 10.1016/j.semarthrit.2006.04.002. [DOI] [PubMed] [Google Scholar]
- 50.Currey JD, Brear K, Zioupos P. The effects of ageing and changes in mineral content in degrading the toughness of human femora. J Biomech. 1996;29:257–260. doi: 10.1016/0021-9290(95)00048-8. [DOI] [PubMed] [Google Scholar]
- 51.Boskey AL, DiCarlo E, Paschalis E, West P, Mendelsohn R. Comparison of mineral quality and quantity in iliac crest biopsies from high- and low-turnover osteoporosis: An FT-IR microspectroscopic investigation. Osteoporos Int. 2005;16:2031–2038. doi: 10.1007/s00198-005-1992-3. [DOI] [PMC free article] [PubMed] [Google Scholar]
- 52.Jepsen KJ, Pennington DE, Lee YL, Warman M, Nadeau J. Bone brittleness varies with genetic background in A/J and C57BL/6J inbred mice. J Bone Miner Res. 2001;16:1854–1862. doi: 10.1359/jbmr.2001.16.10.1854. [DOI] [PubMed] [Google Scholar]
- 53.Tommasini SM, Nasser P, Schaffler MB, Jepsen KJ. Relationship between bone morphology and bone quality in male tibias: Implications for stress fracture risk. J Bone Miner Res. 2005;20:1372–1380. doi: 10.1359/JBMR.050326. [DOI] [PubMed] [Google Scholar]
- 54.Dubner SE, Shults J, Leonard MB, Zemel BS, Sembhi H, Burnham JM. Assessment of spine bone mineral density in juvenile idiopathic arthritis: Impact of scan projection. J Clin Densitom. 2008;11:302–308. doi: 10.1016/j.jocd.2007.10.005. [DOI] [PubMed] [Google Scholar]
- 55.Reid IR, Evans MC, Stapleton J. Lateral spine densitometry is a more sensitive indicator of glucocorticoid-induced bone loss. J Bone Miner Res. 1992;7:1221–1225. doi: 10.1002/jbmr.5650071014. [DOI] [PubMed] [Google Scholar]
- 56.Grymonprez A, Proesmans W, Van Dyck M, Jans I, Goos G, Bouillon R. Vitamin D metabolites in childhood nephrotic syndrome. Pediatr Nephrol. 1995;9:278–281. doi: 10.1007/BF02254183. [DOI] [PubMed] [Google Scholar]
- 57.Canaff L, Zhou X, Hendy GN. The proinflammatory cytokine, interleukin-6, up-regulates calcium-sensing receptor gene transcription via Stat1/3 and Sp1/3. J Biol Chem. 2008;283:13586–13600. doi: 10.1074/jbc.M708087200. [DOI] [PubMed] [Google Scholar]
- 58.Canaff L, Hendy GN. Calcium-sensing receptor gene transcription is up-regulated by the proinflammatory cytokine, interleukin-1beta. Role of the NF-kappaB PATHWAY and kappaB elements. J Biol Chem. 2005;280:14177–14188. doi: 10.1074/jbc.M408587200. [DOI] [PubMed] [Google Scholar]