

Abstract
Wnts comprise a family of secreted growth factors that regulate the development and maintenance of many organs. Recently, Wnt10b was shown to stimulate osteoblastogenesis and bone formation in mice. To evaluate further the role of Wnt10b in bone health in humans, we performed bidirectional sequencing of ∼8 kb of the WNT10B gene region in 192 individuals (96 African, 96 white) to identify single nucleotide polymorphisms (SNPs). We identified 19 SNPs with minor allele frequency (MAF) ≥0.01. Ten of these SNPs were not present in the NCBI dbSNP database (build 127), whereas 10 of the 20 SNPs (50%) reported in dbSNP were not verified. We initially genotyped seven tagging SNPs that captured common (MAF ≥ 0.05) variation in the region with r 2 > 0.80 and a potentially functional SNP in exon 5 in 1035 Afro-Caribbean men ≥40 yr of age. Association analysis showed three SNPs in a 3′ region of linkage disequilibrium that were associated with DXA measures of hip BMD. Associations between two of these three SNPs (rs1051886, rs3741627) with hip BMD were replicated in an additional 980 Afro-Caribbean men (p < 0.05), in the combined sample of 2015 men (p ≤ 0.006), and in 416 individuals ≥18 yr of age (mean, 44 yr) belonging to eight extended, multigenerational Afro-Caribbean families with mean family size >50 (3535 relative pairs; p < 0.05). Further analysis showed that rs1051886 and rs3741627 were associated with cortical cross-sectional area, periosteal circumference, and BMC in the radius, such that individuals with the minor alleles had lower biomechanical indices of long-bone bending strength. This analysis implicates the WNT10B locus as a genetic element in the regulation of bone mass and structural geometry.
Key words: Wnt10b, genetics, polymorphism, BMD, osteoporosis
INTRODUCTION
Genetic susceptibility plays a predominant but poorly understood role in the etiology of osteoporosis and its associated fractures.(1) A genetic component to osteoporosis is supported by the strong heritability (60–80%) of BMD(1) and the increased risk of osteoporotic fractures among first-degree relatives with a positive family history of fracture.(2,3) Although there is compelling evidence that susceptibility to low BMD and osteoporosis is largely governed by genetic factors, the inherited factors involved remain largely unknown. Identifying the genetic factors underlying normal variation in BMD may provide important insight on bone biology and osteoporosis risk.
The most compelling evidence of a specific gene influencing BMD comes from a report of a large family in which high BMD (Z-score > 5) segregated as an autosomal dominant trait linked to chromosome 11q12–13.(4) Subsequent studies showed that the high BMD trait is caused by a gain-of-function mutation (G171V) in the low-density lipoprotein receptor-related protein 5 (LRP5),(5,6) a cell surface receptor that mediates signaling by the Wnt growth factor family.(6,7) Transgenic mice expressing the human LRP5 gene with the gain-of-function mutation recapitulate the phenotype of increased BMD caused by increased osteoblast number and activity.(8) Normal variation in BMD in the general population has also been linked to the same genomic region containing LRP5, (9) and single nucleotide polymorphisms (SNPs) in LRP5 have been associated with BMD in ethnically diverse samples of unrelated individuals,(10–13) including a large meta-analysis(14) and a genome-wide association screen.(15) More recent studies have shown that the Wnt family member, Wnt10b, stimulates osteoblastogenesis in vitro and increases BMD in mice.(16) These studies implicate the Wnt signaling pathway as having an important role in bone biology.
To investigate further the role of Wnt10b in bone health in humans, we resequenced ∼8 kb of the WNT10B gene region to identify SNPs and genotyped tag SNPs across the region and conducted genetic association analyses of these SNPs and BMD in a population- and family-based study of Afro-Caribbeans recruited from the same geographic region. We report a novel and reproducible association between SNPs in the 3′ region of the WNT10B gene and BMD among a total of 2431 individuals of African ancestry.
MATERIALS AND METHODS
Resequencing samples
White American DNA samples for resequencing the WNT10B gene were randomly selected from among 523 men ≥50 yr of age who were enrolled in a study of BMD in Pittsburgh, PA.(17) Participants were recruited by population-based mailings to age-eligible men. We selected DNA samples from a random sample of 96 men regardless of their BMD or health status. Written informed consent was obtained from all participants, and the protocol was approved by University of Pittsburgh Institutional Review Board.
Afro-Caribbean DNA samples for resequencing WNT10B were randomly selected from a larger study of BMD among 2501 men ≥40 yr of age on the island of Tobago.(18) Men were recruited by word of mouth, through health care workers at the hospital, health centers, or private physicians, and local advertising by poster, flyers, and public service announcements. The Tobago population is predominantly of West African origin (97% of the island according to the most recent census data) with low non-African admixture. Previous studies using ancestry informative genetic markers have confirmed a low admixture (6% non-African) in this population in contrast to the black American population.(19) Written informed consent was obtained using forms approved by the Institutional Review Boards of the University of Pittsburgh and the Tobago Ministry of Health.
Population sample
We genotyped SNPs identified in the resequencing study in a larger subset of Afro-Caribbean men from the Tobago population study who had BMD measures (N = 1035). An additional 980 men from this same study population were subsequently selected to validate associations from the initial genotyping sample.
Family study sample
We attempted to replicate the most promising SNP associations for WNT10B in our population-based analysis using DNA samples and phenotypic data collected from individuals belonging to eight multigenerational families of African ancestry.(20) Potential probands for the family study were identified from the Tobago population without regard to medical history or BMD. To be eligible, a proband must have been Afro-Caribbean, have a spouse who was willing to participate in the study, and have at least six living offspring and/or siblings ≥18 yr of age residing on the island of Tobago. In addition, all first-, second- and third-degree relatives of these probands and their spouses were invited to participate regardless of their medical history or BMD. There were 471 individuals (60% women) 18–103 yr of age (mean, 43 yr) in eight multigenerational families with a mean family size of >50 individuals. The following relationships exist in these pedigrees: 361 parent-offspring, 495 full siblings, 101 grandparent-grandchildren, 1137 avuncular, 61 half sibs, and 1380 cousins (3535 relative pairs). Genotyping for this analysis was completed in 416 family members. Written informed consent was obtained using forms approved by the Institutional Review Boards of the University of Pittsburgh and the Tobago Ministry of Health.
DXA
BMD was measured at the proximal femur and subregions using a single Hologic QDR 4500W densitometer (Hologic, Bedford, MA, USA). The left hip was scanned unless the participant had a fracture or a total hip replacement. Trained and certified technicians performed the DXA scans and followed a strict protocol for patient positioning and analysis. Longitudinal machine stability was assessed from plots of daily spine phantom scans. The scanner was stable throughout the course of the study.
pQCT
Single axial tomographic slices of the nondominant forearm and left tibia were scanned using a Stratec XCT 2000 scanner (Stratec Medizintechnik, Pforzheim, Germany) according to standardized measurement and analysis procedures. Each scan was acquired with a 0.5-mm voxel size, slice thickness of 2.5 mm, and at a speed of 20 mm/s. The precise position of the measurement sites were determined in a 30-mm planar scout view using the medial endplate of the radius as standard anatomic landmarks and automatically set by the software at 4% or 33% of the length of the radius proximal to the distal endplate. These anatomical sites were chosen to assess primarily trabecular and cortical bone, respectively. Forearm length was measured from the olecranon to the ulna styloid process. Image processing was performed using the Stratec software package (Version 5.5E). A phantom was scanned daily to maintain quality assurance.
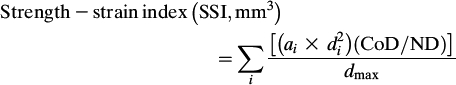
All 4% distal radius scans were analyzed using identical parameters for contour finding and separation of trabecular and cortical bone (contour mode 2, T = 169 mg/cm3; peel mode 1, area = 45%) to determine the volumetric BMD of the trabecular (mg/cm3) bone compartment. All 33% proximal radius shaft scans were analyzed using identical parameters for contour finding and separation of total and cortical bone (contour mode 2, T = 169 mg/cm3; cortmode 1, T = 710 mg/cm3) to determine the volumetric BMD of the cortical bone compartment not including the bone marrow (mg/cm3). In addition, measures of cortical BMC (mg/mm), cortical cross-sectional area (CSA, mm2), and endosteal and periosteal circumference (EC and PC) were obtained at the diaphysis (at 33% of the bone length in the proximal direction of the distal end of the bone) of the radius using the circular ring model. The material properties of bone, such as the elastic modulus or ultimate load, cannot be deduced directly from QCT measurements. However, these parameters show a close relationship with the mineral density of the cortex. To take the material properties of bone into consideration for assessing the structural properties, the strength strain index (SSI, mm3) was also calculated (Eq. 1) as the integrated product of the section modulus and cortical density (CoD). Section modulus (mm3) was first calculated as (a × d 2)/d max, where a is the cross-sectional area of a voxel (mm2), d is the distance of the voxel from the center of gravity (mm), and d max is the maximum distance (eccentricity) of one voxel to the center of gravity (mm). The ratio of CoD and ND (normal physiological density, 1200 mg/mm3) provides an estimate of the modulus of elasticity.(21)
 |
Resequencing and variation discovery
The WNT10B gene region was bidirectionally sequenced using DNA samples from 96 unselected individuals of African ancestry and 96 unselected individuals of white ancestry (384 chromosomes). DNA sequencing was performed by Polymorphic DNA Technologies(Alameda, CA, USA). Briefly, DNA was amplified in a nested reaction where the first round of PCR amplifies a large booster fragment that is used as the template for the nested amplification of a smaller target fragment. The target fragment was sequenced using ABI Big Dye Terminator 3.1 chemistry following the manufacturer's recommended protocol. Sequencing products were analyzed using the ABI 3730 XL DNA Analyzer (Applied Biosystems, Foster City, CA, USA). We sequenced 7798 bp of the WNT10B gene including 2033 bp of the 5′ promoter region, all five exons, all introns excluding a 933-bp segment of intron 3, the 5′ and 3′ UTRs, and 278 bp downstream of the gene. Variant detection was performed using Sequencher 4.5 sequence analysis software (Genecodes, Ann Arbor, MI, USA). SNP numbering is based on the translational start site. Our resequencing screen of 384 chromosomes is predicted to detect 99% of variable sites with a minor allele frequency (MAF) >1% and >99.9% of sites with a minor allele frequency >5%.(22) Thus, our resequencing study was sufficiently powered to detect the majority of common variation within WNT10B.
Selection of SNPs for association analysis
We used the resequencing genotype data in the Afro-Caribbean samples to determine the patterns of linkage disequilibrium (LD) among common SNPs in WNT10B and to select tag SNPs using the program HClust.(23) HClust uses hierarchical clustering based on LD to partition SNPs into “clusters.” The SNP that is most correlated with the other SNPs within each cluster is selected as a proxy or “tag” SNP. We considered only SNPs with an MAF ≥5% and required that the subset of tag SNPs predict the remaining SNPs with an r 2 ≥ 0.8. Two SNPs failed manufacturing (G→T at position −1297; A→G at position 1487) and one SNP (rs833843) was out of Hardy-Weinberg equilibrium (p < 0.01). Our final design used seven tagSNPs to capture the common SNPs in WNT10B at a mean r 2 of 0.99.
In addition to the seven tagSNPs, we also genotyped a synonymous SNP in exon 5 (rs1051886) that was predicted by the function analysis and selection tool for SNPs (FASTSNP; http://fastsnp.ibms.sinica.edu.tw/) to alter an exon splicing enhancer motif.(24) Two additional SNPs in the 3′ flanking region of WNT10B were subsequently identified from the International HapMap database (www.hapmap.org) and genotyped to clarify the extent of LD in the 3′ region of WNT10B: rs10875902 at chromosome position 47,641,559 in the intergenic region ∼4 kb away from rs1051886 and rs903570 at chromosome position 47,554,786 ∼90 kb away from rs1051886.
Genotyping
Genotyping was completed using genomic DNA prepared from blood clots or whole blood. All SNPs were genotyped using the fluorogenic 5′-nuclease TaqMan allelic discrimination assay system (Applied Biosystems, Foster City, CA, USA). The assays were performed under standard conditions on a 7900HT real-time PCR instrument with probes and reagents purchased from Applied Biosystems. All genotype calls were determined by two independent investigators, and only concordant calls were used. Our genotyping consensus rate based on 1207 blind replicate genotypes was 99.2%. The average completeness of genotyping for working markers was 94.9%.
Statistical analysis
We calculated site-specific allele frequencies by gene counting and tested for departures from Hardy-Weinberg equilibrium using a goodness of fit statistic. Pairwise estimates of LD were measured as D′ and r 2 from the diploid data.(25)
In the population study, single SNPs were tested for their association with bone parameters assuming three genetic models and the best fitting model is presented. Linear regression was used to test for association between the number of rare alleles and the bone parameters. Analysis of covariance was used to assess the dominant and recessive models. All models were adjusted for age, and the age-adjusted, genotype-specific means and SEs are presented. Analyses were performed using SAS version 9.1 (SAS Institute, Cary, NC, USA).
To conduct the haplotype analysis, we first examined the LD structure across the gene region using Entropy Blocker, which parses the region of interest into haplotype blocks based on LD patterns (http://wpicr.wpic.pitt.edu/WPICCompGen/blocks.htm).(23) Using a sliding window size of five SNPs, we identified two distinct haplotype blocks. One block spans the upstream region and 5′ UTR of WNT10B, and the second block encompasses a region starting in intron 3 and spanning downstream of the gene (Fig. 1).
FIG. 1.

Physical map of the human WNT10B gene, position of SNPs genotyped, and blocks of LD. The position of SNPs on chromosome 12 that were genotyped in this study was obtained from NCBI map Build 36. LD blocks were determined by Entropy Blocker.(23) Block 2 was extended by genotyping an additional marker not shown in the figure (rs903570; see text for details).
Haplotype analysis was completed separately for each LD block. We used PHASE (version 2.1.1)(26) to infer haplotypes from the unphased SNPs and coded the resulting haplotype variables according to the number of copies present for each participant. To accommodate uncertainty in haplotype estimation, participants were assigned multiple haplotype combinations along with a probability, and only individuals with ≥70% probability of haplotype assignment were included in the analysis. Haplotypes present in <5% of participants were also excluded from the analysis. Haplotype associations with bone parameters were completed in the same manner as single SNP analyses using an additive, recessive, or dominant model and adjusting for age.
We performed association analyses in the pedigree-based data using the measured genotype approach within the variance components analytical framework implemented in program Sequential Oligogenic Linkage Analysis Routines (SOLAR).(27) The variance components-based approach accounts for the nonindependence among family members. The association of selected WNT10B genotypes from haplotype block 2 with BMD was assessed after incorporating age, sex, weight, and height as covariates. Briefly, the effects of WNT10B genotypes were assessed by comparing the likelihood of a model in which the effects of genotypic effects were constrained to zero.
RESULTS
SNPs identified in WNT10B by resequencing
SNPs in the human WNT10B gene region were identified by bidirectional sequencing of ∼8 kb of the gene in 192 individuals: 96 Africans and 96 white Americans. We identified 16 SNPs in the African and 12 SNPs in the white samples for a total of 19 unique SNPs with MAF ≥0.01 (Table 1). Of these 19 SNPs, 7 were found only in the African samples, 3 were found only in whites, and 9 were present in both populations. Despite having sufficient statistical power to identify variants with minor allele frequency >1%, we did not observe any missense or obvious splice site variants in either population sample. However, two synonymous coding variants were identified: rs1051886 in exon 5 was detected in both populations, and a G (Glu)→A (Glu) substitution at position 2332 was found only in whites.
Table 1.
SNPs Identified by Resequencing the Human WNT10B Gene

Previous studies have indicated that a substantial fraction of SNPs in the NCBI dbSNP database cannot be detected in other samples, suggesting that these reported genetic variants may be either very rare or artifacts.(28) We examined this issue for WNT10B by mapping the SNPs identified here by resequencing to those found in dbSNP build 127. Approximately one half (53%) of the 19 SNPs (7 in Africans; 3 in whites) were not present in dbSNP build 127, whereas 10 of the 20 SNPs reported in dbSNP (50%) were not confirmed by our analysis.
LD structure at the WNT10B locus
We assessed the pairwise LD between SNPs in the WNT10B gene region and used Entropy Blocker(23) to define regions with substantial multilocus LD and limited haplotype diversity (Table 2). Two blocks of LD were evident in the WNT10B gene region, labeled block 1 and block 2 (Fig. 1). Within these blocks, a small number of common haplotypes were observed. Four haplotypes in block 1 (a 1.5-kb genomic segment) accounted for 99.3% of the chromosomes. Likewise, four haplotypes in block 2 (7.5-kb genomic segment) represented 97.5% of the chromosomes.
Table 2.
Pairwise LD Between SNPs in the WNT10B Gene Region in Afro-Caribbeans

Association of single allelic variants and BMD in the population-based sample
We initially genotyped 1035 Afro-Caribbean men for seven tagSNPs and a potentially functional SNP in exon 5 of WNT10B. Their mean age and BMI were 62 yr and 27.4 kg/m2, respectively (Table 3). None of the tagSNPs analyzed in haplotype block 1 were significantly associated with hip BMD (Table 4). One tagSNP (rs833834) and a potentially functional SNP (rs1051886) in haplotype block 2 were associated with hip BMD (p < 0.05 for both). A second tagSNP (rs3741627) in block 2 that was in high LD with rs1051886 (r 2 = 0.95, D′ = 0.49) was also marginally associated with hip BMD (p = 0.06). The magnitude of the effect on BMD for each of these SNPs was modest. For example, men who were homozygous for the minor allele of rs1051886 had 0.03 g/cm2 or ∼0.25 SDs lower BMD than those who were homozygous for the major allele. Two additional SNPs (rs10875902, rs903570) were subsequently identified and genotyped in the 3′ flanking region of WNT10B to extend LD block 2. Neither of these 3′ flanking SNPs was significantly associated with hip BMD.
Table 3.
Characteristics of the Afro-Caribbean Study Populations
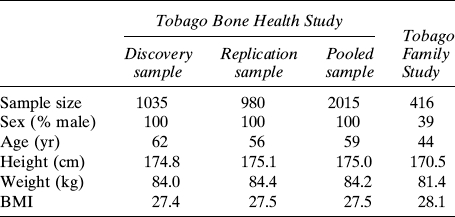
Table 4.
Association of Individual WNT10B SNPs and Hip BMD (g/cm2) in 1035 Afro-Caribbean Men (Discovery Sample)

Associations of WNT10B haplotypes with BMD in the population-based sample
We inferred haplotype frequencies in the population-based sample using four SNPs in block 1 and five SNPs in block 2. Consistent with single marker association analyses of block 1 SNPs, we found no significant differences in hip BMD for any of the four common haplotypes in block 1 (data not shown). Consistent with the single marker association analyses of block 2 SNPs, we found significant haplotype associations with hip BMD. Men with two copies of haplotype 2C, which contained the minor alleles at rs1051886 and rs3741627, had 0.05 g/cm2 or ∼0.3 SDs lower total hip BMD compared with men without this haplotype (p < 0.05). None of the other common haplotypes were significantly associated with hip BMD (p > 0.05).
Replication of block 2 SNPs
We attempted to replicate the single SNP associations with hip BMD by genotyping an additional 980 men from the population-based cohort for rs833834, rs1051886, and rs3741627. These men were slightly younger but had similar BMI as the initial replication sample (Table 3). Both rs1051886 and rs3741627 were significantly associated with hip BMD in the replication sample (p = 0.04; Table 5). Moreover, rs1051886 and rs3741627 were significantly associated with hip BMD in the pooled sample of 2015 men from the initial discovery and the replication samples (p = 0.003 and p = 0.006, respectively). rs833834 was not significantly associated with hip BMD in the replication sample or in the combined sample.
Table 5.
Replication and Pooled Analysis of LD Block 2 SNPs and Total Hip BMD (g/cm2) in Afro-Caribbean Men

Measured genotype analysis in multigenerational families
We genotyped rs1051886 and rs3741627 in an independent sample of 416 individuals belonging to eight multigenerational families of Afro-Caribbean ancestry from the same geographic region as the population study (>3500 relative pairs). Their mean age was 44 yr, and BMI was 28.1 kg/m2 (Table 3). Consistent with the population-based analyses, both SNPs were significantly associated with hip BMD (Table 6). For example, individuals who were homozygous for minor allele of rs1051886 had ∼0.07 g/cm2 (∼0.5 SD) lower BMD than individuals who were homozygous for the major allele. The magnitude of effect and direction of association with hip BMD was similar for rs3741627.
Table 6.
Association of WNT10B SNPs and Hip BMD (g/cm2) in 416 Members of Eight Multigenerational Afro-Caribbean Families

Association analysis of pQCT phenotypes
We attempted to refine the observed phenotypic associations with rs1051886 and rs3741627 by analyzing cortical and trabecular volumetric BMD and bone structure at the radius measured with pQCT in Afro-Caribbean men from the population-based study (Table 7). Men with two copies of the minor allele at rs1051886 had significantly reduced cortical BMC and periosteal circumference compared with those with the major homozygous genotype (p = 0.006 and p = 0.003, respectively). The net effect of these phenotypic differences was evident in the strength-strain index (p = 0.003), a biomechanical indicator of long bone resistance to bending.(29) Similar phenotypic associations were observed for rs3741627. In contrast, trabecular volumetric BMD was not associated with either rs1051886 or rs3741627.
Table 7.
Association Analysis of LD Block 2 SNPs in WNT10B and Cortical and Trabecular Volumetric BMD and Bone Structure in Afro-Caribbean Men

DISCUSSION
Wnts comprise a large family of secreted proteins that have recently been implicated in bone development and remodeling in mice.(30) In this study, we performed deep resequencing of the human gene encoding the Wnt family member, WNT10B, and identified 19 SNPs with MAF ≥0.01. Ten of these SNPs were novel (i.e., not reported in NCBI dbSNP version 127). We performed genetic association analyses of tagging SNPs and a potentially functional SNP in WNT10B and measures of bone health in a large population-based cohort of men and a sample of large, multigenerational families, both of African ancestry. These analyses showed a novel and reproducible association between two SNPs in WNT10B and hip BMD. Minor alleles for a SNP in the 3′ untranslated region (rs1051886) and exon 5 (rs3741627) of WNT10B were significantly associated with lower hip BMD in both the population- and family-based samples. For example, men who were homozygous for the minor allele of rs1051886 had 0.03 g/cm2 or ∼0.25 SDs lower BMD than those who were homozygous for the major allele. The magnitude of this association is modest but comparable to the effect of common genetic variation in the LRP5 gene on BMD.(14) Moreover, multimarker haplotype analyses of an extended LD block that included rs1051886 and rs3741627 identified a single common haplotype that was significantly associated with hip BMD. Further analyses of these 3′ SNPs showed a significant association with cortical bone mass and with SSI, a biomechanical indicator of long bone bending strength. Our results suggest that WNT10B may be a novel genetic element in the regulation of bone mass and structure in humans.
Transgenic mice expressing Wnt10b have increased trabecular bone mass, which is evident throughout the endocortical compartment of the femur and results in increased bending strength.(16) Morphometric properties of the distal femur, including trabecular number and thickness, are also increased in these animals.(16) Cross-sectional area, thickness, and bending moments are increased at the midcortical region of the femur.(16) The effects of Wnt10b on bone mass in transgenic mice are also evident at the tibia, hip, humerus, and vertebrae.(16) We were unable to show an association between WNT10B genotype and trabecular bone mass in this study. Rather, WNT10B genotype was associated with the cross-sectional area and mineral content of the cortical bone compartment at the radius. The net effect of these differences was apparent in SSI, an indicator of long bone resistance to bending.(29) SSI is more strongly correlated with the experimentally determined breaking force of bone than measures of areal BMD, cross-sectional moment of inertia, or cortical volumetric BMD alone.(29) It is possible that the WNT10B genotype has differential effects on bone in mice and humans. The finding that WNT10B genetic variations may have differential effects on cortical and trabecular bone is consistent with findings in humans(31) and mice(32) and underscores the importance of assessing these bone compartments with QCT in genetic association studies.
The physiological and cellular mechanisms by which Wnt signaling influences bone are beginning to emerge from experimental models. Wnt signaling may direct mesenchymal precursor cell fate toward the osteoblast lineage by suppressing the expression of adipogenic transcription factors peroxisome proliferator-activated receptor γ (PPAR-γ) and CCAT/enhancer binding protein (C/EBP-α) and by increasing the expression of osteoblastogenic transcription factors Runx-2, Dlx-5, and osterix.(33) Indeed, activation of Wnt signaling by Wnt10b inhibits adipogenesis,(34–36) and rare missense mutations in WNT10B have been associated with obesity.(37) In transgenic mice, Wnt10b increases bone mass by stimulating osteoblastogenesis and bone formation.(16,38) The increase in bone formation is caused by increases in the number of osteoblasts per bone surface area, the rate of bone mineral apposition, and the percent mineralizing surface.(38) There is also accumulating evidence that the Wnt signaling pathway is needed for bone formation in response to mechanical loading. For instance, Lrp5 G171V transgenic mice have enhanced sensitivity to mechanical loading,(39) whereas Lrp5 knockout mice fail to generate an osteogenic response to mechanical loading.(40) Moreover, mechanical loading increases the expression of several Wnt signaling pathway components in osteoblasts, including Wnt10b.(41) Polymorphisms in the human WNT10B gene might increase the expression and/or activity of WNT10B in osteoblasts and/or produce a longer and more sustained activation of Wnt signaling in response to mechanical loading.
The functional significance of the synonymous SNP in exon 5 (rs1051886) is unknown. The C allele is inferred to be ancestral on the basis of the chimpanzee sequence and was present in 0.85 of African and 0.64 of white samples in this study. An eight-way vertebrate sequence alignment analysis showed that the C allele is highly conserved (Fig. 2A). The less common T allele is predicted by FASTSNP (http://fastsnp.ibms.sinica.edu.tw/)(24) to abolish an exon splicing enhancer (ESE) motif for the human serine/arginine-rich protein splicing factor 2/alternative splicing factor (SF2/ASF), which has a role in splicing, stability, export, and translation of mRNA. Correct pre-mRNA splicing not only requires splice-site sequences to be present at the exon–intron borders but is also critically dependent on additional intronic and exonic regulatory sequences. Exonic splicing enhancers bind splicing factors, such as SF2/ASF, to affect recognition of nearby splice sites. Exon splice enhancers also seem to be important in exons that normally undergo alternative splicing. Genetic variants that inactivate ESE sequences in WNT10B might contribute to phenotypic variability in bone mass by influencing splicing accuracy or efficiency.(44)
FIG. 2.

In silico analysis of rs1051886 and predicted RNA secondary structures. (A) Sequence comparisons between designated species. Sequence comparisons were obtained using the UCSC comparative genomics browser (http://genome.ucsc.edu). The location of rs1051886 is shown in blue. (B) Predicted RNA secondary structure shown in dot-parenthesis notation from the EvoFold program within the UCSC Genome browser.(42) A dot in the string indicates that the corresponding nucleotide is unpaired. Base-pairing positions are annotated with the same pair symbol. If nucleotides i and j are paired, where i < j, a left parenthesis “(“ at position i and a right parenthesis ”)” at position j are shown instead of a dot. (C) RNA secondary structure predictions for the two alleles of rs1051886 were made with the Vienna RNA Folding program (www.tbi.univie.ac.at/).(43) Arrows indicate the positions of the two alleles for rs1051886.
We also used the EvoFold program within the University of California Santa Cruz (UCSC) Genome Browser (http://genome.ucsc.edu/) to construct RNA secondary structure predictions for the exonic sequence containing rs1051886 (Fig. 2). EvoFold exploits the evolutionary signal of genomic multiple-sequence alignments to identify conserved RNA structures.(42) The rs1051886 polymorphic site lies in a stem-pairing region and is predicted to influence the secondary structure of RNA as illustrated with the Vienna RNA folding package in Fig. 2C (www.tbi.univie.ac.at/).(43) Further studies will be needed to experimentally verify if rs1051886 influences splicing events and/or mRNA stability and half-life.
The functional significance of rs3741627 in the 3′ UTR of WNT10B is also unknown. Noncoding SNPs in the 3′ UTR may interfere with motifs involved in post-transcriptional regulation of WNT10B. The A allele is inferred to be ancestral on the basis of the chimpanzee sequence and was present in 0.85 of African and 0.64 of white samples. This SNP is predicted by in silico analysis (http://compbio.utmem.edu/miRSNP/home.php)(45) to alter a putative microRNA target site within the 3′ UTR of WNT10B. The sequence containing the ancestral A allele contains a putative binding site for hsa-miR-518c*, whereas the C allele is predicted to abolish this microRNA site. MicroRNAs pair to the transcripts of protein-coding genes and cause translational repression or mRNA destabilization. Polymorphisms in microRNA target sites may affect the base-pairing between the microRNA and its target site and hence influence microRNA-mediated gene repression. Many target sites for microRNAs seem to be disrupted by SNPs,(46) and recent studies have shown that these SNPs may alter microRNA target gene expression(47) and contribute to phenotypic variability.(48)
This study has several potential limitations. Participants from the Tobago population are of West African descent(19) and thus our results may not be generalizable to other populations. We also cannot rule out the possibility that associations in this study are driven by LD with SNPs that are distant from the WNT10B gene, and experimental studies will be needed to validate the molecular consequences of rs1051886 and rs3741627. Finally, our study did not address the possible contribution of rare substitutions or other types of genetic variation in WNT10B to bone-related phenotypes. Nonetheless, this study also has notable strengths including its large sample size. We also addressed the multiple comparisons issue by replicating the most promising SNP associations. Skeletal assessments included 3D pQCT measures of trabecular and cortical volumetric BMD and bone structure in addition to 2D DXA measures. We resequenced the WNT10B gene region to identify novel SNPs and to validate candidate SNPs in the public databases. In addition, our study conducted replication analyses in a family-based sample recruited from the same geographical region as the population-based sample.
In conclusion, we report that SNPs within the WNT10B gene are associated with measures of cortical bone mass and biomechanical indices of bone strength among individuals of African heritage. Our analyses suggest that sequence variation in the WNT10B gene may contribute to the genetic control of interindividual variability in bone health in this population.
ACKNOWLEDGMENTS
This study was supported, in part, by Grants R03-AR050107 and R01-AR049747 from the National Institute of Arthritis and Musculoskeletal and Skin Diseases and funding from the National Osteoporosis Foundation and Western Pennsylvania Arthritis Foundation. SPM and LMY were supported by National Institute of Aging Grant T32-AG00181.
REFERENCES
- 1.Zmuda JM, Sheu YT, Moffett SP. Genetic epidemiology of osteoporosis: Past, present, and future. Curr Osteoporos Rep. 2005;3:111–115. doi: 10.1007/s11914-005-0019-5. [DOI] [PubMed] [Google Scholar]
- 2.Diaz MN, O’ Neill TW, Silman AJ. The influence of family history of hip fracture on the risk of vertebral deformity in men and women: The European Vertebral Osteoporosis Study. Bone. 1997;20:145–149. doi: 10.1016/s8756-3282(96)00331-6. [DOI] [PubMed] [Google Scholar]
- 3.Fox KM, Cummings SR, Powell-Threets K, Stone K. Family history and risk of osteoporotic fracture. Osteoporos Int. 1998;8:557–562. doi: 10.1007/s001980050099. [DOI] [PubMed] [Google Scholar]
- 4.Johnson ML, Gong G, Kimberling W, Recker SM, Kimmel DB, Recker RR. Linkage of a gene causing high bone mass to human chromosome 11 (11q12-13) Am J Hum Genet. 1997;60:1326–1332. doi: 10.1086/515470. [DOI] [PMC free article] [PubMed] [Google Scholar]
- 5.Little RD, Carulli JP, Del Mastro RG, Dupuis J, Osborne M, Folz C, Manning SP, Swain PM, Zhao SC, Eustace B, Lappe MM, Spitzer L, Zweier S, Braunschweiger K, Benchekroun Y, Hu X, Adair R, Chee L, FitzGerald MG, Tulig C, Caruso A, Tzellas N, Bawa A, Franklin B, McGuire S, Nogues X, Gong G, Allen KM, Anisowicz A, Morales AJ, Lomedico PT, Recker SM, Van Eerdewegh P, Recker RR, Johnson ML. A mutation in the LDL receptor-related protein 5 gene results in the autosomal dominant high-bone-mass trait. Am J Hum Genet. 2002;70:11–19. doi: 10.1086/338450. [DOI] [PMC free article] [PubMed] [Google Scholar]
- 6.Boyden LM, Mao J, Belsky J, Mitzner L, Farhi A, Mitnick MA, Wu D, Insogna K, Lifton RP. High bone density due to a mutation in LDL-receptor-related protein 5. N Engl J Med. 2002;346:1513–1521. doi: 10.1056/NEJMoa013444. [DOI] [PubMed] [Google Scholar]
- 7.Gong Y, Slee RB, Fukai N, Rawadi G, Roman-Roman S, Reginato AM, Wang H, Cundy T, Glorieux FH, Lev D, Zacharin M, Oexle K, Marcelino J, Suwairi W, Heeger S, Sabatakos G, Apte S, Adkins WN, Allgrove J, Arslan-Kirchner M, Batch JA, Beighton P, Black GC, Boles RG, Boon LM, Borrone C, Brunner HG, Carle GF, Dallapiccola B, De Paepe A, Floege B, Halfhide ML, Hall B, Hennekam RC, Hirose T, Jans A, Juppner H, Kim CA, Keppler-Noreuil K, Kohlschuetter A, LaCombe D, Lambert M, Lemyre E, Letteboer T, Peltonen L, Ramesar RS, Romanengo M, Somer H, Steichen-Gersdorf E, Steinmann B, Sullivan B, Superti-Furga A, Swoboda W, van den Boogaard MJ, Van Hul W, Vikkula M, Votruba M, Zabel B, Garcia T, Baron R, Olsen BR, Warman ML The Osteoporosis-Pseudoglioma Syndrome Collaborative. LDL receptor-related protein 5 (LRP5) affects bone accrual and eye development. Cell. 2001;107:513–523. doi: 10.1016/s0092-8674(01)00571-2. [DOI] [PubMed] [Google Scholar]
- 8.Babij P, Zhao W, Small C, Kharode Y, Yaworsky PJ, Bouxsein ML, Reddy PS, Bodine PV, Robinson JA, Bhat B, Marzolf J, Moran RA, Bex F. High bone mass in mice expressing a mutant LRP5 gene. J Bone Miner Res. 2003;18:960–974. doi: 10.1359/jbmr.2003.18.6.960. [DOI] [PubMed] [Google Scholar]
- 9.Koller DL, Rodriguez LA, Christian JC, Slemenda CW, Econs MJ, Hui SL, Morin P, Conneally PM, Joslyn G, Curran ME, Peacock M, Johnston CC, Foroud T. Linkage of a QTL contributing to normal variation in bone mineral density to chromosome 11q12-13. J Bone Miner Res. 1998;13:1903–1908. doi: 10.1359/jbmr.1998.13.12.1903. [DOI] [PubMed] [Google Scholar]
- 10.Ferrari SL, Deutsch S, Choudhury U, Chevalley T, Bonjour JP, Dermitzakis ET, Rizzoli R, Antonarakis SE. Polymorphisms in the low-density lipoprotein receptor-related protein 5 (LRP5) gene are associated with variation in vertebral bone mass, vertebral bone size, and stature in whites. Am J Hum Genet. 2004;74:866–875. doi: 10.1086/420771. [DOI] [PMC free article] [PubMed] [Google Scholar]
- 11.Koller DL, Ichikawa S, Johnson ML, Lai D, Xuei X, Edenberg HJ, Conneally PM, Hui SL, Johnston CC, Peacock M, Foroud T, Econs MJ. Contribution of the LRP5 gene to normal variation in peak BMD in women. J Bone Miner Res. 2005;20:75–80. doi: 10.1359/JBMR.041019. [DOI] [PubMed] [Google Scholar]
- 12.van Meurs JB, Rivadeneira F, Jhamai M, Hugens W, Hofman A, van Leeuwen JP, Pols HA, Uitterlinden AG. Common genetic variation of the low-density lipoprotein receptor-related protein 5 and 6 genes determines fracture risk in elderly white men. J Bone Miner Res. 2006;21:141–150. doi: 10.1359/JBMR.050904. [DOI] [PubMed] [Google Scholar]
- 13.Kiel DP, Ferrari SL, Cupples LA, Karasik D, Manen D, Imamovic A, Herbert AG, Dupuis J. Genetic variation at the low-density lipoprotein receptor-related protein 5 (LRP5) locus modulates Wnt signaling and the relationship of physical activity with bone mineral density in men. Bone. 2007;40:587–596. doi: 10.1016/j.bone.2006.09.029. [DOI] [PMC free article] [PubMed] [Google Scholar]
- 14.van Meurs JB, Trikalinos TA, Ralston SH, Balcells S, Brandi ML, Brixen K, Kiel DP, Langdahl BL, Lips P, Ljunggren O, Lorenc R, Obermayer-Pietsch B, Ohlsson C, Pettersson U, Reid DM, Rousseau F, Scollen S, Van Hul W, Agueda L, Akesson K, Benevolenskaya LI, Ferrari SL, Hallmans G, Hofman A, Husted LB, Kruk M, Kaptoge S, Karasik D, Karlsson MK, Lorentzon M, Masi L, McGuigan FE, Mellström D, Mosekilde L, Nogues X, Pols HA, Reeve J, Renner W, Rivadeneira F, van Schoor NM, Weber K, Ioannidis JP, Uitterlinden AG. Large-scale analysis of association between LRP5 and LRP6 variants and osteoporosis. JAMA. 2008;299:1277–90. doi: 10.1001/jama.299.11.1277. [DOI] [PMC free article] [PubMed] [Google Scholar]
- 15.Richards JB, Rivadeneira F, Inouye M, Pastinen TM, Soranzo N, Wilson SG, Andrew T, Falchi M, Gwilliam R, Ahmadi KR, Valdes AM, Arp P, Whittaker P, Verlaan DJ, Jhamai M, Kumanduri V, Moorhouse M, van Meurs JB, Hofman A, Pols HA, Hart D, Zhai G, Kato BS, Mullin BH, Zhang F, Deloukas P, Uitterlinden AG, Spector TD. Bone mineral density, osteoporosis, and osteoporotic fractures: A genome-wide association study. Lancet. 2008;371:1505–1512. doi: 10.1016/S0140-6736(08)60599-1. [DOI] [PMC free article] [PubMed] [Google Scholar]
- 16.Bennett CN, Longo KA, Wright WS, Suva LJ, Lane TF, Hankenson KD, MacDougald OA. Regulation of osteoblastogenesis and bone mass by Wnt10b. Proc Natl Acad Sci USA. 2005;102:3324–3329. doi: 10.1073/pnas.0408742102. [DOI] [PMC free article] [PubMed] [Google Scholar]
- 17.Glynn NW, Meilahn EN, Charron M, Anderson SJ, Kuller LH, Cauley JA. Determinants of bone mineral density in older men. J Bone Miner Res. 1995;10:1769–1777. doi: 10.1002/jbmr.5650101121. [DOI] [PubMed] [Google Scholar]
- 18.Hill DD, Cauley JA, Sheu Y, Bunker CH, Patrick AL, Baker CE, Beckles GL, Wheeler VW, Zmuda JM. Correlates of bone mineral density in men of African ancestry: The Tobago Bone Health Study. Osteoporos Int. 2008;19:227–234. doi: 10.1007/s00198-007-0450-9. [DOI] [PubMed] [Google Scholar]
- 19.Miljkovic-Gacic I, Ferrell RE, Patrick AL, Kammerer CM, Bunker CH. Estimates of African, European and Native American ancestry in Afro-Caribbean men on the island of Tobago. Hum Hered. 2005;60:129–133. doi: 10.1159/000089553. [DOI] [PubMed] [Google Scholar]
- 20.Wang X, Kammerer CM, Wheeler VW, Patrick AL, Bunker CH, Zmuda JM. Genetic and environmental determinants of volumetric and areal BMD in multi-generational families of African ancestry: The Tobago Family Health Study. J Bone Miner Res. 2007;22:527–536. doi: 10.1359/jbmr.070106. [DOI] [PubMed] [Google Scholar]
- 21.Schiessl H, Ferretti JL, Tysarczyk-Niemeyer G, Willnecker J. Noninvasive bone strength index as analyzed by peripheral quantitative computed tomography (pQCT) In: Schoneau E, editor. Paediatric Osteology: New Developments in Diagnostics and Therapy. Amsterdam, The Netherlands: Elsevier; 1996. pp. 141–146. [Google Scholar]
- 22.Kruglyak L, Nickerson DA. Variation is the spice of life. Nat Genet. 2001;27:234–236. doi: 10.1038/85776. [DOI] [PubMed] [Google Scholar]
- 23.Rinaldo A, Bacanu SA, Devlin B, Sonpar V, Wasserman L, Roeder K. Characterization of multilocus linkage disequilibrium. Genet Epidemiol. 2005;28:193–206. doi: 10.1002/gepi.20056. [DOI] [PubMed] [Google Scholar]
- 24.Yuan HY, Chiou JJ, Tseng WH, Liu CH, Liu CK, Lin YJ, Wang HH, Yao A, Chen YT, Hsu CN. FASTSNP: An always up-to-date and extendable service for SNP function analysis and prioritization. Nucleic Acids Res. 2006;34:W635–W641. doi: 10.1093/nar/gkl236. [DOI] [PMC free article] [PubMed] [Google Scholar]
- 25.Devlin B, Risch N. A comparison of linkage disequilibrium measures for fine-scale mapping. Genomics. 1995;29:311–322. doi: 10.1006/geno.1995.9003. [DOI] [PubMed] [Google Scholar]
- 26.Stephens M, Smith NJ, Donnelly P. A new statistical method for haplotype reconstruction from population data. Am J Hum Genet. 2001;68:978–989. doi: 10.1086/319501. [DOI] [PMC free article] [PubMed] [Google Scholar]
- 27.Almasy L, Blangero J. Multipoint quantitative-trait linkage analysis in general pedigrees. Am J Hum Genet. 1998;62:1198–1211. doi: 10.1086/301844. [DOI] [PMC free article] [PubMed] [Google Scholar]
- 28.Jiang R, Duan J, Windemuth A, Stephens JC, Judson R, Xu C. Genome-wide evaluation of the public SNP databases. Pharmacogenomics. 2003;4:779–789. doi: 10.1517/phgs.4.6.779.22821. [DOI] [PubMed] [Google Scholar]
- 29.Ferretti JL, Capozza RF, Zanchetta JR. Mechanical validation of a tomographic (pQCT) index for noninvasive estimation of rat femur bending strength. Bone. 1996;18:97–102. doi: 10.1016/8756-3282(95)00438-6. [DOI] [PubMed] [Google Scholar]
- 30.Krishnan V, Bryant HU, Macdougald OA. Regulation of bone mass by Wnt signaling. J Clin Invest. 2006;116:1202–1209. doi: 10.1172/JCI28551. [DOI] [PMC free article] [PubMed] [Google Scholar]
- 31.Wang X, Kammerer CM, Wheeler VW, Patrick AL, Bunker CH, Zmuda JM. Pleiotropy and heterogeneity in the expression of bone strength-related phenotypes in extended pedigrees. J Bone Miner Res. 2007;22:1766–1772. doi: 10.1359/jbmr.070718. [DOI] [PubMed] [Google Scholar]
- 32.Turner CH, Hsieh YF, Muller R, Bouxsein ML, Rosen CJ, McCrann ME, Donahue LR, Beamer WG. Variation in bone biomechanical properties, microstructure, and density in BXH recombinant inbred mice. J Bone Miner Res. 2001;16:206–213. doi: 10.1359/jbmr.2001.16.2.206. [DOI] [PubMed] [Google Scholar]
- 33.Kang S, Bennett CN, Gerin I, Rapp LA, Hankenson KD, Macdougald OA. Wnt signaling stimulates osteoblastogenesis of mesenchymal precursors by suppressing CCAAT/enhancer-binding protein alpha and peroxisome proliferator-activated receptor gamma. J Biol Chem. 2007;282:14515–14524. doi: 10.1074/jbc.M700030200. [DOI] [PubMed] [Google Scholar]
- 34.Bennett CN, Hodge CL, MacDougald OA, Schwartz J. Role of Wnt10b and C/EBPalpha in spontaneous adipogenesis of 243 cells. Biochem Biophys Res Commun. 2003;302:12–16. doi: 10.1016/s0006-291x(03)00092-5. [DOI] [PubMed] [Google Scholar]
- 35.Longo KA, Wright WS, Kang S, Gerin I, Chiang SH, Lucas PC, Opp MR, MacDougald OA. Wnt10b inhibits development of white and brown adipose tissues. J Biol Chem. 2004;279:35503–35509. doi: 10.1074/jbc.M402937200. [DOI] [PubMed] [Google Scholar]
- 36.Wright WS, Longo KA, Dolinsky VW, Gerin I, Kang S, Bennett CN, Chiang SH, Prestwich TC, Gress C, Burant CF, Susulic VS, MacDougald OA. Wnt10b inhibits obesity in ob/ob and agouti mice. Diabetes. 2007;56:295–303. doi: 10.2337/db06-1339. [DOI] [PubMed] [Google Scholar]
- 37.Christodoulides C, Scarda A, Granzotto M, Milan G, Dalla Nora E, Keogh J, De Pergola G, Stirling H, Pannacciulli N, Sethi JK, Federspil G, Vidal-Puig A, Farooqi IS, O'Rahilly S, Vettor R. WNT10B mutations in human obesity. Diabetologia. 2006;49:678–684. doi: 10.1007/s00125-006-0144-4. [DOI] [PMC free article] [PubMed] [Google Scholar]
- 38.Bennett CN, Ouyang H, Ma YL, Zeng Q, Gerin I, Sousa KM, Lane TF, Krishnan V, Hankenson KD, Macdougald OA. Wnt10b increases postnatal bone formation by enhancing osteoblast differentiation. J Bone Miner Res. 2007;22:1924–1932. doi: 10.1359/jbmr.070810. [DOI] [PubMed] [Google Scholar]
- 39.Akhter MP, Wells DJ, Short SJ, Cullen DM, Johnson ML, Haynatzki GR, Babij P, Allen KM, Yaworsky PJ, Bex F, Recker R. Bone biomechanical properties in LRP5 mutant mice. Bone. 2004;35:162–169. doi: 10.1016/j.bone.2004.02.018. [DOI] [PubMed] [Google Scholar]
- 40.Sawakami K, Robling AG, Ai M, Pitner ND, Liu D, Warden SJ, Li J, Maye P, Rowe DW, Duncan RL, Warman ML, Turner CH. The Wnt co-receptor LRP5 is essential for skeletal mechanotransduction but not for the anabolic bone response to parathyroid hormone treatment. J Biol Chem. 2006;281:23698–23711. doi: 10.1074/jbc.M601000200. [DOI] [PubMed] [Google Scholar]
- 41.Robinson JA, Chatterjee-Kishore M, Yaworsky PJ, Cullen DM, Zhao W, Li C, Kharode Y, Sauter L, Babij P, Brown EL, Hill AA, Akhter MP, Johnson ML, Recker RR, Komm BS, Bex FJ. Wnt/beta-catenin signaling is a normal physiological response to mechanical loading in bone. J Biol Chem. 2006;281:31720–31728. doi: 10.1074/jbc.M602308200. [DOI] [PubMed] [Google Scholar]
- 42.Pedersen JS, Bejerano G, Siepel A, Rosenbloom K, Lindblad-Toh K, Lander ES, Kent J, Miller W, Haussler D. Identification and classification of conserved RNA secondary structures in the human genome. PLOS Comput Biol. 2006;2:e33. doi: 10.1371/journal.pcbi.0020033. [DOI] [PMC free article] [PubMed] [Google Scholar]
- 43.Hofacker IL. Vienna RNA secondary structure server. Nucleic Acids Res. 2003;31:3429–3431. doi: 10.1093/nar/gkg599. [DOI] [PMC free article] [PubMed] [Google Scholar]
- 44.Nielsen KB, Sørensen S, Cartegni L, Corydon TJ, Doktor TK, Schroeder LD, Reinert LS, Elpeleg O, Krainer AR, Gregersen N, Kjems J, Andresen BS. Seemingly neutral polymorphic variants may confer immunity to splicing-inactivating mutations: A synonymous SNP in exon 5 of MCAD protects from deleterious mutations in a flanking exonic splicing enhancer. Am J Hum Genet. 2007;80:416–432. doi: 10.1086/511992. [DOI] [PMC free article] [PubMed] [Google Scholar]
- 45.Bao L, Zhou M, Wu L, Lu L, Goldowitz D, Williams RW, Cui Y. PolymiRTS Database: Linking polymorphisms in microRNA target sites with complex traits. Nucleic Acids Res. 2007;35:D51–D54. doi: 10.1093/nar/gkl797. [DOI] [PMC free article] [PubMed] [Google Scholar]
- 46.Saunders MA, Liang H, Li WH. Human polymorphism at microRNAs and microRNA target sites. Proc Natl Acad Sci USA. 2007;104:3300–3305. doi: 10.1073/pnas.0611347104. [DOI] [PMC free article] [PubMed] [Google Scholar]
- 47.Adams BD, Furneaux H, White BA. The micro-ribonucleic acid (miRNA) miR-206 targets the human estrogen receptor-alpha (ERalpha) and represses ERalpha messenger RNA and protein expression in breast cancer cell lines. Mol Endocrinol. 2007;21:1132–1147. doi: 10.1210/me.2007-0022. [DOI] [PubMed] [Google Scholar]
- 48.Clop A, Marcq F, Takeda H, Pirottin D, Tordoir X, Bibé B, Bouix J, Caiment F, Elsen JM, Eychenne F, Larzul C, Laville E, Meish F, Milenkovic D, Tobin J, Charlier C, Georges M. A mutation creating a potential illegitimate microRNA target site in the myostatin gene affects muscularity in sheep. Nat Genet. 2006;38:813–818. doi: 10.1038/ng1810. [DOI] [PubMed] [Google Scholar]