

Abstract
Amyloid-β (Aβ) the primary component of the senile plaques found in Alzheimer’s disease (AD) is generated by the rate-limiting cleavage of amyloid precursor protein (APP) by β-secretase followed by γ-secretase cleavage. Identification of the primary β-secretase gene, BACE1, provides a unique opportunity to examine the role this unique aspartyl protease plays in altering Aβ metabolism and deposition that occurs in AD. The current experiments seek to examine how modulating β-secretase expression and activity alters APP processing and Aβ metabolism in vivo. Genomic-based BACE1 transgenic mice were generated that overexpress human BACE1 mRNA and protein. The highest expressing BACE1 transgenic line was mated to transgenic mice containing human APP transgenes. Our biochemical and histochemical studies demonstrate that mice over-expressing both BACE1 and APP show specific alterations in APP processing and age-dependent Aβ deposition. We observed elevated levels of Aβ isoforms as well as significant increases of Aβ deposits in these double transgenic animals. In particular, the double transgenics exhibited a unique cortical deposition profile, which is consistent with a significant increase of BACE1 expression in the cortex relative to other brain regions. Elevated BACE1 expression coupled with increased deposition provides functional evidence for β-secretase as a primary effector in regional amyloid deposition in the AD brain. Our studies demonstrate, for the first time, that modulation of BACE1 activity may play a significant role in AD pathogenesis in vivo.
Alzheimer’s disease (AD)1 is a neurodegenerative disease characterized clinically by progressive cognitive impairment (1) and neuropathologically by the presence of senile neuritic plaques and neurofibrillary tangles within the brain. The primary constituent of the senile plaques is amyloid-β (Aβ) (2), a peptide of 39-42 amino acids derived from the amyloid precursor protein (APP). Aβ deposition proceeds in a characteristic pattern within the brain with the appearance of plaques first in the basal neocortex, followed by deposition in the frontal cortex, and hippocampal formation until all areas of the cortex contain deposits at end stage AD (3).
The generation of Aβ from APP involves three proteases with distinct activities, termed α-, β-, and γ-secretase. APP cleavage follows two pathways: cleavage by α-secretase generates C-terminal fragment-α (CTF-α), precluding the formation of Aβ upon subsequent γ-secretase cleavage. Alternatively, cleavage by β-secretase at Asp1 or Glu11 of the Aβ sequence (4, 5) generates a unique C-terminal membrane-retained fragment, known as CTF-β. Subsequent cleavage of CTF-β by γ-secretase results in formation of Aβ (for review, see Selkoe, Ref. 6). The Swedish FAD double mutation of APP (7) appears to shift this cleavage pathway to favor processing by β-secretase, leading to a significant increase in Aβ production (8, 9).
The first APP secretase gene identified was that encoding β-secretase (BACE1) (4, 10-12). BACE1, located on human chromosome 11q23.3, encodes a unique aspartyl protease with a single transmembrane domain (4). Overexpression of BACE1 in culture shows significantly increased β-secretase activity and Aβ levels in cells coexpressing APP (4, 11). Several studies have shown that BACE1 protein and activity levels are significantly increased in the AD brain (13-15), particularly the neocortex and hippocampus (13). BACE1 is the primary β-secretase involved in generation of Aβ in vivo, as shown by knockout experiments in mice (5, 16, 17). These studies are significant in considering therapeutics for Aβ elimination, but it is still unclear how alterations in BACE1 levels, and activity may play a role in AD pathology in vivo.
To gain insight into how the modulation of BACE1 activity affects AD pathogenesis, we have utilized genomic-based transgenic methods to model AD pathology in vivo. Here we report the characterization of a human BACE1 transgenic line that produces human BACE1 mRNA and protein in mice. In addition, we show that animals expressing human BACE1 and human mutant APP have altered production of APP C-terminal fragments and increased levels of Aβ peptides. Finally, we report that human BACE1 and human APP transgenic animals exhibit an altered brain regional pattern of Aβ production and deposition, which reflects the relative levels of BACE1 protein in these brain regions. These studies demonstrate that overexpression of human BACE1 alters the APP processing pathway and directly impacts the regional pattern of Aβ deposition. Our findings suggest that modulation of human BACE1 expression, and activity may play a significant role in AD pathogenesis.
MATERIALS AND METHODS
Animals and Genetic Crosses
All animals were handled according to official guidelines (IACUC). Animals were bred on a mixed C57BL/6J × SJL background. BACE1 transgenic animals were crossed to APP transgenics (Tg2576), which contain the Swedish mutant human APP cDNA (kindly provided by K. Hsiao, University of Minnesota). Progeny of this cross were sacrificed at 2-3 months of age for biochemical analysis and at 12 months of age for Aβ immunohistochemistry and age-dependent biochemical analyses.
Human BACE1 Genomic Analysis
Human BACE1 was mapped to human chromosome 11q23.3 (4, 10). Sequence-tagged sites (STSs) and gene markers on 11q23.3 were used to identify the precise genomic localization of human BACE1. The human BACE1 cDNA (GenBank™ accession no. AF190725) was used to search the human genome by NCBI Blast (www.ncbi.nlm.nih.gov/BLAST) to identify genomic bacterial artificial chromosome (BAC) clones containing the full-length human BACE1 gene. In addition, BAC-end sequence (available from www.tigr.org/tdb/humgen/bac_end_search/bac_end_intro.shtml) and the published genome assembly (genome.cse.ucsc.edu/) were valuable resources in determining locus coverage for each clone. Sequencing was performed by Cleveland Genomics (Cleveland, OH) if no end sequence was available. Genomic clones identified in silico were further verified by PCR with STSs A005A12, WI-7101, D11S1340, D11S939, and BAC vector arm primers.
Isolation and Purification of BAC Clones
BAC clones 794I11 (Gen-Bank™ accession no. AP000761), 677N11 (GenBank™ accession no. AC020997), and 407N16 were obtained from the human RPCI-11 library. Once BAC clones containing full-length BACE1 were identified, they were purified using the Clontech Nucleobond column (Palo Alto, CA). To obtain a higher grade of ultra-pure DNA suitable for pronuclear microinjection (18), purified BAC DNA was passed through a CL4B Sepharose column (Amersham Biosciences). The column was equilibrated with injection buffer (10 mm Tris-HCl, pH 7.5, 0.1 mm EDTA, and 100 mm NaCl) and the DNA collected in 12 elution fractions. The appropriate fraction containing the BAC was diluted to a concentration ranging between 0.6 -1.0 ng/μl.
Generation of BACE1 Transgenic Mice
Transgenic mice were generated by direct microinjection of BAC DNA into the pronuclei of fertilized mouse eggs. This method was performed as described (19). The embryos injected were F2 progeny of a C57BL6/SJL F1 cross and were surgically transferred into the oviducts of a pseudopregnant CD-1 female. Founder mice transgenic for BAC clones corresponding to the human BACE1 locus were identified by PCR from mouse tail DNA. Genotyping markers to identify founders were the STS A005A12, which is located ∼4 kilobases downstream of BACE1 exon 9, and a custom primer, which is located 10 kilobases upstream of BACE1 exon 1, with the sequence 5′-TGGAGAGTAATTTGCAATGCC-3′ and 3′-TTTGAATCCAAGGTTTTGCC-5′.
Southern Blot Hybridization
Genomic DNA was prepared from a human BACE1 PCR-positive transgenic mouse tail and a nontransgenic mouse tail using a standard salting out procedure (20). BAC 794I11 was purified as described above. Southern blots containing BamHI-digested genomic tail DNA (10 μg) and BAC DNA (∼100 ng) were prepared as described (21). Both 32P-labeled human BACE1 cDNA and 32P-labeled human repetitive Alu element probes were used. The 1.1-kbp human BACE1 cDNA specific to the 3′-end of BACE1 (IMAGE clone 490377, GenBank™ no. AA136283) was obtained from Research Genetics (Invitrogen Life Technologies). The 284 bp Alu element utilized was described previously (22). Hybridization was done at 65 °C with Church and Gilbert Solution (500 mm NaPO4, 1 mm EDTA, 1% bovine serum albumin, 7% SDS). Blots were washed with 0.2× SSC and 0.5% SDS at 65 °C.
RT-PCR Analysis
Total RNA was isolated from transgenic and nontransgenic mouse brain, pancreas, kidney, liver, colon, spleen, lung, testes, and ear by polytron homogenization of tissue in TRIzol Reagent (Invitrogen Life Technologies). Each RNA preparation (2 μg) was reverse-transcribed in the presence of 50 pmol of random hexamer primers (Invitrogen Life Technologies) and Reverse Transcriptase™ (Invitrogen Life Technologies). After reverse transcription, 1/20 of the reverse transcriptase reaction was incubated in a PCR reaction with 50 pmol of primers with sequence 5′-GGAGGGAGCATGATCATTGG-3′ and 5′-ACAGTCGTCTTGGGACGTGG-3′ for 20 cycles at an annealing temperature of 60 °C. These primers recognize both mouse and human Bace1/BACE1 transcripts and amplify a 446-bp product that spans exons 4-8 of the gene. PCR products were purified and then digested with BglII restriction enzyme, which digests the mouse Bace1 product uniquely into two fragments (324 and 122 bp in size), leaving human BACE1 product uncleaved.
For quantitation of total human BACE1 transcripts relative to mouse Bace1 transcripts in brain tissue, included in the PCR reaction was 50 pmol of exon 8 primer, which was 5′-end-labeled with [γ-32P]ATP and T4 polynucleotide kinase. After determining the linear range of the PCR reaction between reverse transcriptase products and BACE1 PCR product, the last cycle (cycle 20) was spiked with [γ-32P]ATP-BACE1-exon 8 primer. Resulting BglII PCR products were fractionated on 2% agarose gels, stained with ethidium bromide, photographed, and then dried and exposed to phosphorimager.
Tissue Preparation and Biochemical Analysis
Protein was isolated from 2-month-old transgenic and nontransgenic mouse brain tissues by polytron homogenization in 1% CHAPS solution in phosphate-buffered saline with 1× protease inhibitors (pepstatin, 1 μm; leupeptin, 4.5 μg/ml; aprotinin, 30 μg/ml; phenylmethanesulfonyl fluoride, 1 mm). For analysis of BACE1 protein expression, 20 μg of total protein were resolved on 8% Tris-glycine gels (Invitrogen Life Technologies). Two antibodies were used to analyze BACE1 protein expression: 1) α-BACE-3599, a rabbit polyclonal antibody raised against amino acids 46-136 of human BACE1 (5) (kindly provided by P. Wong, Ph.D., Johns Hopkins University), and 2) 00/6, a rabbit polyclonal antibody raised against amino acids 485-501 of human BACE1 (23).
For analysis of APP C-terminal fragments, 20 μg of total protein were resolved on 4-12% Bis-Tris gradient gels (Invitrogen Life Technologies). Brain tissue extracts were blotted with 369, a polyclonal antibody raised against the C terminus of APP (kindly provided by S. Gandy, M.D., Ph.D., Thomas Jefferson University). All protein blots were probed with either anti-rabbit horseradish peroxidase-conjugated (Amersham Biosciences) or peroxidase-labeled protein A (KPL, Inc., Gaithersburg, MD) secondary antibodies and detected by chemiluminescence (ECL, Amersham Biosciences).
For analysis of soluble and insoluble protein pools, brain regions (cortex, hippocampus, cerebellum, olfactory bulb) from 12-month-old animals were homogenized in 0.1 m carbonate/50 mm NaCl (pH 11.5) buffer with protease inhibitors (20 μg/ml aprotinin, 10 μg/ml leupeptin) as previously described (24). After homogenization, samples were centrifuged at 14,000 rpm for 20 min at 4 °C. The supernatant was transferred to another tube and neutralized to pH 7.4 with 1 m Tris, pH 6.8. The pellet was further homogenized in 5 m guanidine-HCl in 50 mm Tris-HCl, pH 8.0 as previously described (25).
Western Blot Quantitation
BACE1 protein expression was quantitated by comparing the amount of BACE1 protein in transgenic and nontransgenic brain tissue extracts relative to a standard curve of Bace1 expression. After incubation with ECL, the signal was captured with a fluorescence imager (Fluor-S-Max Imaging Machine, Bio-Rad) for each sample in triplicate and used to determine the fold increase of human BACE1 protein expression. APP C-terminal fragments were quantitated by comparing the relative ratio of CTF-β to the total amount of C-terminal fragments generated for each animal. After exposing blots to film, the films were scanned and APP C-terminal fragment bands were quantitated by image densitometry using Image-Quant 1.20 software (Molecular Dynamics).
Sandwich ELISA for Aβ
Brain extracts from 2-month-old animals were analyzed for levels of Aβ peptides as previously described (26). Sandwich ELISAs were used with antibodies detecting the different species of Aβ ending in 40 amino acids. Specifically, BNT-77/BA-27 was used to capture and detect Aβ peptides x-40. Brain region extracts from 12-month-old animals (described above) were analyzed for levels of Aβ peptides using Aβ1-40 ELISA (BIOSOURCE International, Camarillo, CA). Dilution ranges were determined for carbonate (soluble) and guanidine (insoluble) extracts and standards were serially diluted in the same sample dilution buffer containing protease inhibitors. The values were read using fluorometric plate reader Wallac 1420 multilabel counter (PerkinElmer Life Sciences, Wellesly, MA). Aβ40 concentrations were determined based on sample values relative to the serially diluted standards representing a standard curve of known Aβ40 concentration. Each sample was analyzed in triplicate, and sample values are expressed as pmol of Aβ40/gram brain tissue weight.
Immunohistochemistry
For Aβ immunostaining, half-brains were immersion-fixed in 10% formalin and embedded in paraffin. The methods for Aβ immunostaining were performed as previously described by Kulnane and Lamb (27). Brain sections were stained with 6E10 (Senetek, Napa, CA), a mouse monoclonal antibody that is directed against Aβ-(1-17). For BACE1 immunostaining, animals were anesthetized with Avertin (0.02 cc/gm of body weight) and transcardially perfused with ice-cold phosphate buffer (0.1 m, pH 7.4) followed by 4% paraformaldehyde. After perfusion, whole brains were immersion-fixed in 4% paraformaldehyde for > 24 h and then cryoprotected in 30% sucrose. Sagittal sections were cut on a sliding microtome and stored at -80 °C. Brain sections were treated with avidin-biotin blocking kit (Vector Laboratories, Burlingame, CA) and blocked in 10% normal goat serum (Sigma-Aldrich Co.). Sections were stained with B279 rabbit polyclonal antibody (kindly provided by R. Yan, Ph.D., Cleveland Clinic Foundation), directed toward amino acids 295-310 of human BACE (28), which shares identical sequence with mouse Bace1. All sections were incubated in biotinylated goat anti-rabbit secondary antibody (Vector Laboratories, Burlingame, CA). Sections were prepared according to standard methods using Vectastain ABC Kit (Vector Laboratories, Burlingame, CA) with the chromogen 3,3-diaminobenzidine tetrahydrochloride (DAB) and counterstained with hematoxylin. For BACE1 immunofluorescence, cryosections were stained with B279 primary antibody overnight at 4 °C. For double immunofluorescence, cryosections were stained with B279 BACE1 antibody and mouse monoclonal antibody anti-NeuN MAB377 (Chemicon International, Temecula, CA). After several washes, Alexa 488-conjugated goat anti-rabbit (for BACE1 signal) and Alexa 546-conjugated goat anti-mouse (for NeuN signal) secondary antibodies were added to the incubation buffer (Molecular Probes) and mounted with Vecta-Shield Hard Set containing DAPI counterstain (Vector Laboratories).
Aβ Plaque Quantitation
Digital images of brain sections were captured with Qimaging Micropublisher and Qcapture v2.64 (Burnaby, British Columbia, Canada). Amyloid deposition was assessed in brain regions ranging from primary motor cortex, primary somatosensory cortex, primary, and secondary visual cortex, and hippocampus. For quantitative analysis of Aβ deposition, five sections from each animal were analyzed with Image-Pro Plus v4.5 (Mediacybernetics Inc., Silver Spring, MD). The five sections spanned mouse brain Bregma locations from lateral 0.84 mm to lateral 2.40 mm (29). Plaque counts were determined following specific criteria for an immunopositive plaque, namely color, percent area, roundness, length, and width. Length and width criteria were fixed at minimal restrictions of ≥5 μm per plaque. These analyses were performed blinded to genotype.
Statistical Analysis
Two-tailed Student’s t tests were utilized for statistical analyses when variances for each sample population were equal. Two-tailed Student’s t test with Welch’s correction was used to adjust for unequal variances between sample populations. One-way ANOVA was utilized to compare BACE1 expression across brain regions. All data were analyzed by GraphPad Prism 2.0 statistical software (GraphPad Software, Inc., San Diego, CA).
RESULTS
Identification of Human BACE1 Genomic Clones
Based on the mapping of BACE1 previously reported (30), we were able to detect the position of the BACE1 locus on human chromosome 11q23.3 (Fig. 1A). Examination of the genomic and published protein sequence indicated that BACE1 spans nine exons, extending across ∼30,541 base pairs. Using the human genomic sequence available and known nearby genes on chromosome 11, we were able to identify several genomic clones with extensive coverage of the BACE1 genomic locus. We used sequence-tagged sites (STS) mapping techniques with four STSs to pinpoint the extent of genomic clone coverage for BACE1. Further analysis of the BAC Fingerprint Data Base (genome.wustl.edu/projects/human) and the genome survey sequence (GSS@NCBI) data base revealed three BAC clones that localized to the BACE1 gene region, BACs 794I11 (GenBank™ accession no. AP000761), 677N11 (GenBank™ accession no. AC020997), and 407N16 (Fig. 1A).
Fig. 1. Generation of genomic-based human BACE1 transgenic mice.

A, top genomic map of the BACE1 locus with the relative position of the BACE1 gene (as represented by the STS A005A12), nearby genes and STSs, and corresponding BAC clones on chromosome 11q23.3. (bottom) human BACE1 transgenics recovered by pronuclear microinjection. Founders were recovered for three different BAC clones shown at right. Plus (+) signs indicate PCR-positive animals for the corresponding STSs and primers at the chromosome 11 locus. B and C, genomic DNA from BACE1 transgenic (Tg), nontransgenic littermate (NT), human genomic (Hu), and/or 794I11 BAC DNA was digested with BamHI, run on agarose gel, transferred to nylon membrane and hybridized with a 32P-labeled human BACE1 cDNA (B) and human Alu repetitive element (C). On the left are shown the sizes of molecular weight markers in kbp.
BAC 794I11 contains ∼45 kilobases upstream of the ATG start site for BACE1 and ∼99 kilobases downstream of the BACE1 poly(A) tail. BACs 677N11 and 407N16 contains ∼40 kilobases upstream of the 5′-end of BACE1. These BACs also contain ∼38 kilobases downstream of the 3′-end of BACE1 (shown in Fig. 1A). Thus, these three clones, which cover the entire BACE1 locus, were determined suitable to generate BACE1 transgenic mice.
Expression and Activity of Human BACE1 in Mice
Upon pronuclear microinjection of each BACE1 BAC clone, we recovered at least one founder mouse for each clone (Fig. 1A). Each of these transgenic lines was analyzed for construct integration, copy number, and BACE1 expression levels. As our previous studies indicated that genomic-based transgenes exhibited copy number dependence (22), we chose to focus on transgenic line 794I11-3 in the current study as this line exhibited the highest copy number and level of BACE1 expression, as described below. To confirm the integrity of the BAC in PCR-positive animals for line 794I11-3, Southern blot hybridization with the human Alu repeat probe revealed that 794I11-3 transgenics exhibit an identical human-specific Alu profile to that of the purified BAC clone (Fig. 1C). Furthermore, Southern blot hybridization with a human BACE1 cDNA specific for the 3′-end of BACE1 revealed the expected 12.4-kbp band in animals transgenic for BAC794I11 when digested with BamHI (Fig. 1B). These results confirm BAC 794I11 has integrated intact in this transgenic line.
The level of human BACE1 mRNA expression in transgenic line 794I11-3 was analyzed using an reverse transcriptase-PCR assay with conserved oligonucleotides that amplify both mouse and human BACE1 transcripts across exons 4-8. The resulting products were digested with a restriction enzyme that cleaves the mouse products and leaves the human products undigested. This RT-PCR analysis revealed the coexpression of mouse and human Bace1/BACE1 in multiple tissues including brain, pancreas, lung, liver, colon, and spleen (Fig. 2A).
Fig. 2. Human BACE1 mRNA and protein expression and quantitation.

A, RT-PCR analysis with conserved primers corresponding to sequences identical between mouse and human Bace1/BACE1 mRNAs was performed on reverse-transcribed RNA from brain, kidney, liver, heart, colon, spleen, lung, testes, and ear from nontransgenic (NT) and human BACE1 transgenic (Tg) mice. The resulting 446 bp products were digested with BglII to generate 324 and 122 bp mBace fragments, while the human products (hBACE) remain undigested. Left, approximate sizes in bp. B, relative levels of human BACE1 mRNA: mouse Bace1 mRNA in brain. Human BACE1 mRNA is expressed 4.7-fold higher than mouse Bace1 mRNA (two-tailed Student’s t test, p value = 0.017, error bars represent S.E.). C, Western blot analysis of mouse and human BACE1 in 1% CHAPS brain extracts. Twenty micrograms of total protein from 8-week-old nontransgenic control (Ctl), BACE1 transgenic (Tg), and mouse Bace1 KO mice were run on 8% Tris-glycine gels, transferred to polyvinylidene difluoride membrane, and blotted with C-terminal antibody BACE-00/6. On the left for each gel are sizes of molecular mass markers in kilodaltons. D, BACE1 protein expression was quantitated by comparing the amount of BACE1 protein in transgenic (n = 9) and nontransgenic (n = 9) brain tissue extracts relative to a standard curve of Bace1 expression using a fluorescence imager for capture of chemiluminescent signal. Human BACE1 is expressed ∼2-fold higher than control (two-tailed Student’s t test, p value < 0.0001).
To quantify the level of mRNA expression in transgenic line 794I11-3, γ-32P-labeled oligonucleotides were added in the linear range of the PCR reaction for the final cycle. The amount of undigested human BACE1 products relative to digested mouse Bace1 products were based on densitometry upon exposure to a phosphorimager. After PCR amplification of the BACE1/Bace1 cDNA and restriction enzyme digestion, we determined that human BACE1 mRNA in brain is expressed ∼4.7-fold higher than mouse Bace1 (two-tailed Student’s t test, p value = 0.017) (Fig. 2B).
To determine the level of human BACE1 protein levels in transgenic line 794I11-3, Western blot analysis of brain extracts revealed higher protein expression in BACE1 transgenic animals compared with nontransgenic littermates, as shown by the dark smear corresponding to the ∼70 kD human BACE1 protein in transgenic brain tissue extracts for both a C-terminal antibody (Fig. 2C) and an N-terminal antibody (data not shown). To quantify the level of human BACE1 protein overexpression, we used the polyclonal antibody specific for the C terminus of BACE1, which recognizes both mouse and human BACE1 (23). Quantification was performed by comparing BACE1 transgenic and nontransgenic brain extracts to a standard curve of nontransgenic protein levels using a fluorescence imager. We determined BACE1 transgenic mice express ∼2-fold higher BACE1 protein compared with nontransgenic controls (two-tailed Student’s t test, p value < 0.0001) (Fig. 2D).
To characterize the regional localization of BACE1 expression in the brain, immunohistochemical staining with B279 antibody (kindly provided by R. Yan) indicates the pattern of BACE1 expression is primarily in the mitral cell layer of the olfactory bulb (Fig. 3, A and B) and cortical layers (Fig. 3, E and F) with low level staining in the hippocampal neurons (Fig. 3, C and D) and Purkinje cells of the cerebellum (data not shown). Double immunofluorescence with anti-mouse NeuN antibody and BACE1 B279 antibody confirms co-localization of human BACE1 in mouse neurons (data not shown). Since this antibody recognizes both mouse Bace1 and human BACE1, DAB chromogen staining and immunofluorescent staining display increases of BACE1 expression in the transgenic animal (Fig. 3, B, D, F) compared with the nontransgenic control (Fig. 3, A, C, E). The neurons exhibiting the highest expression are present in the outer layers of the primary and secondary motor cortices (29), displaying punctate cellular staining (Fig. 3, G and H), consistent with subcellular localization to Golgi compartments and early endosomes (28, 31).
Fig. 3. Human BACE1 immunohistochemical localization.

Brains from 2-month-old BACE1 transgenic (B, D, F) and nontransgenic (A, C, E) animals were cryoprotected in 30% sucrose after perfusion with 4% paraformaldehyde. Sagittal sections were analyzed by staining with polyclonal antibody B279 followed by staining with biotinylated anti-goat secondary antibody (A-F) or Alexa-488-conjugated secondary antibody (G and H). Positive immunoreactivity is present in the olfactory bulb (A and B), hippocampus (C and D), and frontal cortex (E and F). Scale bar in F and H = 200 μm.
Human BACE1 and APP Processing
To determine the impact of BACE1 overexpression on APP processing, we crossed the human BACE1 transgenics to human APP transgenic line Tg2576. These APP transgenics express ∼6-fold higher human APP protein than that of endogenous mouse App and exhibit significantly higher levels of both Aβ1-40 and Aβ1-42/3 peptides (32). We first analyzed the levels of APP-processing products, namely CTF-β and CTF-α. Brain extracts from 2-month-old progeny of BACE1 crossed to Tg2576 were analyzed by Western blot (Fig. 4A). The relative ratio of CTF-β to the total amount of C-terminal fragments generated for each animal was determined with each extract run in triplicate. We determined that animals transgenic for both BACE1 and Tg2576 express significantly higher C-terminal fragment ratios compared with Tg2576 transgenics alone (two-tailed Student’s t test, p value = 3.00 × 10⁻⁴) (Fig. 4B).
Fig. 4. APP processing and Aβ metabolism in BACE1 transgenics.

A, Western blot analysis of APP holoprotein (top) and APP C-terminal fragments (bottom) in 1% CHAPS brain extracts. Twenty micrograms of total protein from ∼2 month-old progeny of BACE1 transgenics crossed to Tg2576 (APP cDNA) transgenic animals were run on 4-12% Bis-Tris gradient gels, transferred to polyvinylidene difluoride membrane, and blotted with APP C-terminal polyclonal antibody 369. On the left are sizes of molecular mass makers in kilodaltons. B, quantitation of relative band intensities of APP C-terminal fragments using chemiluminescence with each brain extract analyzed in triplicate. The ratio of CTF-β: (CTF-β+CTF-α) was compared in animals transgenic for both BACE1 and Tg2576 (n = 6) to animals transgenic for Tg2576 alone (n = 7). Double transgenics had significantly higher APP CTF ratios by two-tailed Student’s t test, p value = 0.0003. C, brain extracts from ∼2-month-old animals were analyzed by ELISA. BACE1/Tg2576 animals (n = 5) had significantly higher levels of Aβ1-40 compared with Tg2576 alone (n = 5) by two-tailed Student’s t test, p value = 0.0040.
To examine the impact of BACE1 overexpression on Aβ metabolism, the levels of Aβ peptide in whole brain extract was measured by ELISA (Fig. 4C). Animals transgenic for both BACE1 and Tg2576 at two months of age exhibit significantly higher levels of Aβ1-40 (two-tailed Student’s t test, p value = 4.00 × 10⁻³).
Human BACE1 and Aβ Deposition
To determine the effect of BACE1 overexpression on Aβ deposition and AD-like neuropathology, the amount of Aβ deposition in brain sections was measured by immunostaining with Aβ antibodies. The APP transgenics, Tg2576, develop Aβ deposits at ∼9-12 months of age (32). Immunostaining with an Aβ-specific antibody at six and ten months of age, we observe no differences in Aβ deposition and plaque profile between the double transgenics compared with APP transgenics alone (data not shown). However, at 12 months of age, animals transgenic for both BACE1 and the Swedish mutant APP exhibit an altered Aβ plaque profile compared with mutant APP transgenics alone (Fig. 5). More specifically, the double transgenics exhibit a significantly higher number of immunoreactive Aβ deposits in the frontal cortex compared with the single transgenics (two-tailed Student’s t test with Welch’s correction, p value = 0.0252) (Fig. 5G). However, while the double transgenics exhibit a unique profile of Aβ deposition in the frontal cortex (Fig. 5, A and B) and olfactory bulb (Fig. 5, C and D), there are only slight increases in hippocampal Aβ deposition (Fig. 5, E and F) between the two groups (two-tailed Student’s t test, p value = 0.126; data not shown).
Fig. 5. Analysis of amyloid-β deposition in BACE1 transgenic animals.
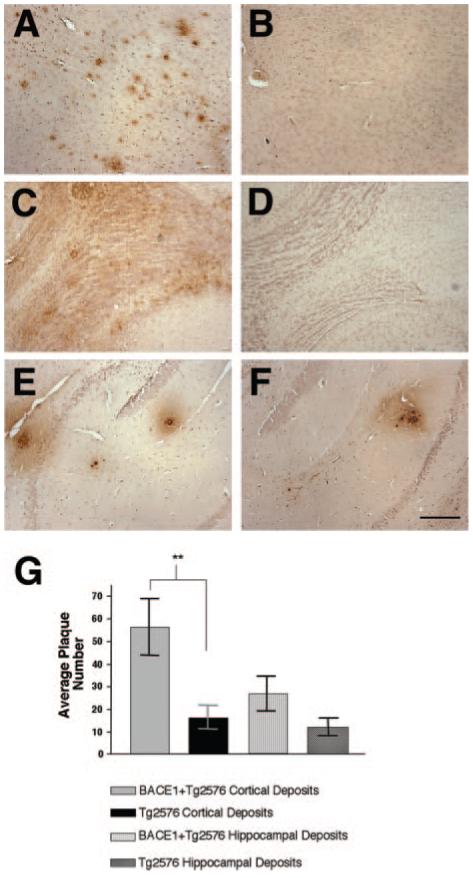
Brains from 12-month-old animals were fixed in 10% formalin, embedded in paraffin, and sectioned on a sagittal plane (10-μm thick). Scattered sections were analyzed by staining using standard protocols (Kulnane and Lamb, Ref. 27) with mAb 6E10, which detects amino acids 1-17 in the Aβ region. Brain sections of animals transgenic for both BACE1 and Tg2576 in cortex (A), olfactory bulb (C), and hippocampus (E). Brain sections of animals transgenic for Tg2576 alone in cortex (B), olfactory bulb (D), and hippocampus (F). A similar pattern of Aβ immunostaining was observed in all double BACE1/Tg2576 transgenics and single Tg2576 transgenics. Scale bar in F = 200 μm. G, immunopositive plaques were counted in sections (5 sections/animal) from each animal transgenic for both BACE1 and Tg2576 (n = 6) as well as Tg2576 alone (n = 6) using Image-Pro Plus (Mediacybernetics, Silver Spring, MD) to identify Aβ deposits in each brain region. The average plaque number is significantly higher in cortical brain regions of the double transgenics compared with single transgenics (**, two-tailed Student’s t test with Welch’s correction, p value = 0.0252, error bars represent S.E.), while hippocampal deposits are not statistically different between both groups.
To further explore the impact of BACE1 expression on Aβ deposition in brain regions, the levels of Aβ peptide for both soluble and insoluble protein pools in four specific brain regions were measured by ELISA at twelve months of age (Fig. 6). Brain region extracts were prepared using a sequential extraction procedure previously described (24). In soluble (carbonate-extracted) protein pools, animals transgenic for both BACE1 and Tg2576 exhibit significantly higher levels of Aβ1-40 in the olfactory bulb (p value = 1.63 × 10⁻²) and cortex (p value = 3.40 × 10⁻³) relative to single Tg2576 transgenics (Fig. 6A). In insoluble (guanidine-extracted) protein pools, double transgenics exhibit significantly higher levels of Aβ1-40 in the olfactory bulb (p value = 1.57 × 10⁻²), hippocampus (p value = 4.00 × 10⁻⁴), and strikingly higher levels in the cortex (p value = 1.60 × 10⁻³) compared with Tg2576 transgenics alone in each of these brain regions (Fig. 6B).
Fig. 6. Amyloid-β production and BACE1 protein expression by brain region.

A and B, brain region extracts from 12-month-old progeny of BACE1 transgenics crossed to Tg2576 transgenics were made using a sequential extraction procedure (see “Materials and Methods”) and analyzed by ELISA. A, soluble Aβ1-40 levels by brain region. BACE1/Tg2576 animals had significantly higher levels of Aβ in olfactory bulb (#, two-tailed Student’s t test, p value = 0.0163) and cortex (*, two-tailed Student’s t test, p value = 0.0034) compared with Tg2576 animals. B, insoluble Aβ1-40 levels by brain region. BACE1/Tg2576 animals had significantly higher levels of Aβ in olfactory bulb (**, two-tailed Student’s t test, p value = 0.0157), hippocampus (††, two-tailed Student’s t test, p value = 0.0004), and cortex (*, Student’s two-tailed t test, p value = 0.0016) compared with Tg2576 animals. C, BACE1 protein expression was quantitated using Western blot analysis by comparing the amount of BACE1 protein in cerebellum, olfactory bulb, hippocampus, and cortex tissue extracts (n = 7 for each brain region) relative to a standard curve of BACE1 expression using a fluorescence imager to capture chemiluminescent signal. Human BACE1 expressed in olfactory bulb is significantly higher than cortex, hippocampus, and cerebellum (ANOVA, p value < 0.001); while cortical BACE1 expression is significantly higher than hippocampus (ANOVA, p value < 0.05) and cerebellum (ANOVA, p value < 0.001).
To examine whether the level of human BACE1 expression in different brain regions might be responsible for the altered pattern of Aβ deposition, we analyzed the amount of human BACE1 protein expression by Western blot. To quantify the relative amount of BACE1 protein expression in brain regions at 12 months of age, we compared brain region extracts from BACE1 and Tg2576 transgenic mice to a standard curve of transgenic protein amounts. Similar to the pattern observed from BACE1 immunohistochemistry at young ages (Fig. 3), we determined that olfactory bulb BACE1 expression in the aged transgenic mice is significantly higher than BACE1 expression in the cortex, hippocampus, and cerebellum (one-way ANOVA, p value < 0.001) (Fig. 6C). Cortical BACE1 expression is significantly elevated compared with hippocampal and cerebellar BACE1 expression (ANOVA, p value < 0.05 and p value < 0.001, respectively). Thus, the increase in Aβ production and deposition within the olfactory bulb and cortical layers of double transgenics is correlated with elevated levels of BACE1 expression in the olfactory-cortical brain regions.
DISCUSSION
The identification of BACE1 has paved the way for a better understanding of the function of β-secretase, a protein long to be considered one of the major players involved in the development of Alzheimer’s disease neuropathology. Previous findings in cell culture have demonstrated how BACE1 alters the APP processing pathway, resulting in significantly increased levels of Aβ peptides (4, 10, 11). Complete elimination of Aβ peptides in Bace1 knockout mice indicates BACE1 is the primary β-secretase involved in generation of Aβ (5, 16, 17), demonstrating the significance of using β-secretase as a potential therapeutic target for Alzheimer’s disease.
The genetic significance for BACE1 in human AD remains elusive. While several studies have reported no significant linkage of BACE1 with Alzheimer’s disease (33, 34), only weak associations have been identified for several polymorphisms in the BACE1 gene (35). More recently, Gold et al. (36) report a significant association of a BACE1 polymorphism for late-onset Alzheimer disease in Apolipoprotein ∈4 carriers. Another group (37) found a significant association in exon 5 of BACE1 in AD subjects, even in individuals not carrying the ∈4 allele of apolipoprotein E gene. While a clear genetic association of BACE1 with Alzheimer’s disease has yet to be confirmed, BACE1 is hypothesized to play a major role in AD pathogenesis.
Transgenic studies will provide insight into the role of BACE1 in AD pathology. Utilizing a cDNA-based approach, two transgenic models have been developed for BACE1, finding that overexpression of BACE1 in neurons increases the steady-state levels of Aβ peptides (38) and can accelerate amyloid deposition (39). This approach makes several assumptions by using a heterologous promoter, which drives expression in a specific temporal and spatial pattern. In the current study, we have utilized a genomic-based approach to generate human BACE1 transgenics with genomic clones corresponding to the entire human BACE1 gene. A genomic-based approach makes fewer assumptions in vivo because BACE1 is under the control of its native regulatory elements and contains its native transcriptional and translational machinery because of the presence of genomic sequence. This approach ensures proper spatial and temporal expression allowing accurate assessment of the role of BACE1 in Aβ production and AD pathology.
Here, we demonstrate that genomic-based human BACE1 transgenic animals express elevated levels of human BACE1 mRNA and protein. We observe that BACE1 expression is localized primarily to olfactory bulb neurons, cortical layers, and hippocampal formation, matching the regional distribution of APP (40, 41). When crossed to human mutant APP transgenics, the BACE1 and APP double transgenics exhibit increased levels of APP C-terminal fragments and corresponding Aβ peptides as early as two months of age, indicating that modulation of BACE1 activity alters the APP processing pathway in vivo. These results are consistent with the other BACE1 transgenics previously described (38, 39).
Most notably, we report, for the first time, that human BACE1 and human APP transgenic animals exhibit an altered Aβ plaque deposition profile. We do not observe accelerated amyloid pathology as reported by Mohajeri et al., rather we observe dramatic increases of amyloid deposition at the previously reported age of 12 months (32). Not only are Aβ deposits significantly increased relative to controls, but the human BACE1 and human APP double transgenics exhibit a unique brain-regional deposition profile. We report increased cortical Aβ deposits upon BACE1 overexpression, while hippocampal deposits are not significantly elevated. This unique deposition pattern is corroborated by the profile of Aβ production across brain regions in the aged APP and BACE1 double transgenics. In particular, soluble and insoluble Aβ is dramatically increased in the cortex and olfactory bulb, while hippocampal Aβ is increased only in the insoluble fractions, presumably as amyloid deposits begin to accumulate in the hippocampus. Increasing evidence suggests that the equilibrium between soluble and insoluble Aβ peptides in the brain reflects the progression of AD-like pathogenesis (42). Based on our studies, human BACE1 overexpression appears to trigger a switch from elevated hippocampal Aβ production and deposition normally observed in mutant APP transgenics (Tg2576) (32) to increased cortical Aβ production and deposition, suggesting BACE1 overexpression may control the brain-regional deposition pattern and AD-like neuropathology. Our studies provide functional evidence for the potential significance of BACE1 in AD pathogenesis.
Based on clinical human studies, the development of AD neuropathology progresses in a distinct pattern, which correlates with age and severity of the disease (3). This pattern is characterized by initial amyloid deposition in neocortical regions of the AD brain followed by spread of deposition to the hippocampus and all cortical areas (3). Numerous factors likely control the progression of amyloid deposition within the AD brain.
While it remains unclear how brain-regional amyloid deposition occurs within the AD brain, several studies suggest that one of the controlling factors could be the expression and activity of the major players involved in APP processing and Aβ generation. Based on studies by Lehman et al. (43), the abundance of APP holoprotein and the APP processing products varies by brain region in the Tg2576 APP transgenics. Both CTF-β, the precursor to Aβ, as well as Aβ itself are higher in the hippocampus relative to cortex, olfactory bulb, and cerebellum in these animals (43). Furthermore, the level of mRNA expression for BACE1, the primary β-secretase, in Tg2576 transgenics is brain-region specific, with highest levels in the hippocampus, dentate gyrus, and cerebellar molecular layer (41). These findings differ, however, with the studies of Zohar et al. (44) in which the levels of BACE1 mRNA are higher in the frontal cortex relative to hippocampus in normal rat and human brain.
In our human BACE1 and mutant APP double transgenics, the unique cortical-specific deposition profile is reflective of elevated BACE1 expression in the olfactory bulb and cortex relative to other brain regions, particularly cerebellum and hippocampus. The relationship of up-regulated BACE1 protein expression and AD is consistent with previous findings, which report increased neocortical BACE1 expression and activity in the AD brain (13, 23) and is correlated with Aβ load in AD (45). Particularly noteworthy is the high level of BACE1 expression in the olfactory bulb accompanied by significantly elevated levels of soluble and insoluble Aβ peptides. Olfactory deficits have long thought to be an early marker for cognitive decline in AD patient populations (46-48). In recent years, several groups have identified AD pathologic changes in olfactory structures in early stages of AD (49, 50). Furthermore, these pathologic changes in the olfactory system are associated with the increasing severity of cortical pathology (49, 50). Based on olfactory bulb anatomy, it is well known that olfactory neurons project to the entorhinal cortex, which is a component of the hippocampal formation, and indirectly to the frontal cortex (51). This is particularly the case in the rodent brain in which small areas of the cortex receive afferents from the olfactory bulb (52). In addition, recent evidence that BACE1 and APP are axonally transported through nerve terminals in the brain indicates that Aβ production and deposition is a dynamic process (53, 54), resulting in the selective disruption of neuronal connections in which cortico-cortical circuits are most vulnerable (55). These findings together with the neurobiology of the olfactory system could help to explain our studies in which the brain regions with highest BACE1 expression, the olfactory bulb and cortex, affect such a dramatic elevation in Aβ production and deposition.
Our findings indicate that the level of expression and activity of the major player in Aβ generation, BACE1, may be a major factor in the regional pattern of Aβ deposition. These studies demonstrate that BACE1 alters the APP processing pathway and directly impacts the development of AD pathology in vivo. Further studies will examine both the expression of BACE1 as well as the production of Aβ in specific brain regions for the human BACE1 and APP double transgenics across a variety of ages from young to old. These experiments are critical to further understand the relationship between Aβ metabolism and the deposition of Aβ throughout the brain.
Acknowledgments
We thank S. Gandy for the generous gift of the 369 antibody and R. Yan for the generous gift of B279 antibody. We would also like to thank Nicholas Varvel (CWRU) for his help in preparing cryosections for immunohistochemistry.
Footnotes
This work was supported by National Institutes of Health Grant AG14451, an Alzheimer’s Association grant, and an American Health Assistance Foundation Grant (to B. T. L.) as well as support from the University Alzheimer Center (AG08012) and the Ireland Cancer Center (CA43703). The costs of publication of this article were defrayed in part by the payment of page charges. This article must therefore be hereby marked “advertisement” in accordance with 18 U.S.C. Section 1734 solely to indicate this fact.
- AD
- Alzheimer’s Disease
- Aβ
- amy-loid-β
- CHAPS
- 3-[(3-cholamidopropyl)dimethylammonio]-1-propanesulfonic acid
- ELISA
- enzyme-linked immunosorbent assay
- ANOVA
- analysis of variance
- CTF
- C-terminal fragment
- APP
- amyloid precursor protein
REFERENCES
- 1.Tanzi RE. J. Clin. Investig. 1999;104:1175–1179. doi: 10.1172/JCI8593. [DOI] [PMC free article] [PubMed] [Google Scholar]
- 2.Glenner GG, Wong CW. Biochem. Biophys. Res. Commun. 1984;120:885–890. doi: 10.1016/s0006-291x(84)80190-4. [DOI] [PubMed] [Google Scholar]
- 3.Braak H, Braak E. Neurobiol. Aging. 1997;18:351–357. doi: 10.1016/s0197-4580(97)00056-0. [DOI] [PubMed] [Google Scholar]
- 4.Vassar R, Bennett BD, Babu-Khan S, Kahn S, Mendiaz EA, Denis P, Teplow DB, Ross S, Amarante P, Loeloff R, Luo Y, Fisher S, Fuller J, Edenson S, Lile J, Jarosinski MA, Biere AL, Curran E, Burgess T, Louis JC, Collins F, Treanor J, Rogers G, Citron M. Science. 1999;286:735–741. doi: 10.1126/science.286.5440.735. [DOI] [PubMed] [Google Scholar]
- 5.Cai H, Wang Y, McCarthy D, Wen H, Borchelt DR, Price DL, Wong PC. Nat. Neurosci. 2001;4:233–234. doi: 10.1038/85064. [DOI] [PubMed] [Google Scholar]
- 6.Selkoe DJ. Nature. 1999;399:A23–31. doi: 10.1038/399a023. [DOI] [PubMed] [Google Scholar]
- 7.Mullan M, Crawford F, Axelman K, Houlden H, Lilius L, Winblad B, Lannfelt L. Nat. Genet. 1992;1:345–347. doi: 10.1038/ng0892-345. [DOI] [PubMed] [Google Scholar]
- 8.Citron M, Oltersdorf T, Haass C, McConlogue L, Hung AY, Seubert P, Vigo-Pelfrey C, Lieberburg I, Selkoe DJ. Nature. 1992;360:672–674. doi: 10.1038/360672a0. [DOI] [PubMed] [Google Scholar]
- 9.Lamb BT, Call LM, Slunt HH, Bardel KA, Lawler AM, Eckman CB, Younkin SG, Holtz G, Wagner SL, Price DL, Sisodia SS, Gearhart JD. Hum. Mol. Genet. 1997;6:1535–1541. doi: 10.1093/hmg/6.9.1535. [DOI] [PubMed] [Google Scholar]
- 10.Yan R, Bienkowski MJ, Shuck ME, Miao H, Tory MC, Pauley AM, Brashler JR, Stratman NC, Mathews WR, Buhl AE, Carter DB, Tomasselli AG, Parodi LA, Heinrikson RL, Gurney ME. Nature. 1999;402:533–537. doi: 10.1038/990107. [DOI] [PubMed] [Google Scholar]
- 11.Sinha S, Anderson JP, Barbour R, Basi GS, Caccavello R, Davis D, Doan M, Dovey HF, Frigon N, Hong J, Jacobson-Croak K, Jewett N, Keim P, Knops J, Lieberburg I, Power M, Tan H, Tatsuno G, Tung J, Schenk D, Seubert P, Suomensaari SM, Wang S, Walker D, Zhao J, McConlogue L, John V. Nature. 1999;402:537–540. doi: 10.1038/990114. [DOI] [PubMed] [Google Scholar]
- 12.Hussain I, Powell D, Howlett DR, Tew DG, Meek TD, Chapman C, Gloger IS, Murphy KE, Southan CD, Ryan DM, Smith TS, Simmons DL, Walsh FS, Dingwall C, Christie G. Mol. Cell Neurosci. 1999;14:419–427. doi: 10.1006/mcne.1999.0811. [DOI] [PubMed] [Google Scholar]
- 13.Fukumoto H, Cheung BS, Hyman BT, Irizarry MC. Arch. Neurol. 2002;59:1381–1389. doi: 10.1001/archneur.59.9.1381. [DOI] [PubMed] [Google Scholar]
- 14.Sun A, Koelsch G, Tang J, Bing G. Exp. Neurol. 2002;175:10–22. doi: 10.1006/exnr.2002.7875. [DOI] [PubMed] [Google Scholar]
- 15.Yang LB, Lindholm K, Yan R, Citron M, Xia W, Yang XL, Beach T, Sue L, Wong P, Price D, Li R, Shen Y. Nat. Med. 2003;9:3–4. doi: 10.1038/nm0103-3. [DOI] [PubMed] [Google Scholar]
- 16.Roberds SL, Anderson J, Basi G, Bienkowski MJ, Branstetter DG, Chen KS, Freedman SB, Frigon NL, Games D, Hu K, Johnson-Wood K, Kappenman KE, Kawabe TT, Kola I, Kuehn R, Lee M, Liu W, Motter R, Nichols NF, Power M, Robertson DW, Schenk D, Schoor M, Shopp GM, Shuck ME, Sinha S, Svensson KA, Tatsuno G, Tintrup H, Wijsman J, Wright S, McConlogue L. Hum. Mol. Genet. 2001;10:1317–1324. doi: 10.1093/hmg/10.12.1317. [DOI] [PubMed] [Google Scholar]
- 17.Luo Y, Bolon B, Kahn S, Bennett BD, Babu-Khan S, Denis P, Fan W, Kha H, Zhang J, Gong Y, Martin L, Louis JC, Yan Q, Richards WG, Citron M, Vassar R. Nat. Neurosci. 2001;4:231–232. doi: 10.1038/85059. [DOI] [PubMed] [Google Scholar]
- 18.Yang XW, Model P, Heintz N. Nat. Biotechnol. 1997;15:859–865. doi: 10.1038/nbt0997-859. [DOI] [PubMed] [Google Scholar]
- 19.Hogan B, Beddington R, Constantini F, Lacy E. Manipulating the Mouse Embryo. 2nd Ed. Cold Spring Harbor Laboratory Press; Cold Spring Harbor: 1994. pp. 217–251. [Google Scholar]
- 20.Miller SA, Dykes DD, Polesky HF. Nucleic Acids Res. 1988;16:1215. doi: 10.1093/nar/16.3.1215. [DOI] [PMC free article] [PubMed] [Google Scholar]
- 21.Sambrook JR, David W. In: Molecular Cloning: A Laboratory Manual. Third Edition Ed. Argentine J, editor. Vol. 1. Cold Spring Harbor Laboratory Press; Cold Spring Harbor, New York: 2001. pp. 23–64. [Google Scholar]
- 22.Lamb BT, Sisodia SS, Lawler AM, Slunt HH, Kitt CA, Kearns WG, Pearson PL, Price DL, Gearhart JD. Nat. Genet. 1993;5:22–30. doi: 10.1038/ng0993-22. [DOI] [PubMed] [Google Scholar]
- 23.Holsinger RM, McLean CA, Beyreuther K, Masters CL, Evin G. Ann. Neurol. 2002;51:783–786. doi: 10.1002/ana.10208. [DOI] [PubMed] [Google Scholar]
- 24.DeMattos RB, O’Dell M A, Parsadanian M, Taylor JW, Harmony JA, Bales KR, Paul SM, Aronow BJ, Holtzman DM. Proc. Natl. Acad. Sci. U. S. A. 2002;99:10843–10848. doi: 10.1073/pnas.162228299. [DOI] [PMC free article] [PubMed] [Google Scholar]
- 25.Johnson-Wood K, Lee M, Motter R, Hu K, Gordon G, Barbour R, Khan K, Gordon M, Tan H, Games D, Lieberburg I, Schenk D, Seubert P, McConlogue L. Proc. Natl. Acad. Sci. U. S. A. 1997;94:1550–1555. doi: 10.1073/pnas.94.4.1550. [DOI] [PMC free article] [PubMed] [Google Scholar]
- 26.Suzuki N, Cheung TT, Cai XD, Odaka A, Otvos L, Jr., Eckman C, Golde TE, Younkin SG. Science. 1994;264:1336–1340. doi: 10.1126/science.8191290. [DOI] [PubMed] [Google Scholar]
- 27.Kulnane LS, Lamb BT. Neurobiol. Dis. 2001;8:982–992. doi: 10.1006/nbdi.2001.0446. [DOI] [PubMed] [Google Scholar]
- 28.Yan R, Han P, Miao H, Greengard P, Xu H. J. Biol. Chem. 2001;276:36788–36796. doi: 10.1074/jbc.M104350200. [DOI] [PubMed] [Google Scholar]
- 29.Paxinos GF, Keith BJ. The Mouse Brain in Stereotaxic Coordinates. 2nd Ed. Academic Press; San Diego: 2001. pp. 108–121. [Google Scholar]
- 30.Saunders AJ, Kim T-W, Tanzi RE. Science. 1999;286:1255a. [Google Scholar]
- 31.Kinoshita A, Fukumoto H, Shah T, Whelan CM, Irizarry MC, Hyman BT. J. Cell Sci. 2003;116:3339–3346. doi: 10.1242/jcs.00643. [DOI] [PubMed] [Google Scholar]
- 32.Hsiao K, Chapman P, Nilsen S, Eckman C, Harigaya Y, S. Y, Yang F, Cole G. Science. 1996;274:99–102. doi: 10.1126/science.274.5284.99. [DOI] [PubMed] [Google Scholar]
- 33.Liu HC, Leu SJ, Chang JG, Sung SM, Hsu WC, Lee LS, Hu CJ. Brain Res. 2003;961:88–91. doi: 10.1016/s0006-8993(02)03849-0. [DOI] [PubMed] [Google Scholar]
- 34.Nicolaou M, Song YQ, Sato CA, Orlacchio A, Kawarai T, Medeiros H, Liang Y, Sorbi S, Richard E, Rogaev EI, Moliaka Y, Bruni AC, Jorge R, Percy M, Duara R, Farrer LA, St Georg-Hyslop P, Rogaeva EA. Neurogenetics. 2001;3:203–206. doi: 10.1007/s100480100123. [DOI] [PubMed] [Google Scholar]
- 35.Nowotny P, Kwon JM, Chakraverty S, Nowotny V, Morris JC, Goate AM. Neuroreport. 2001;12:1799–1802. doi: 10.1097/00001756-200107030-00008. [DOI] [PubMed] [Google Scholar]
- 36.Gold G, Blouin JL, Herrmann FR, Michon A, Mulligan R, Duriaux Sail G, Bouras C, Giannakopoulos P, Antonarakis SE. Am. J. Med. Genet. 2003;119B:44–47. doi: 10.1002/ajmg.b.10010. [DOI] [PubMed] [Google Scholar]
- 37.Clarimon J, Bertranpetit J, Calafell F, Boada M, Tarraga L, Comas D. J. Neurol. 2003;250:956–961. doi: 10.1007/s00415-003-1127-8. [DOI] [PubMed] [Google Scholar]
- 38.Bodendorf U, Danner S, Fischer F, Stefani M, Sturchler-Pierrat C, Wiederhold KH, Staufenbiel M, Paganetti P. J. Neurochem. 2002;80:799–806. doi: 10.1046/j.0022-3042.2002.00770.x. [DOI] [PubMed] [Google Scholar]
- 39.Mohajeri MH, Saini KD, Nitsch RM. J. Neural. Transm. 2004;111:413–425. doi: 10.1007/s00702-003-0057-z. [DOI] [PubMed] [Google Scholar]
- 40.Marcinkiewicz M, Seidah NG. J. Neurochem. 2000;75:2133–2143. doi: 10.1046/j.1471-4159.2000.0752133.x. [DOI] [PubMed] [Google Scholar]
- 41.Irizarry MC, Locascio JJ, Hyman BT. Am. J. Pathol. 2001;158:173–177. doi: 10.1016/s0002-9440(10)63955-7. [DOI] [PMC free article] [PubMed] [Google Scholar]
- 42.Kawarabayashi T, Younkin LH, Saido TC, Shoji M, Ashe KH, Younkin SG. J. Neurosci. 2001;21:372–381. doi: 10.1523/JNEUROSCI.21-02-00372.2001. [DOI] [PMC free article] [PubMed] [Google Scholar]
- 43.Lehman EJ, Kulnane LS, Lamb BT. Neurobiol. Aging. 2003;24:645–653. doi: 10.1016/s0197-4580(02)00153-7. [DOI] [PubMed] [Google Scholar]
- 44.Zohar O, Cavallaro S, D’Agata V, Alkon DL. Brain Res. Mol. Brain Res. 2003;115:63–68. doi: 10.1016/s0169-328x(03)00182-7. [DOI] [PubMed] [Google Scholar]
- 45.Li R, Lindholm K, Yang LB, Yue X, Citron M, Yan R, Beach T, Sue L, Sabbagh M, Cai H, Wong P, Price D, Shen Y. Proc. Natl. Acad. Sci. U. S. A. 2004;101:3632–3637. doi: 10.1073/pnas.0205689101. [DOI] [PMC free article] [PubMed] [Google Scholar]
- 46.Doty RL, Reyes PF, Gregor T. Brain Res. Bull. 1987;18:597–600. doi: 10.1016/0361-9230(87)90129-8. [DOI] [PubMed] [Google Scholar]
- 47.Serby M, Larson P, Kalkstein D. Am. J. Psychiatry. 1991;148:357–360. doi: 10.1176/ajp.148.3.357. [DOI] [PubMed] [Google Scholar]
- 48.Serby M, Mohan C, Aryan M, Williams L, Mohs RC, Davis KL. Biol. Psych. 1996;39:375–377. doi: 10.1016/0006-3223(95)00472-6. [DOI] [PubMed] [Google Scholar]
- 49.Christen-Zaech S, Kraftsik R, Pillevuit O, Kiraly M, Martins R, Khalili K, Miklossy J. Can. J. Neurol. Sci. 2003;30:20–25. doi: 10.1017/s0317167100002389. [DOI] [PubMed] [Google Scholar]
- 50.Kovacs T, Cairns NJ, Lantos PL. Neuroreport. 2001;12:285–288. doi: 10.1097/00001756-200102120-00021. [DOI] [PubMed] [Google Scholar]
- 51.Kandel ER, Schwartz JH, Jessel TM, editors. Principles of Neural Science. 4th Ed. McGraw-Hill; New York: 2000. pp. 625–647. [Google Scholar]
- 52.Kovacs T. Ageing Res. Rev. 2004;3:215–232. doi: 10.1016/j.arr.2003.10.003. [DOI] [PubMed] [Google Scholar]
- 53.Sheng JG, Price DL, Koliatsos VE. Exp. Neurol. 2003;184:1053–1057. doi: 10.1016/j.expneurol.2003.08.018. [DOI] [PubMed] [Google Scholar]
- 54.Kamal A, Almenar-Queralt A, LeBlanc JF, Roberts EA, Goldstein LS. Nature. 2001;414:643–648. doi: 10.1038/414643a. [DOI] [PubMed] [Google Scholar]
- 55.Delatour B, Blanchard V, Pradier L, Duyckaerts C. Neurobiol. Dis. 2004;16:41–47. doi: 10.1016/j.nbd.2004.01.008. [DOI] [PubMed] [Google Scholar]