Abstract
PURPOSE
To qualitatively compare the nonpolar lipids present in meibomian gland (MG) secretions (samples T1) with aqueous tears (AT) collected from the lower tear menisci of healthy, non-dry eye volunteers using either glass microcapillaries (samples T2) or Schirmer test strips (samples T3).
METHODS
Samples T1 to T3 were analyzed with the use of high-pressure liquid chromatography/positive ion mode atmospheric pressure chemical ionization mass spectrometry. Where possible, the unknown lipids were compared with known standards.
RESULTS
Samples T1 had the simplest lipid composition among all the tested specimens. Samples T2 and T3 were similar to each other but were noticeably different from samples T1. In addition to all the compounds detected in samples T1, lower molecular weight wax esters and other compounds were found in samples T2 and T3. No appreciable amounts of fatty acid amides (e.g., oleamide), ceramides, or monoacyl glycerols were routinely detected. The occasionally observed minor signals of oleamide (m/z 282) in samples T3 were attributed to the contamination of the samples with common plasticizers routinely found in plastic ware extractives and organic solvents.
CONCLUSIONS
The MG is a prominent source of lipids for the tear film. However, it would have been a mistake to exclude from consideration other likely sources of lipids such as conjunctiva, cornea, and tears produced by the lacrimal glands. These data showed that lipids in AT are more complex than MG secretions, which necessitates more cautious interpretation of the functions of the latter in the tear film.
Human tears are an extremely complex mixture of lipids, carbohydrates, proteins, peptides, salts, and other low-and high-molecular-weight compounds. Watery secretions known as aqueous tears (AT) are produced by lacrimal glands and are secreted onto the ocular surface through lacrimal ducts to form the bulk of the tear film (TF). The meibomian glands (MG) located on the margins of eyelids produce oily lipid secretions (MGs) that, after being mixed with the AT, also contribute to the TF. MGs are believed to form what is known as the tear film lipid layer (TFLL).1–3 The TFLL lies on top of the TF in immediate contact with the surrounding air. The MGs have been proposed to be critical for maintaining the structural integrity of the TFLL3 and its ability to protect the ocular surface from losing water because of evaporation of the TF.4 Among other sources that contribute to the TF and the TFLL are conjunctiva, cornea, and Harderian glands (in animals). It has been reported that complex alterations of the TFLL chemical composition are associated with a widespread pathologic condition (or disease) commonly known as dry eye (DE).5–7 DE affects millions of people, ranging—depending on the severity of condition—from 0.5% of the general population8 to more than 30%,9; most are elderly, women, and those who live in adverse climates. Therefore, finding correlations between the lipid composition of the MGs and the development of DE has been the focus of attention of DE researchers for decades. Surprisingly, comprehensive lipidomic analyses of the AT and the TFLL have not been completed, and no direct experiments have been conducted to verify the proposed structures of the TF and TFLL. Considering the very small amounts of material that can be collected from an individual human eye without harming the donor (a few microliters of the AT10 and 1 mg or less of the MGs11,12), the diversity of lipid species found in humans,3,13–16 and the complexities of qualitative and quantitative lipidomic analyses, full evaluation of such samples is a formidable task. To verify earlier reports on the lipid composition of human MGs, the latter have been recently revisited by using high-pressure liquid chromatographyion trap mass spectrometry (HPLC-MS).11,12 To our surprise, the overall lipid composition human normal MGs in humans was different from the one reported in earlier publications.5–7,15–17 To find the possible sources of so obvious a discrepancy and to characterize MGs and AT side by side, in this study we collected and analyzed three different types of samples related to the TF: regular MGs obtained directly from the MG by extruding the content onto a metal spatula, AT collected from the lower tear meniscus with microcapillaries, and lipid material extracted from Schirmer test strips after standard tests for tear production. Results of these comparative studies and discussion of their possible consequences are presented below.
MATERIALS AND METHODS
Materials and Reagents
Lipid standards were purchased from Nu-Chek Prep, Inc. (Elysian, MN) and Avanti Polar Lipids (Alabaster, AL). Other reagents were from Sigma-Aldrich (St. Louis, MO). HPLC-grade solvents were products of Burdick & Jackson (Muskegon, MI). Mass spectra were captured on an ion trap spectrometer (LCQ Deca XP Max MSn; Thermo Fisher Scientific, Waltham, MA) using data system software (Xcalibur; Thermo Fisher Scientific). Chromatographic experiments were performed on a Waters HPLC system (Alliance 2695 HPLC Separations Module; Waters Corp., Milford, MA) interfaced to the mass spectrometer. Melting ranges of lipids were determined with a melting point apparatus (Optimelt MPA100; Stanford Research Systems, Sunnyvale, CA). Fire-polished glass microcapillaries, manufactured by Baxter Healthcare Corp. (Deerfield, IL) and standardized Schirmer tear test strips (Alcon Laboratories, Inc., Fort Worth, TX) were used to collect tears.
Sample Collection
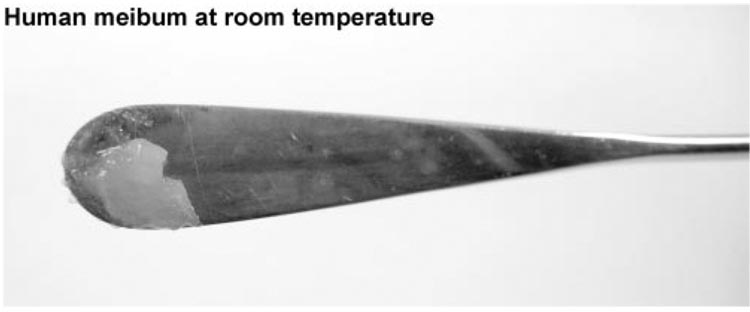
The study was approved by the University of Texas Southwestern Medical Center Institutional Review Board and was conducted according to the Declaration of Helsinki. Signed consent forms were obtained from participating volunteers. Three different types of samples were analyzed: MGs collected from five donors (three females, two males; median age, 47 years) by squeezing their eyelids, as described earlier11,12 to give samples called T1; tears collected from lower menisci with the help of microcapillaries (three samples called T2; all three from males; median age, 51 years); and tear material absorbed by Schirmer test strips during standard aqueous tear production tests (seven samples called T3; three females, four males; median age, 45 years). For comparison, individual lipid standards and their mixtures were analyzed along with human samples T1, T2, and T3. In this initial study, the human samples were not to represent any particular group of general population, and no conclusion about possible effects of sex, age, type of diet, or other factors were to be made at this time. Samples T1, collected from the upper and lower eyelids of a volunteer, were pooled and analyzed as a whole (Fig. 1). The average amount of the combined sample T1 was approximately 0.7 mg (dry weight; four eyelids; one donor). The dry sample T1 had an appearance of an off-white to yellowish wax. The microcapillary technique yielded up to10 µL of sample T2 per eye per patient, though several aliquots of tears had to be collected within an approximately 10-minute interval to achieve this goal. Samples of all types were expected to contain, in addition to lipids, variable amounts of more polar materials, such as proteins, peptides, amino acids, carbohydrates, and salts. To preserve the integrity of the lipid mixtures in the samples, no attempts were made to remove polar components before the lipidomic analyses by, for example, using solid-phase or liquid-liquid extraction. Given that lipids are typically extracted from biological materials with chloroform/methanol solvent mixtures (see, for example, the Folch method18), they were expected to be effectively solubilized in such a solvent. Therefore, samples T1 were dissolved in a chloroform/ methanol (CM) 2:1 (vol/vol) solvent mixture and were analyzed as is or after replacement of the CM solvent with an n-hexane/ propan-2-ol (HP) 1:1 (vol/vol) solvent mixture. The latter was found to be better suited for normal-phase (NP) HPLC experiments. Depending on the experiment to be conducted, samples T1 were dissolved to produce approximately 50 µg dry weight/mL stock solution in the HP solvent or, depending on the size of the sample, 500 to 2000 µg dry weight/mL stock solution in the CM solvent.
Figure 1.
Human meibomian gland secretions (approximately 1 mg) at room temperature.
Samples T2, collected from the two lower tear menisci of a volunteer, were also pooled during the collection. To remove water, the samples were initially dissolved in the CM solvent, evaporated to dryness under a stream of nitrogen, and redissolved in 1 mL of the same CM solvent. Some insoluble material was routinely observed in such samples and was attributed to various polar components found in the AT (mostly peptides, proteins, carbohydrates, and salts). The sediment could be easily removed by gentle centrifugation of the vials.
Samples T3 were prepared by extracting the whole Schirmer test strips three times with 2 mL CM solvent for approximately 15 minutes. Then the combined extracts were brought to dryness under a stream of nitrogen, and the oily or waxy residue was redissolved in the CM solvent or the HP solvent. Two Schirmer test strips (one per each patient’s eye) were extracted together and analyzed as such.
Melting Ranges of Human Meibum and Lipid Standards
The following protocol has been used to measure the melting range of lipid samples. A melting point apparatus (Optimelt MPA100; Stanford Research Systems) with 90 mm × 1 mm sample tubes was used. A lipid sample (≥1 mg dry weight) dissolved in a minimally possible volume of the MC or HP solvent was transferred to the sample tube with the help of an HPLC syringe equipped with a 15-cm needle. The solvent was evaporated in a vacuum manifold at room temperature to produce a solid lipid layer on the bottom of the tube (1–2 mm thick). If necessary, the sample solution was added in a few increments. Part of the sample that precipitated on the tube walls during the procedure was washed down the tube with a minimal amount of chloroform, n-hexane, or both, and the solvent was carefully evaporated to dryness again. Then the sample was placed in the melting apparatus and analyzed according to the manufacturer’s recommendations. The sample was equilibrated at the lowest possible temperature (approximately 26°C), and the temperature was raised to approximately 45°C at 0.5°C to 2°C/min. The intensity of the light reflected from the sample depended on its physical state: the more solid the sample, the higher the reflectance. When the sample was completely melted, its reflectance was minimal. The reflectance was continuously measured and recorded using the built-in detector (Optimelt; Stanford Research Systems) and a video camera. Data were analyzed with automated melting point system software (SRS Optimelt V. 1.072; Stanford Research Systems). Three individual samples collected from healthy subjects were studied. Measurements were repeated to ensure that repetitive melting did not affect the results.
A similar protocol was used to melt standard lipids ranging from 25°C to 60°C in temperature. When a sufficient amount of a lipid to be tested was available, a traditional dry packing method was used to pack the sample tube.
Individual Lipid Standards and Lipid Mixtures
Series of nonpolar and polar lipids were analyzed by HPLC-MS individually and as mixtures. Where applicable, these authentic lipids and their mixtures were used to create standard (dose-signal) curves.
A standard nonpolar lipid mixture (sample NPL) was composed of stearyl stearate (SS), tripalmitin (TP), cholesteryl oleate (Chl-O), and free cholesterol (Chl), a mixture of 1,2- and 1,3-diarachidin (DA), and C18-ceramide (C18-Cer) and C24-Cer. Each of the standard lipids was present at 1 µg/mL in solvent HP. To account for possible impurities, control experiments were conducted in which 10-mL aliquots of solvent HP or solvent CM were evaporated to dryness, and the residues were reconstituted in 1 mL of the starting solvents. Reconstituted samples were chromatographed as usual (injection volume 10–20 µL), and the solvent peaks were subtracted from the experimental mass spectra. No major contaminations that would interfere with the lipidomic analyses were found using this approach.
Chromatography and Mass Spectrometry of Lipids
For the nonpolar lipid analyses, an HPLC column (3.2 × 150 mm, 5 µm; Lichrosphere Diol; Phenomenex, Torrance, CA) was used with n-hexane/propan-2-ol/glacial acetic acid (95:5:0.1, vol/vol/vol) as mobile phase (solvent HPA). Details of the HPLC and MS procedures were published elsewhere.11,12 Analytes were detected using an ion-trap mass spectrometer (LCQ Deca XP Max) equipped with an atmospheric pressure chemical ionization (APCI) ion source operating in the positive ion mode.
Retention time (RTs) and the intensities of the MS signals of the analytes found in samples T1, T2, and T3 were compared with those of known chemical standards in lipid mixture NPL. Under the conditions of general (observation) scans in the m/z range of 200 to 2000, the practical detection limit for known compounds was between 0.1 and 1 ng per injection.
RESULTS
Melting Range of the MGs
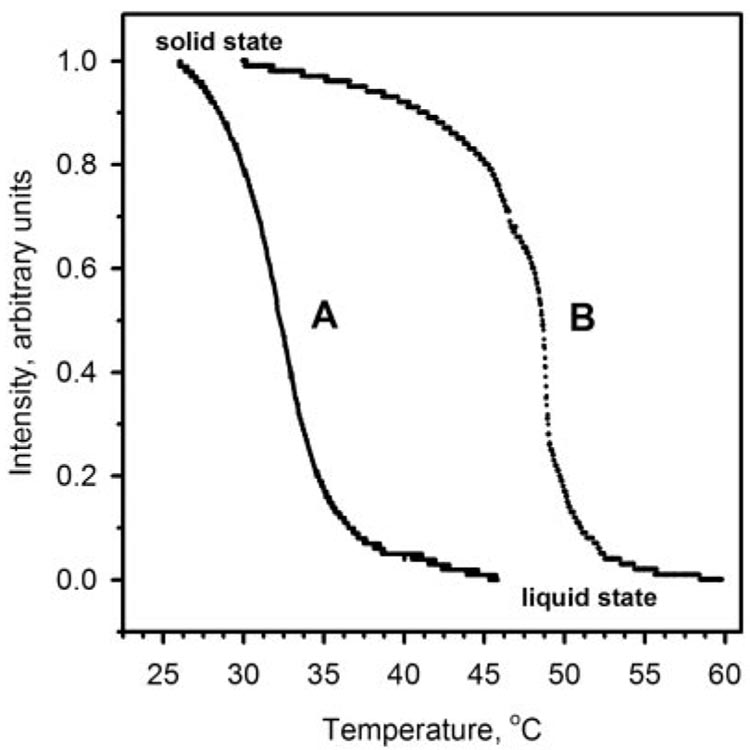
To determine the melting range of MGs, a semisolid waxy sample T1 (Fig. 1) was melted (Optimelt MPA100; Stanford Research Systems) in a capillary tube, as described. The reflectance of the sample was continuously measured and plotted as a function of temperature (Fig. 2). The reflectance of the initially solid, off-white sample gradually decreased with the increase in the temperature until the sample became a transparent liquid. The sample started to melt at room temperature and reached the clear point right at the normal body temperature of 36.5°C ± 1.0°C. The infliction point of the melting curve was determined at 32.5°C ± 1.0°C (mean ± SE; n = 3). The rate at which the samples were melted (0.5°C or 2°C) did not affect the measured melting range. The broad melting range at the relatively low temperatures was expected of a complex (lipid) mixture based on unsaturated wax esters (WE).11,12 (Note that a standard C16:0,18:1-phosphatidylcholine melted at a much higher temperature of approximately 48°C.)
Figure 2.
Melting curves of human meibomian gland secretions (A) and egg yolk phosphatidyl choline (B; mainly C16:0,C18:1 isomer).
Direct HPLC-MS Comparison of Human Tear Lipid Samples of Various Origins
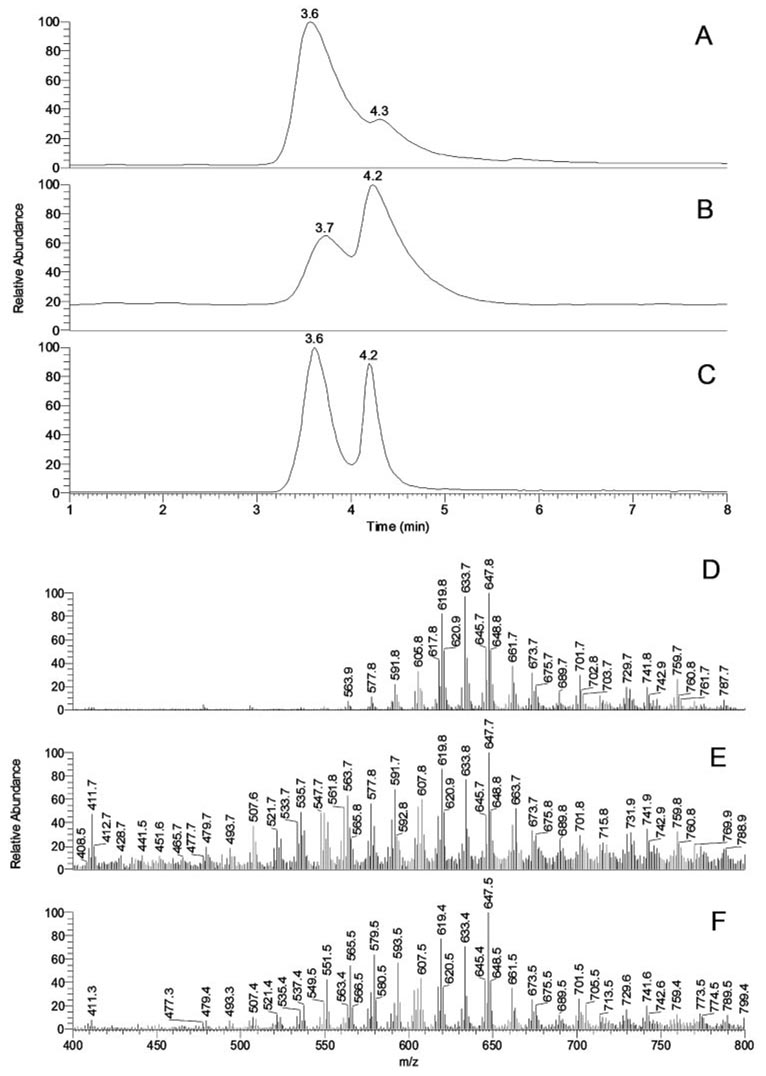
Three types of human tear lipid samples were analyzed side by side to determine whether they had similar or different lipid composition. Chromatographic patterns of samples T1 to T3 and their mass spectra are presented in Figure 3.
Figure 3.
Normal-phase HPLC and MS profiles of human meibomian gland secretions (T1) and aqueous tears (T2 and T3). (A) Total ion chromatogram of sample T1. (B) Total ion chromatogram of sample T2. (C) Total ion chromatogram of sample T3. (D) Combined MS profile of HPLC peaks with RT 3.6 and 4.3 minutes of sample T1. (E) Combined MS profile of HPLC peaks with RT 3.7 and 4.2 minutes of sample T2. (F) Combined MS profile of HPLC peaks with RT 3.6 and 4.2 minutes of sample T3.
Nonpolar lipid profiles of samples T1 (Figs. 3A, 3D) were identical with those described in our earlier reports on MGs.11,12 Only one major HPLC peak, detected with an RT of approximately 3.6 minutes, had a small shoulder with an RT of approximately 4.3 minutes Most of the individual lipid components in the peak had RTs between 3.5 and 3.7 minutes and m/z values identical with those described earlier; therefore, they were identified as oleic acid-based WE, cholesteryl esters (Chl-E), and, putatively, triacyl glycerol (TAG). Minute amounts of slower moving compounds with m/z 713, 729, 731, 739, 741, 759, and 787 (RT approximately 4.3 minutes) that formed the shoulder were also detected in these samples.
Among the three types of tested samples, samples T2 (Figs. 3B, 3E) were consistently the smallest in terms of their lipid content and had the lowest signal-to-noise ratio. Samples T2 were shown to have all the lipids found in samples T1. However, they clearly contained major components that were either not found in MGs or were present in low quantities. Samples T2 also had altered ratios of known lipids. These resulted in the formation of a second major HPLC peak with an RT of approximately 4.2 minutes (Fig. 3B) and a series of new MS peaks, mostly with m/z values between 400 and 600 (Fig. 3E).
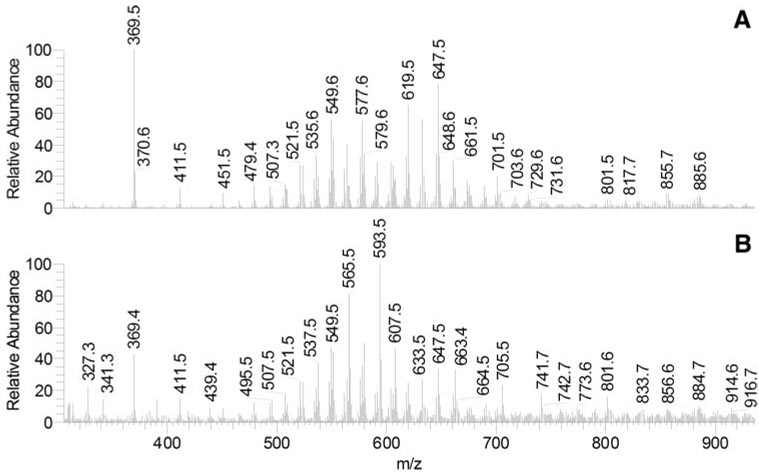
Schirmer test strips extracts (samples T3) were similar to the AT (sample T2) but were easier to analyze because they were larger, resulting in a better signal-to-noise ratio (Figs. 3C, 3F). To examine their major components, mass spectra of the two HPLC peaks were recorded and plotted separately (Fig. 4). The lipid composition of the HPLC peak RT of 3.6 minutes was similar to that of samples T1, whereas the peak RT of 4.2 minutes was different. In addition to having greater intensity than did samples T1, the peak RT of 4.2 minutes had a range of new components, among which there were ions with m/z 327 to 705 (Figs. 4A, 4B). These compounds had higher polarity than the nonpolar components of MGs and coeluted with authentic diacyl glycerol (DAG). Many of them were also detected in samples T2.
Figure 4.
Normal-phase HPLC-MS profiles of human aqueous (sample T3). (A) MS profile of HPLC peak with RT 3.6 minutes. (B) MS profile of HPLC peak with RT 4.2 minutes.
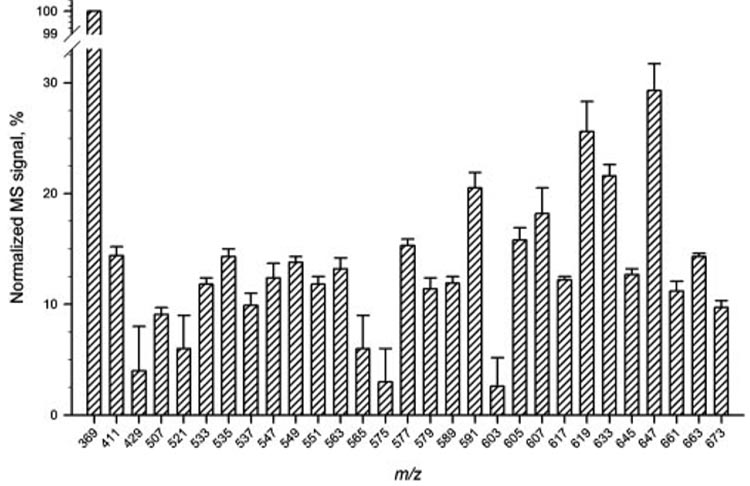
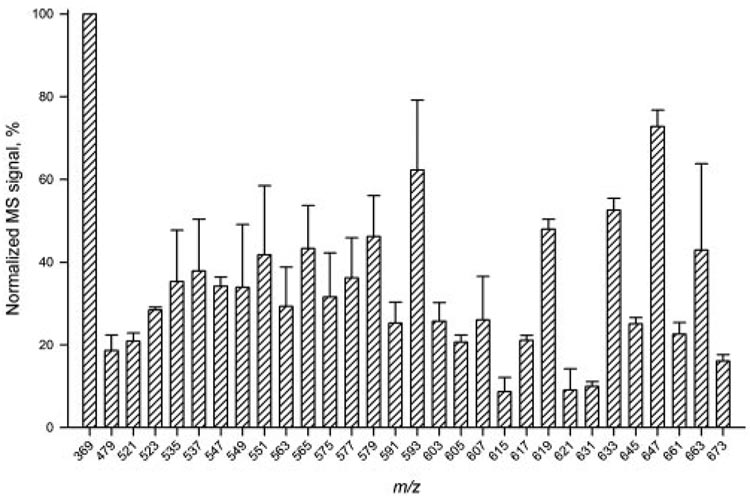
The reproducibility of the HPLC-APCI MS analyses was tested in several ways. First, one of the samples T2 was analyzed three times to check for the reproducibility of the results for approximately 30 of the most intense MS peaks (Fig. 5). Second, intersample variability was estimated for seven samples T3 (Fig. 6). Last, the detected m/z values of the analytes were checked and found to be reproducible within ±0.15 atomic mass units (amu; not shown).
Figure 5.
Reproducibility test for HPLC-APCI MS analysis of sample T2. Three sequential injections of the sample were made. Signals were normalized using the intensity of the cholesteryl signal (m/z 369) as 100%.
Figure 6.
HPLC-APCI MS intersample variability test for sample T3. Seven individual samples T3 were analyzed. Signals were normalized using the intensity of the cholesteryl signal (m/z 369) in each of the samples as 100%.
Lipid Standards
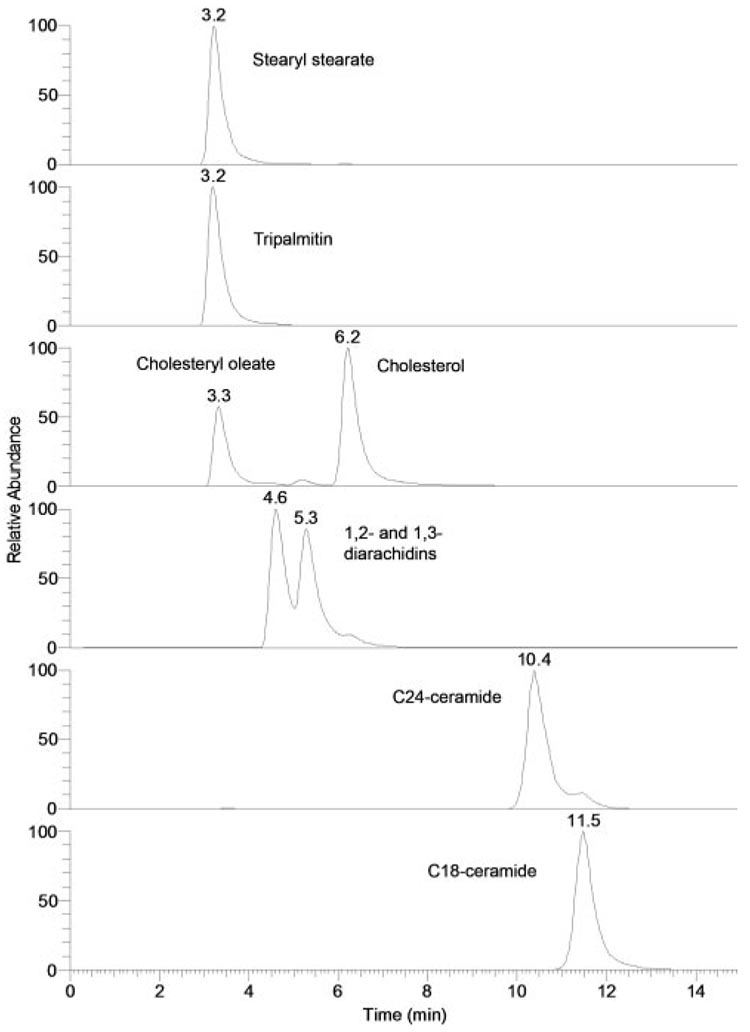
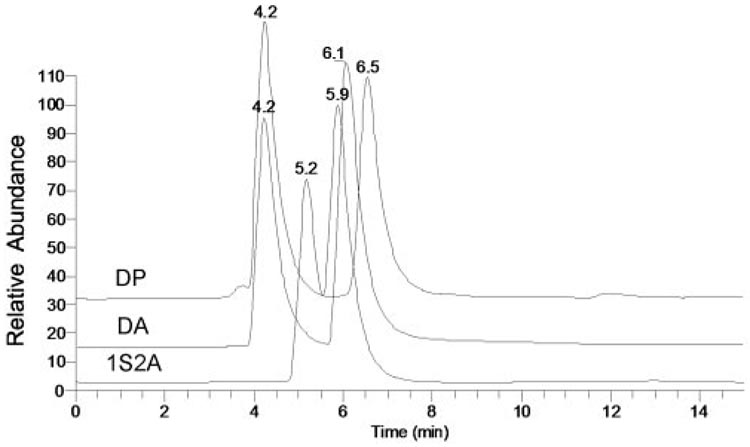
To optimize the HPLC and MS routines for analyses of the tear lipid samples and to provide the reference retention times and mass spectra for major lipid classes that were anticipated to be present in samples T1 to T3, a range of nonpolar and polar lipid standards was initially tested. Sample chromatograms of selected lipid standards are presented in Figure 7. Chl-E, WE, and TAG virtually coeluted, whereas other classes of nonpolar lipids (1,2- and 1,3-DAG, Chl, Cer, oleamide, and monoacyl glycerols [MAG]) eluted with distinctively different RTs. All tested lipids within their respective lipid classes (eg, all WEs, all Chl-E) eluted close to each other within their respective elution groups. In similar experiments, various WE, Chl-E, and TAG coeluted with RTs between 3 and 4 minutes. RTs were as follows: free cholesterol (Chl), approximately 6 minutes; Cer, between 10 and 15 minutes; oleamide and other fatty acid amides, approximately 18 to 20 minutes; MAG, slightly more than for oleamide and other fatty acid amides (not shown). As an example, elution profiles of three DAGs—1-stearoyl-2-arachidonoyl glycerol (1S2A), diarachidin (DA), and dipalmitin (DP)—are shown (Fig. 8). Note that all the compounds eluted as double peaks, indicating the presence of 1,2- as well as 1,3-positional isomers of the DAG. All three DAGs were observed as proton adducts of dehydrated precursor compounds (M-H2O+H+).
Figure 7.
Normal-phase HPLC elution profiles of nonpolar lipids. Chromatograms were plotted as single-ion chromatograms recorded in the positive ion mode: stearyl stearate (m/z 537; [M+H]+), tripalmitin (m/z 551, [M-palmitic acid+H]+), cholesteryl oleate and cholesterol (m/z 369; [M-oleic acid+H]+ and [M-H2O+H]+, respectively), 1,2- and 1,3-diarachidins (m/z 663; [M-H2O+H]+), C24-ceramide (m/z 632; [M-H2O+H]+), and C18-ceramide (m/z 548; [M-H2O+H]+).
Figure 8.
Normal-phase HPLC elution profiles of standard diacyl glycerols dipalmitin (DP), diarachidin (DA), and 1-stearoyl-2-arachidonoyl glycerol (1S2A).
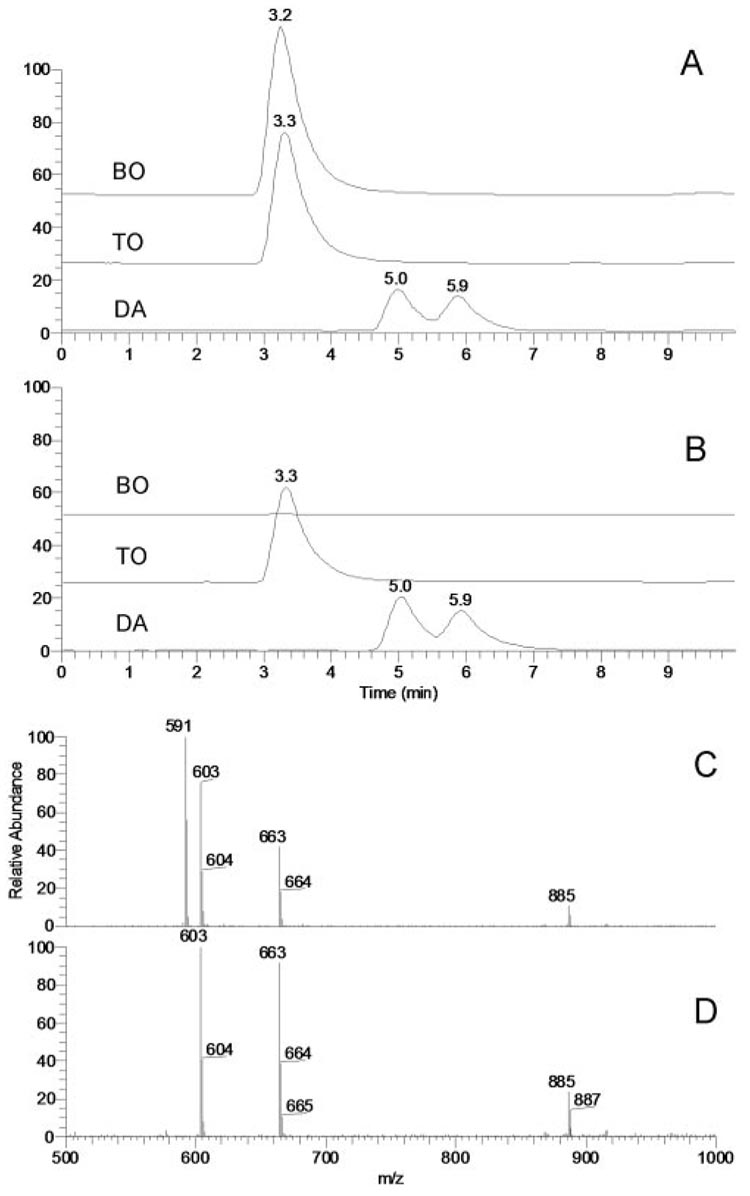
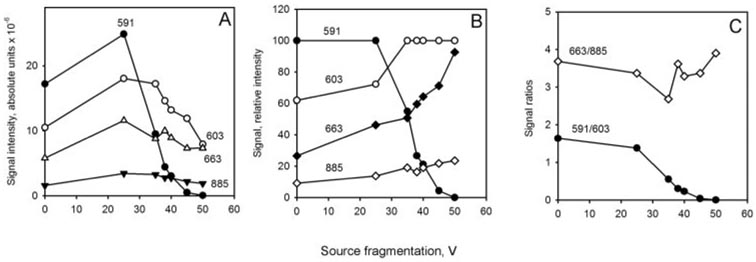
Correct identification and structural characterization of coeluting WE and TAG and closely eluting DAG represented a challenge that had to be addressed because these compounds appeared to be among the major lipid constituents of human meibum. A mixture of a WE (behenyl oleate [BO]), a TAG (triolein [TO]), and a DAG (diarachidin [DA]) was used to develop an MS protocol that would allow us to distinguish between closely eluting compounds. The compounds were dissolved in solvent HP at 5µg/mL each and were analyzed by HPLC MS in the positive ion mode. BO and TO coeluted, whereas DA trailed, showing up as a double HPLC peak (Fig. 9). With no source fragmentation engaged, BO was detected as a proton adduct (m/z 591 [M+H]+) and TO was detected as a proton adduct (m/z 885 [M+H]+) and a product ion (m/z 603 [M-oleic acid+H]+), whereas DA was detected as a mixture of 1,2- and 1,3-derivatives that produced a single common ion of dehydrated/protonated DA (m/z 663 [M-H2O+H]+).No protonated molecular ion of DA (m/z 681 [M+H]+) was detected. However, when source fragmentation was engaged and the collision energy was gradually increased from 0 V to 50 V, ion m/z 591 of BO started to diminish until it was completely gone at collision energy 50 V (Fig. 9, Fig. 10).
Figure 9.
Effects of source fragmentation on HPLC elution profiles and mass spectra of wax esters and diacyl and triacyl glycerols. (A) Single-ion chromatograms of a mixture of behenyl oleate (BO; m/z 591; [M+H]+), trioleate (TO; m/z 603; [M-oleic acid+H]+), and diarachidin (DA; m/z 663; [M-H2O+H]+) without source fragmentation engaged. (B) Single-ion chromatograms of a mixture of BO, TO, and DA with source fragmentation (50 V) engaged. Note the absence of the HPLC peak of BO. (C) Integrated MS profile of HPLC peaks with RT 3.2 to 5.9 (no source fragmentation). (D) Integrated MS profile of HPLC peaks with RT 3.2 to 5.9 (source fragmentation at 50 V). Note the absence of the MS signal of BO (m/z 591).
Figure 10.
Selective suppression of MS signals of wax esters in a mixture with diacyl and triacyl glycerols (5 µg/mL each) as a function of the fragmentation energy. (A) Absolute signal intensities of behenyl oleate (BO; m/z 591; [M+H]+), triolein (TO; m/z 885 and 603; [M+H]+ and [M-oleic acid+H]+, respectively), and diarachidin (DA; m/z 663; [M-H2O+H]+) at different fragmentation energy levels. (B) Relative intensities of the signals of BO, TO, and DA at different fragmentation energy levels. (C) Calculated ratios of the MS signals of BO, DA, and TO. Note that while the signal ratio DA/TO (663:885) remains fairly constant, the signal ratio BO/TO (591:603) becomes zero at the source fragmentation energy of 50 V, indicating complete suppression of the wax ester signal.
Importantly, ions of TO and DA remained perfectly detectable under the tested conditions, displaying prominent signals m/z 603, 663, and 885. In the same experiments, the ratio of ions m/z 663 and 885 did not change much, whereas the ratio of ions m/z 603 and 663 decreased less than twofold. This approach appeared to be a simple, but effective, way of distinguishing between WE and TAG/DAG in complex mixtures by selectively suppressing the less stable WE ions at collision energy of 50 V in MS1 experiments and leaving the more stable TAG and DAG species for subsequent MSn analyses.
Contaminations
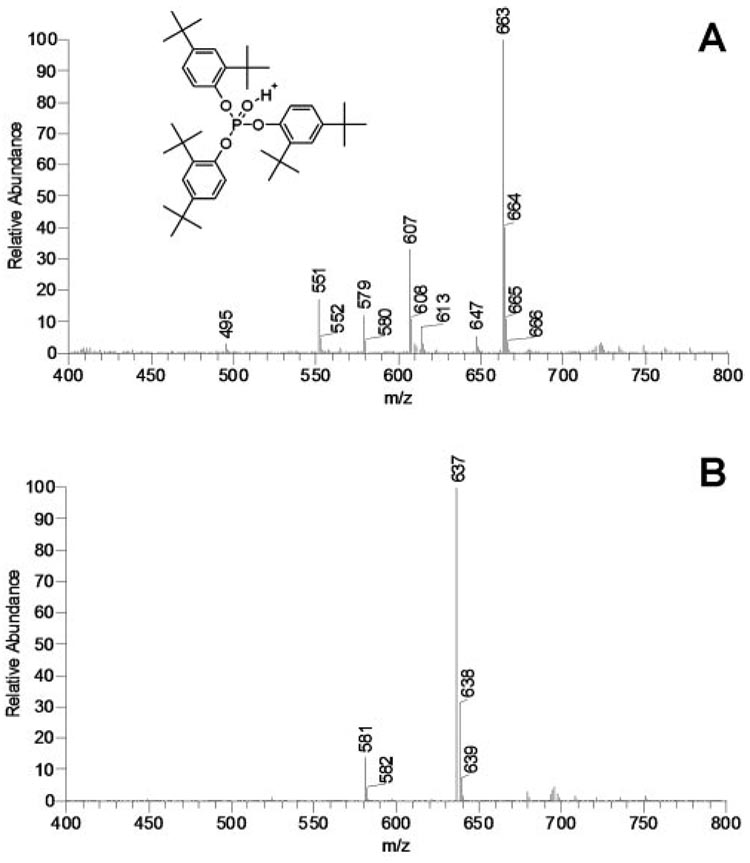
One of the major challenges that one encounters during the lipidomic analysis of complex mixtures is contamination of the samples with synthetic compounds. The samples may be inadvertently contaminated on extracting, concentrating, drying, and storing the samples. The main sources of contamination are impurities in organic solvents, laboratory plastic ware, and vacuum grease and oil. Organic solvents, especially the aggressive ones such as chloroform, dichloromethane, and acetic acid, tend to dissolve many types of plastic and should never be used with anything but glass, fluoropolymers (e.g., Teflon; DuPont, Wilmington, DE), stainless steel, and noble metals.19 Alcohols (methanol, ethanol, propanol) and alkanes (e.g., hexane, heptane, octane) are less aggressive, though their contact with plastic ware, even that approved for use with the above solvents, should be kept to minimum or avoided altogether. A frequent mistake is the use of Eppendorf tubes for handling and storing samples.19 Even a brief exposure of the tube to a chloroformic solution of a sample will present a serious risk of contaminating the samples with plasticizers and other extractives. As an example, a partial HPLC MS spectrum of a sample whose solution in the CM solvent was briefly kept in a polyethylene container is presented in Figure 11. Two prominent HPLC peaks were detected with the major MS signals with m/z values, respectively, of 663 and 637. Previously, ion m/z 663 was reported in samples of human meibum16 but was not assigned to any particular compound. The authors of the publication16 used Eppendorf tubes for storing and handling the lipid samples. No HPLC analysis or structural elucidation of the ion(s) was performed at the time. In our experiments, the RT of peak m/z 663 was approximately 4 minutes. Assuming that the detected ion was an (M+H)+ adduct, its molecular mass of 662 was close to that of a WE (C45H90O2) and a DAG (C43H84O5 − H2O). However, rushing to this conclusion would have been a mistake because subsequent fragmentation of ion m/z 663 in sequential MSn experiments gave us the following chain of product ions differing by 56 amu: 663 (MS1) → 607 (MS2) → 551 (MS3) → 495 (MS4) → 439 (MS5) → 383 (MS6) → 327 (MS7) (not shown). Note that the first four ions (663, 607, 551, 495) were also easily detectable in a simple MS1 experiment (Fig. 11A). These transformations were indicative of a sequential loss of several (up to six) t-butyl groups and were formerly described for oxidized form of Irgafos 168 (C42H63O4P, Fig. 11A, inset)—a polymer additive present in polyethylene and polypropylene—and its derivatives.20 In the negative ion mode, the compound gave two prominent signals, m/z 407 and 473. These ions were also distinctive characteristics of Irgafos.20 In a similar experiment, an apparently related, more polar compound with m/z 637 and its related ion m/z 581 (Fig. 11B) with an RT of approximately 25 minutes fragmented, releasing five t-butyl groups: 637 (MS1) → 581 (MS2) → 525 (MS3) → 469 (MS4) → 413 (MS5) → 367 (MS6) (not shown). The m/z value, a loss of only five t-butyl groups and much higher polarity, were indicative of a compound related to Irgafos 168 in which one of the t-butyl groups could have been replaced with a methoxy group (proposed molecular formula, C39H58O5P). These results emphasize the necessity of exercising the utmost care while handling and analyzing samples and the importance of proper laboratory techniques.
Figure 11.
Mass spectra of typical impurities found in lipid samples. (A) Mass spectrum of contaminations in sample T3, which was stored in an Eppendorf tube. Signals 495, 551, 607, and 663 are typical of oxidized Irgafos 168, a common plasticizer used in the production of polyethylene. (B) Mass spectrum of an Irgafos 168 derivative (presumably a debutylated, methoxylated isomer; characteristic signals 581 and 637).
Oleamide
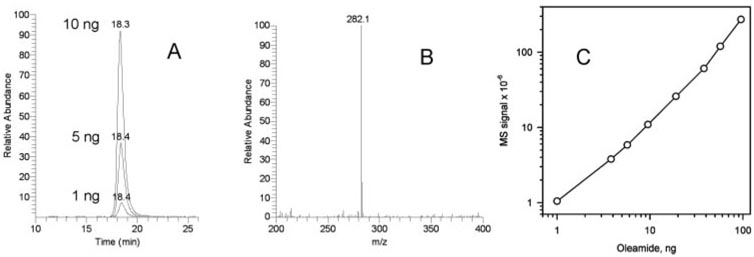
Among various lipids that were chosen for testing, oleamide stands out as a compound of potentially great importance. Nichols et al.16 reported that oleamide and related fatty acid amides are major components of human meibum. However, our preliminary data11,12,21 did not support this observation. In the present study, we conducted a systematic investigation of samples T1 to T3 to find out whether oleamide is present in human samples and, if it is, at which levels. In our hands, authentic oleamide could be easily detected by HPLC-APCI MS as a protonated ion (M+H+, m/z 282.2; Fig. 12). A standard curve for authentic oleamide showed that under the conditions of general scan MS1 analysis, the lower limit of detection was approximately 1 ng/injection or below. This level of sensitivity should have been more than sufficient to detect oleamide and related compounds if they were present in human meibum as dominant components.16 However, oleamide was an extremely minor component (well below 0.5% of dry meibum weight) and was present in only a handful of AT samples. Interestingly, oleamide was reported and identified as a major polymer additive20 along with some other fatty acid amides.
Figure 12.
Detection and quantitation of oleamide. (A) Single-ion chromatogram of oleamide (m/z 282; [M+H]+). Injected amounts 1, 5, and 10 ng. (B) Mass spectrum of the HPLC peak of oleamide (RT, 18.3 minutes). (C) Calibration curve for oleamide quantitation. Note that no signals of oleamide were detected in most of the samples. One of five T1 samples showed oleamide in minor quantities (<0.05% of dry lipid weight). Two of thirteen T2 and T3 samples showed trace amounts of oleamide, but quantitation was not possible because of the uncertain dry lipid weight of samples T2 and T3.
Squalene
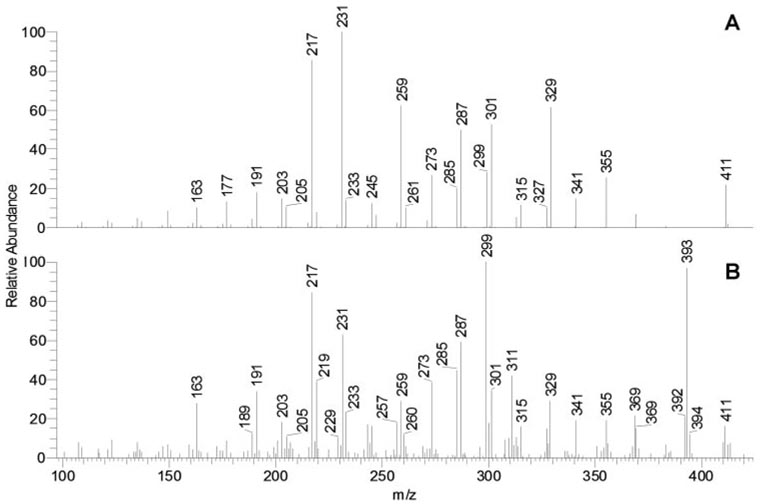
An MS peak with m/z 411.3 was often detected in samples T2 and T3 but rarely in samples T1. Its mass-to-charge ratio was similar to that of authentic squalene. To verify whether the compound in samples T2 and T3 was in fact squalene, authentic squalene and the unknown compound were fragmented in MS2 experiments (Fig. 13). The major ions detected for both compounds were similar and, along with the identical HPLC retention times, proved that the compound in samples T2 and T3 was indeed squalene. A signal at m/z 393 was attributed to an unknown isobaric compound with a similar precursor ion m/z 411, which underwent a loss of water (M − H2O + H+).
Figure 13.
Identification of squalene (m/z 411; [M+H]+) in aqueous tear samples (T3) in an MS/MS experiment. (A) Fragmentation of authentic squalene. (B) Fragmentation of ion m/z 411 detected in sample T3. Ion 393 is a signal of an unknown isobaric compound in the lipid mixture. Positiveion mode; solvent HPA; MS/MS fragmentation at relative energy of 38 V.
Steroids and Steryl Esters
Steroids and steryl esters have been found in all the samples analyzed in this study. Free Chl consistently consisted of no more than 0.5% to 1% of the total sterol lipid pool. The rest of the Chl-based compounds (99% or more) coeluted with standard Chl-E (not shown) and were considered as such. The low stability of Chl-E in APCI-MS experiments did not allow us to characterize the structures of these species at this time. Experiments are in progress to address this issue. No steroids other than Chl (or its isomer, epi-Chl) have been found in either of the samples.
Wax Esters
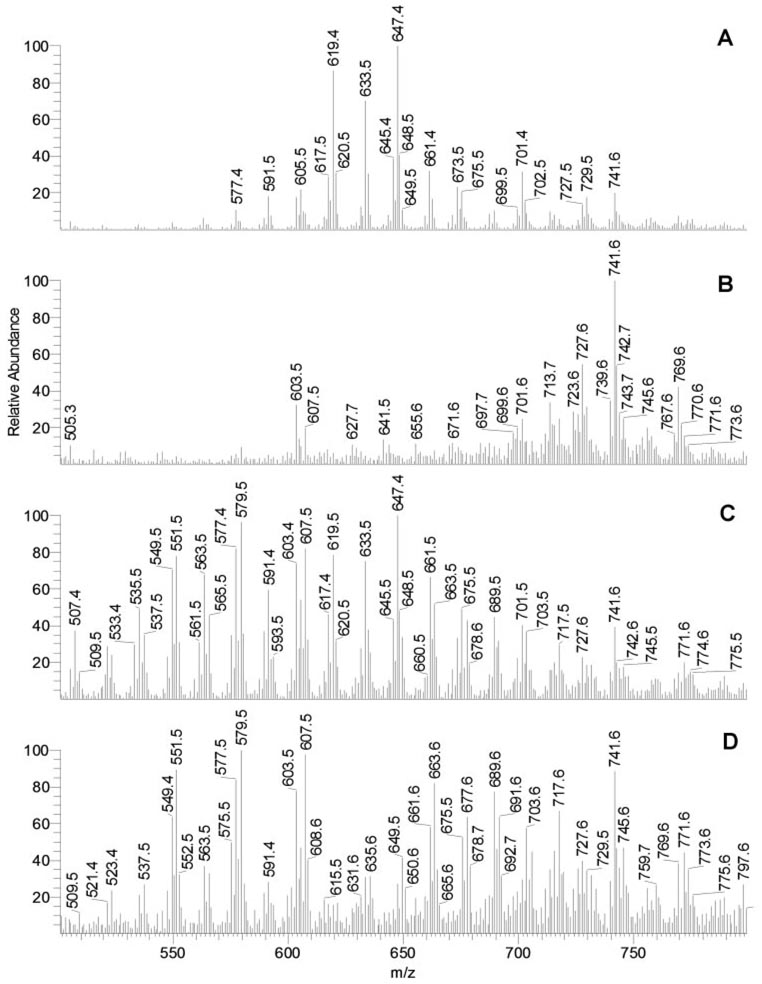
To discriminate between WE and other species in samples T1 and T3, both were run with and without source fragmentation engaged. Mass spectra of the corresponding portions of the chromatograms in which WE eluted are presented in Figure 14. Several observations were made. First, the engagement of source fragmentation effectively eliminated signals of standard WE (Fig. 9, Fig. 10). Therefore, we assumed that the signals of putative WE in samples T1 and T3 would also be suppressed under similar conditions. This approach indeed simplified the mass spectra of samples T1 because the ions of regular WE found in human meibum (Fig. 14A and earlier reports11,12) were not observed or were dramatically reduced when source fragmentation was set at 50 V (Fig. 14B). A similar observation was made for samples T3 (Figs. 14C, 14D): signals of the typical meibomian WE were observed without the source fragmentation engaged and were eliminated with the fragmentation turned on. Signals m/z 493 to 689 were evenly spaced by 14 amu and were most likely those of the proton adducts of diacyl glyceryl ions [(CnH2n-2O4−H2O+H)+ and (CnH2n-4O4−H2O+H)+ families] or WE with the molecular formulas (CnH2n-2O2+H)+, where n ranged from at least 33 to 47.
Figure 14.
Selective suppression of wax ester signals in samples T1 and T3 to differentiate those from other components of lipid mixtures. (A) Mass spectrum of the nonpolar (WE, Chl-E, TAG) fraction of sample T1 recorded in an HPLC experiment (no source fragmentation engaged). (B) Mass spectrum of the nonpolar fraction of sample T1 recorded in an HPLC experiment (source fragmentation energy, 50 V). (C) Mass spectrum of the nonpolar fraction of sample T3 recorded in an HPLC experiment (no source fragmentation engaged). (D) Mass spectrum of the nonpolar fraction of sample T3 recorded in an HPLC experiment (source fragmentation energy, 50 V). Note that the WE signals (577–675) visible in MGs (A) were suppressed by engaging source fragmentation (B). A similar observation was made for WE in sample T3 (C, D).
Second, it became obvious that the WE composition of samples T3 was more complex than that of samples T1. Although all the compounds in samples T1 were also found in samples T3, the latter had many more components, especially in the lower m/z region. Those compounds were WE and other types of nonpolar compounds, which differentiated these mixtures from MGs composed mostly of WE and Chl-E.11,12 The multiple new components found in samples T3 and their possible physiological activities are under investigation and will be reported in a subsequent manuscript.
TAG, DAG, and Other Esters
The signals that we detected in the samples when WE were suppressed were attributed to TAG, DAG, and possibly the diesters and triesters reported earlier.14 The signals in the TAG region (m/z 800–1200) qualitatively remained the same (not shown), though their overall intensity diminished under the harsher conditions of source fragmentation at 50 V. RTs of the major remaining compounds were close to those of TAG and DAG. Given that no standards of monoesters, diesters, and triesters postulated by Nicolaides et al.14 were available, we could not compare those with the compounds detected in human tears in our present experiments.
DISCUSSION
MGs has long been recognized as a major contributing factor to the lipid composition of the TFLL.3 The great diversity of lipids found in the MGs and AT, which are estimated to be present as thousands of individual species,22,23 makes it impossible to evaluate, identify, and quantify them in one study and to discuss the results in one paper. This forced us to concentrate on the major nonpolar lipids, leaving polar lipid analyses for an upcoming manuscript. Nonpolar lipids, to name a few that were previously reported to be present in meibum and tears, include hydrocarbons, sterols, and steryl esters, wax esters, acyl glycerols, various diesters and triesters, ceramides and their derivatives, free long-chain fatty acids and hydroxy fatty acids, fatty acid amides, and other lipid compounds.5–7,11–17,22–26 Because the studies were conducted during an extended period in various laboratories with diverse backgrounds (ophthalmic, biophysical, biochemical, chemical), the emphases in their work, implemented techniques, and conclusions varied greatly.
Recently, we conducted HPLC MS studies of pure human MGs.11,12 The MGs, initially semiliquid at body temperatures, immediately solidified at room temperatures to assume a waxy texture (Fig. 1). The melting point of samples T1 (approximately 32.5°C ± 1°C), and the shape of the melting curve (Fig. 2) confirmed that at room temperature, MGs are solid. The quick sample solidification precluded us from collecting the samples of MGs using the microcapillary technique described earlier for inflammatory mediator analyses10 because the solidified wax quickly blocked the capillary opening and stopped the MGs from flowing into the capillary. As a result, the collected samples were small and invariably contaminated with more fluid AT. The small sizes of the samples collected in this way were also reported by Nichols et al.16 Considering these obstacles, we exclusively used the hard-expressing technique for collecting samples T1, which typically resulted in 0.2- to1.5-mg (dry weight) samples.
To collect AT, we initially used the microcapillary technique. 10 The average size of samples T2 was approximately 6 µL per eye. Small volumes of collected tears made it difficult to gather enough material for subsequent MSn analyses. The most convenient approach to collecting the samples of AT appeared to be to use the Schirmer test strips (samples T3) for several reasons: use of the strips caused minimal risk of injury or eye infection; it was a standard routine in ophthalmic practice; and the amount of the lipid material collected this way was larger. Recently, the lipids of tears collected in a similar fashion were analyzed using infrared and fluorescence spectroscopy.27 In our study, a slightly modified version of that AT collection protocol was used. We analyzed the lipids absorbed by the entire wetted portion of the strip to ensure that none of the lipids was missing. Indeed, the process of tear absorption by the Schirmer test strip was akin to thin-layer chromatography on paper, a well-known technique, during which the analytes are separated while being carried away from the start with a solvent flow (AT, in this case). This would invariably create a gradient of analytes along the strip because some of the compounds would be moving faster than others. Thus, the necessity of analyzing the entire wetted area becomes obvious. Because our experiments showed that samples T2 contained all the components of MGs in samples T1 (Fig. 3), the sometimes feared contamination of AT with meibum lipids was not an issue. All the meibum lipids had already been present in AT (Fig. 4B).11,12
The reproducibility of the analyses (Fig. 5, Fig. 6) was sufficient to qualitatively compare samples T1, T2, and T3. Most importantly, the lipid profiles of samples T2 and T3 were close to each other, and both were more complex than samples T1. The structures of the newly observed compounds are being elucidated and will be reported separately.
Most of the lipids in the samples analyzed in this study were hydrophobic and had polarities lying between those of hydrocarbons and free sterols. No appreciable amounts of ceramides, fatty acid amides, or monoacyl glycerols were found in any of the samples. The virtual absence of Cer, a typical marker of skin cells,28 in our preparations gave assurance that the samples were not contaminated; the presence of MAG would have been indicative of sample hydrolysis, but that also did not occur. Infrequent observations of extremely weak signals of oleamide in samples T1 to T3 in this study and earlier ones11,12,21 and surprisingly high amounts of oleamide reported earlier16 were attributed to inadvertent random contamination of samples with common plasticizers. The latter included oleamide itself, Irgafos 168 and its derivatives (Fig. 11), and possibly some unidentified compounds.
In general, AT T2 and T3 samples had more low-molecular-weight compounds than T1 samples (Figs. 14A, 14C),11,12 possibly because of the higher solubility of these compounds in tears, reflecting the differences between sources and metabolism of those lipids in MG and other ocular structures. Moreover, the lower molecular weights of these compounds invariably meant lower melting temperatures and higher fluidity, which might have played an important physiological role in TF by affecting favorably its structural integrity and functionality. Our recent observation of the virtual absence of any phospholipids in straight MGs11,12 collected from volunteers who did not have dry eye is further supported by the fact that phospholipids, if present in substantial amounts, are likely to increase the melting temperatures of lipid mixtures (Fig. 2B), making them more viscous and harder to spread. The melting range of meibum detected in our experiments (32.5°C ± 1.0°C) was close to the values reported earlier.29–31
In contrast to previous observations,32 the HPLC-MS experiments clearly demonstrated that Chl-E and related compounds are the major constituents of the MGs or AT of all tested healthy volunteers. The characteristic ion, m/z 369 with its RT of 3.2 to 3.4 minutes (Fig. 3– Fig. 6), was a dominating feature of all the tested samples. Free cholesterol, however, was consistently a minor component of a sample not exceeding 0.5% to 1% of the Chl-E fraction in the sample. This dramatically contrasts with the findings of Wollensak et al.,33 who reported a 3:1 ratio of (WE + Chl-E) fraction to free Chl, with free Chl constituting approximately 15% of the total sample based on visual quantitation. However, the method of lipid detection by charring with sulfuric acid, implemented by Wollensak et al.,33 produces vastly differing results for compounds of different classes and is hardly accurate. Saturated compounds do not char well, but charring of unsaturated compounds makes them appear at least an order of magnitude more visible than the saturated ones. The sensitivity of charring increases proportionally to the degree of unsaturation; hence, a compound with two unsaturated bonds will be more visible than its analogue with just one double bond. The presence of amino and hydroxyl groups further potentiates the effect. Thus, the presence of free Chl, free fatty acids, and phospholipids can be easily overestimated by orders of magnitude compared with, respectively, Chl-E, WE, and nonpolar lipids.
In conclusion, the inconsistencies in the reported earlier compositions of MGs could be explained, at least in part, by accidental contamination of the samples with AT and synthetic compounds extracted from plastic ware during handling and storage of the samples and by the use of nonselective and nonspecific methods such as TLC. This could have been a serious problem in earlier experiments, in which nonspecific or insensitive methods of lipid detection (e.g., UV spectrometry, evaporative light scattering in HPLC experiments, and visual quantitation of the compounds after charring with sulfuric acid) were used. There is no doubt that the meibomian glands are a prominent source of lipids for the TF. However, it would have been a mistake to exclude from consideration other likely sources of lipids, such as conjunctiva, cornea, and AT produced by lacrimal glands. Earlier publications provided some clues about possible differences in lipid compositions of MGs and AT and similarities in the AT samples collected using the microcapillaries and Schirmer test strips.27,34,35 Our current HPLC-MS data showed that lipids of aqueous tears are more complex than meibomian gland secretions, necessitating a more cautious interpretation of the roles of the latter in tear film physiology. The observed presence of lower molecular weight compounds with m/z values between 500 and 600 and the detection of the large quantities of the compounds with higher polarities than typical meibum components suggest a more complex TFLL composition than the one based only on MGs. Therefore, a detailed comparative lipidomic analysis of specimens obtained from different sources, determination of the structures of the newly detected lipid species, and evaluation of their possible physiological roles are in order.
Acknowledgments
The author thanks James McCulley for kindly supporting this study, Mike Molai for invaluable help in selecting volunteers, and Jadwiga Wojtowicz for collecting the samples of human tears.
Supported in part by an unrestricted grant from the Research to Prevent Blindness, Inc., and by National Institutes of Health Core Grant EY016664.
Footnotes
Disclosure: I.A. Butovich, None
References
- 1.Andrews JS. Human tear film lipids, I: composition of the principal non-polar component. Exp Eye Res. 1970;10:223–227. doi: 10.1016/s0014-4835(70)80032-x. [DOI] [PubMed] [Google Scholar]
- 2.Brauninger GE, Shah DO, Kaufman HE. Direct physical demonstration of oily layer on tear film surface. Am J Ophthalmol. 1972;73:132–134. doi: 10.1016/0002-9394(72)90315-7. [DOI] [PubMed] [Google Scholar]
- 3.McCulley JP, Shine W. A compositional based model for the tear film lipid layer. Trans Am Ophthalmol Soc. 1997;95:79–88. discussion 88–93. [PMC free article] [PubMed] [Google Scholar]
- 4.Bron AJ, Tiffany JM, Gouveia SM, Yokoi N, Voon LW. Functional aspects of the tear film lipid layer. Exp Eye Res. 2004;78:347–360. doi: 10.1016/j.exer.2003.09.019. [DOI] [PubMed] [Google Scholar]
- 5.Shine WE, McCulley JP. Role of wax ester fatty alcohols in chronic blepharitis. Invest Ophthalmol Vis Sci. 1993;34:3515–3521. [PubMed] [Google Scholar]
- 6.Shine WE, McCulley JP. Meibomian gland triglyceride fatty acid differences in chronic blepharitis patients. Cornea. 1996;15:340–346. doi: 10.1097/00003226-199607000-00002. [DOI] [PubMed] [Google Scholar]
- 7.McCulley JP, Shine WE. Meibomian secretions in chronic blepharitis. Adv Exp Med Biol. 1998;438:319–326. doi: 10.1007/978-1-4615-5359-5_45. [DOI] [PubMed] [Google Scholar]
- 8.Yazdani C, McLaughlin T, Smeeding JE, Walt J. Prevalence of treated dry eye disease in a managed care population. Clin Ther. 2001;23:1672–1682. doi: 10.1016/s0149-2918(01)80136-3. [DOI] [PubMed] [Google Scholar]
- 9.Smith JA, Albeitz J, Begley C, et al. The epidemiology of dry eye disease: Report of the Epidemiology Subcommittee of the International Dry Eye Workshop. Ocul Surface. 2007;5:93–107. doi: 10.1016/s1542-0124(12)70082-4. [DOI] [PubMed] [Google Scholar]
- 10.Sack R, Conradi L, Beaton A, Sathe S, McNamara N, Leonardi A. Antibody array characterization of inflammatory mediators in allergic and normal tears in the open and closed eye environments. Exp Eye Res. 2007;85:528–538. doi: 10.1016/j.exer.2007.07.004. [DOI] [PubMed] [Google Scholar]
- 11.Butovich IA, Uchiyama E, McCulley JP. Lipids of human meibum: mass-spectrometric analysis and structural elucidation. J Lipid Res. 2007;48:2220–2235. doi: 10.1194/jlr.M700237-JLR200. [DOI] [PubMed] [Google Scholar]
- 12.Butovich IA, Uchiyama E, Di Pascuale MA, McCulley JP. Liquid chromatography-mass spectrometric analysis of lipids present in human meibomian gland secretions. Lipids. 2007;42:765–776. doi: 10.1007/s11745-007-3080-2. [DOI] [PubMed] [Google Scholar]
- 13.Bron AJ, Tiffany JM. The meibomian glands and tear film lipids: structure, function, and control. Adv Exp Med Biol. 1998;438:281–295. doi: 10.1007/978-1-4615-5359-5_40. [DOI] [PubMed] [Google Scholar]
- 14.Nicolaides N, Santos EC. The di- and triesters of the lipids of steer and human meibomian glands. Lipids. 1985;20:454–467. doi: 10.1007/BF02534237. [DOI] [PubMed] [Google Scholar]
- 15.Sullivan DA, Sullivan BD, Evans JE, et al. Androgen deficiency, meibomian gland dysfunction, and evaporative dry eye. Ann N Y Acad Sci. 2002;966:211–222. doi: 10.1111/j.1749-6632.2002.tb04217.x. [DOI] [PubMed] [Google Scholar]
- 16.Nichols KK, Ham BM, Nichols JJ, Ziegler C, Green-Church KB. Identification of fatty acids and fatty acid amides in human meibomian gland secretions. Invest Ophthalmol Vis Sci. 2007;48:34–39. doi: 10.1167/iovs.06-0753. [DOI] [PubMed] [Google Scholar]
- 17.Sullivan BD, Evans JE, Dana MR, Sullivan DA. Influence of aging on the polar and neutral lipid profiles in human meibomian gland secretions. Arch Ophthalmol. 2006;124:1286–1292. doi: 10.1001/archopht.124.9.1286. [DOI] [PubMed] [Google Scholar]
- 18.Folch J, Lees M, Sloane-Stanley GH. A simple method for the isolation and purification of total lipids from animal tissues. J Biol Chem. 1957;226:497–509. [PubMed] [Google Scholar]
- 19. [Accessed June 12, 2008];Technical information: storage & handling of lipids. Avanti Polar Lipids Web site: http://www.avantilipids.com/StoragepAndHandlingOfLipids.html.
- 20.Carrott MJ, Jones DC, Davidson G. Identification and analysis of polymer additives using packed-column supercritical fluid chromatography with APCI mass spectrometric detection. Analyst. 1998;123:1827–1833. [Google Scholar]
- 21.Butovich IA, Uchiyama E, McCulley JP. On the presence of oleamide in human meibum: quantification by LC/MS (e-letter) Invest Ophthalmol Vis Sci. 2007 June 14; [Google Scholar]
- 22.Tiffany JM. The lipid secretion of the meibomian glands. Adv Lip Res. 1987;22:1–62. doi: 10.1016/b978-0-12-024922-0.50005-9. [DOI] [PubMed] [Google Scholar]
- 23.Tiffany JM. Physiological functions of the meibomian glands. Progr Retinal Eye Res. 1995;14:47–74. [Google Scholar]
- 24.Nicolaides N, Kaitaranta JK, Rawdah TN, Macy JI, Boswell FM, 3rd, Smith RE. Meibomian gland studies: comparison of steer and human lipids. Invest Ophthalmol Vis Sci. 1981;20:522–536. [PubMed] [Google Scholar]
- 25.Dougherty JM, McCulley JP. Analysis of the free fatty acid component of meibomian secretions in chronic blepharitis. Invest Ophthalmol Vis Sci. 1986;27:52–56. [PubMed] [Google Scholar]
- 26.Nicolaides N, Ruth EC. Unusual fatty acids in the lipids of steer and human meibomian gland excreta. Curr Eye Res. 19821983;2:93–98. doi: 10.3109/02713688208997682. [DOI] [PubMed] [Google Scholar]
- 27.Borchman D, Foulks GN, Yappert MC, Tang D, Ho DV. Spectroscopic evaluation of human tear lipids. Chem Phys Lipids. 2007;147:87–102. doi: 10.1016/j.chemphyslip.2007.04.001. [DOI] [PubMed] [Google Scholar]
- 28.McMahon A, Butovich IA, Mata NL, et al. Retinal pathology and skin barrier defect in mice carrying a Stargardt disease-3 mutation in elongase of very long chain fatty acids-4. Mol Vis. 2007;13:258–272. [PMC free article] [PubMed] [Google Scholar]
- 29.Linton RG, Curnow DH, Riley WJ. The meibomian glands: an investigation into the secretion and some aspects of the physiology. Br J Ophthalmol. 1961;45:718–723. doi: 10.1136/bjo.45.11.718. [DOI] [PMC free article] [PubMed] [Google Scholar]
- 30.Nicolaides N. Skin lipids, II: lipid class composition of samples from various species and anatomical sites. J Am Oil Chem Soc. 1965;42:691–702. doi: 10.1007/BF02540042. [DOI] [PubMed] [Google Scholar]
- 31.Brown SI, Dervichian DG. The oils of the meibomian glands: physical and surface characteristics. Arch Ophthalmol. 1969;82:537–540. doi: 10.1001/archopht.1969.00990020539019. [DOI] [PubMed] [Google Scholar]
- 32.Shine WE, McCulley JP. The role of cholesterol in chronic blepharitis. Invest Ophthalmol Vis Sci. 1991;32:2272–2280. [PubMed] [Google Scholar]
- 33.Wollensak G, Mur E, Mayr A, Baier G, Göttinger W, Stöffler G. Effective methods for the investigation of human tear film proteins and lipids. Graefe's Arch Clin Exp Ophthalmol. 1990;228:78–82. doi: 10.1007/BF02764296. [DOI] [PubMed] [Google Scholar]
- 34.Nagyova B, Tiffany JM. Components responsible for the surface tension of human tears. Curr Eye Res. 1999;19:4–11. doi: 10.1076/ceyr.19.1.4.5341. [DOI] [PubMed] [Google Scholar]
- 35.Borchman D, Foulks GN, Yappert MC, Ho DV. Temperature-induced conformational changes in human tear lipids hydrocarbon chains. Biopolymers. 2007;87:124–133. doi: 10.1002/bip.20798. [DOI] [PubMed] [Google Scholar]


