

Abstract
Accurate and precise techniques that identify the quantity and distribution of adipose tissue in vivo are critical for investigations of adipose development, obesity, or diabetes. Here, we tested whether in vivo micro computed tomography (microCT) can be used to provide information on the distribution of total, subcutaneous and visceral fat volume in the mouse. Ninety C57BL/6J mice (weight range: 15.7 - 46.5 grams) were microCT scanned in vivo at 5 mo of age and subsequently sacrificed. Whole body fat volume (base of skull to distal tibia) derived from in vivo microCT was significantly (p<0.001) correlated with the ex vivo tissue weight of discrete perigonadal (R2 = 0.94), and subcutaneous (R2 = 0.91) fat pads. Restricting the analysis of tissue composition to the abdominal mid-section between L1 – L5 lumbar vertebrae did not alter the correlations between total adiposity and explanted fat pad weight. Segmentation allowed for the precise discrimination between visceral and subcutaneous fat as well as the quantification of adipose tissue within specific anatomical regions. Both the correlations between visceral fat pad weight and microCT determined visceral fat volume (R2=0.95, p<0.001) as well as subcutaneous fat pad weight and microCT determined subcutaneous fat volume (R2=0.91, p<0.001) were excellent. Data from these studies establish in vivo microCT as a non-invasive, quantitative tool that can provide an in vivo surrogate measure of total, visceral, and subcutaneous adiposity during longitudinal studies. Compared to current imaging techniques with similar capabilities, such as microMRI or the combination of DEXA with NMR, it may also be more cost-effective and offer higher spatial resolutions.
Keywords: Micro Computed Tomography, In Vivo, Adipose Tissue, Fat, Mouse
1. Introduction
The current obesity epidemic has spurred efforts to identify its etiology as well as prophylaxes and potential treatments for this health crisis. Because the accumulation of fat in different body compartments carries differential metabolic risks (Kuo et al., 2007), spatial information on the distribution of adipose tissue is important. Increased total adiposity across the abdomen promotes a high risk of metabolic disease (Gesta et al., 2007) and type 2 diabetes (Haffner, 2007) but visceral adipose tissue (VAT) is more closely correlated with obesity-associated pathologies and complications than either total adipose tissue (TAT) or subcutaneous adipose tissue (SAT) (Weisberg et al., 2003; Fox et al., 2007). Nevertheless, the quantification of both VAT and SAT accumulation is also relevant as they have been associated with many metabolic risk factors including fasting plasma insulin, triglycerides, low-density lipoprotein, or cholesterol levels (Despres, 2007; Imbeault et al., 1999).
In humans, the use of magnetic resonance imaging (MRI) and computed tomography (CT) to assess body composition and determine fat content is well established (Chiba et al., 2007; Maurovich-Horvat et al., 2007). However, the ability to spatially discriminate different types of adipose tissue in small animal models such as the mouse, the model of choice in obesity and diabetes research (Brockmann and Bevova, 2002), is limited by most of the current measurement techniques. The resolution and signal-to-noise ratio required to selectively quantify adipose tissue depots in mice that weigh as little as ten grams presents a unique challenge. MicroMRI has been successfully used to phenotype mouse models of obesity (Calderan et al., 2006), but this technology is not readily available to most researchers. Dual energy x-ray absorptiometry (DEXA) and quantitative nuclear magnetic resonance (QMR) based scanning of the whole animal have been used to effectively characterize lean and fat volume in the mouse, but they do not provide detailed spatial information on fat distribution (Reed et al., 2007; Taicher et al., 2003).
Over the past ten years, high-resolution micro-computed tomography (microCT) scanners have become widely available. MicroCT distinguishes itself from other imaging techniques in its ability to acquire high-resolution images based on the physical density of the tissue. Because of the much greater density of calcified tissue, this technique has been used extensively in biomedical research to quantify the morphology and micro-architecture of the skeleton (Muller et al., 1996; Ruegsegger et al., 1996; Garman et al., 2007). However, microCT also provides a three-dimensional density map with sufficiently large density gradients (contrast) to distinguish adipose tissue from other tissues, fluids, and cavities without contrast agents. As the resolution of in vivo microCT scans can be selected to fall into an isometric voxel range of approximately ten to two hundred microns, the system can not only measure the total volume of adipose tissue within an animal, but can also identify and quantify very small volumes of fat cells residing in discrete deposits. While perhaps not necessary for adipose imaging, the capability of high-resolution microCT scan confers specificity for describing adipose tissue that can currently only be obtained by combining DEXA with MRI technology (Garcia et al., 2006).
The ability to use in vivo microCT imaging to describe altered levels of total fat content based on low-resolution scans has been recently suggested (Rubin et al., 2007; Bastie et al., 2007). Herein, we tested whether microCT can provide a surrogate measure of in vivo visceral, subcutaneous, or total fat pad mass and whether adipose information obtained from the abdominal region is equivalent to that derived from whole body scans. Data from these studies establish and validate in vivo microCT as a non-invasive, quantitative tool that provides a robust, reliable, simple and cost-effective alternative with higher resolution and selectivity than previous methods to precisely determine total and regional adipose volumes.
2. Materials and Methods
2.1 Experimental Model
All procedures were reviewed and approved by Stony Brook University's Animal Care and Use Committee (IACUC). Twenty-four female and 66 male C57BL/6J mice were obtained from The Jackson Laboratories (Bar Harbor, ME) at 6wk of age, housed in conventional cages, and given free access to food and water. Of this population, fifty mice received a regular chow (Lab Diets, RMH 3000, Richmond, IA) diet (12 female, 38 male) or a 45% kcal high-fat (Test Diets, 58V8, Richmond, IA) diet (12 female, 28 male). At 7wk of age, half of the mice within each group (regular diet and fat diet, male and female), were subjected to a non-pharmacological prophylaxis for adiposity (short daily durations of very low-level mechanical signals applied via vertical whole body oscillations for 12 wk), further amplifying differences in body composition within the group of mice (Rubin et al., 2007). At 19wk of age, mice were scanned in vivo by microCT. Animals received a 2wk recovery from the exposure to anesthesia to facilitate biochemical analyses unrelated to this study. Upon sacrifice, the perigonadal fat pad (epididymal in male and parametrial in female mice) and a subcutaneous fat pad spanning the lower back (mesenteric) region were harvested and weighed. The perigonadal fat pad is regarded as part of the visceral compartment (Gesta et al., 2006). The mesenteric fat pad is considered subcutaneous, starting at the lesser curvature of the stomach and ending at the sigmoid colon (Parekh et al., 1998) but is external to the abdominal capsule delineated by the muscle fascia (Fig. 1).
Figure 1.
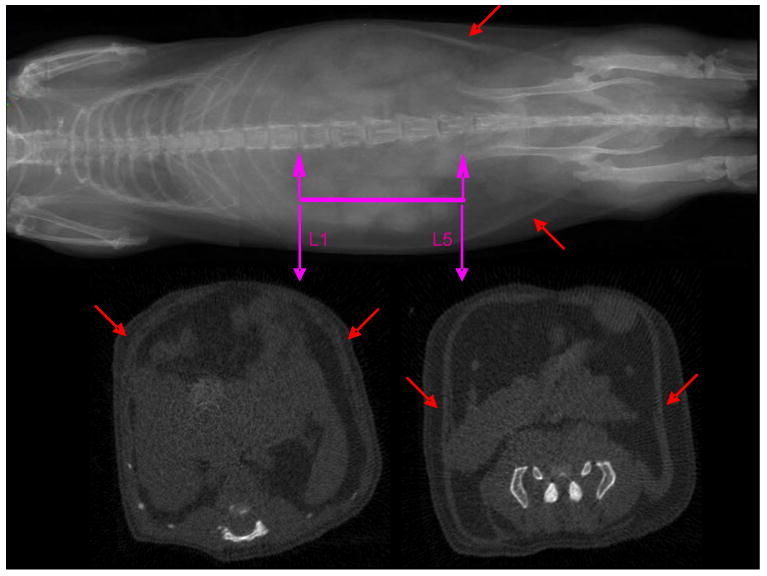
MicroCT scout view of a mouse (top). The abdominal region of interest between the proximal end of L1 and the distal end of the L5 vertebrae is highlighted. Cross-sectional view though the proximal and distal landmarks that were used to identify the abdominal region of interest (bottom). Red arrows indicate the muscle layer that separates visceral from subcutaneous fat.
2.2 In Vivo Scanning
For in vivo scans, mice were anesthetized by 1% isoflurane inhalation and positioned with both legs fully extended. The entire torso of each mouse was scanned at an isotropic voxel size of 76 microns (45kV, 133μA, 300ms integration time) with a vivaCT 40 scanner (Scanco Inc, SUI). Selection of the scan energy and voxel size (scanning increment) was based on optimizing the requirements of scanning time and tissue detail, and to minimize exposure to radiation. Based on the scan parameters, the estimated radiation exposure is on the order of 190-380 mGy for each scan (based on values provided by Scanco, SUI). Two-dimensional gray-scale image slices were reconstructed into a three-dimensional tomography. Density values for soft tissue were calibrated from a 5-point linear fit line with mixtures in various ratios of two liquids, ranging from 0.78mg/ml (100% ethanol, Sigma, St. Louis, MO) to 1.26mg/ml (100% glycerol, J.T. Baker, Phillipsburg, NJ). Density values for bone tissue were calibrated via a commercially available phantom containing hydroxyapatite rods of different densities (Scanco, SUI). Scans were reconstructed for either the whole body (base of the skull, as the spinal canal begins to widen and the distal end of the tibia) or the abdominal region (between the proximal end of L1 and the distal end of L5, Fig. 1). The head and feet were not scanned and/or evaluated because of the relatively low amount of adiposity in these regions, and to allow for a reduction in scan time and radiation exposure to the animals. The region of interest (ROI) for each animal was defined based on skeletal landmarks from the gray-scale images.
2.3 In Silico Evaluation, Total Fat Volume
A custom script written in image processing language (IPL) was used to analyze total fat volume. Briefly, the algorithm separated the mouse body from the background to provide the total tissue volume (TV) of the mouse. A Gaussian filter (sigma = 1.5, support = 3.0) was used to reduce the background noise in the image. A preliminary threshold segmenting fat from other tissue and background (voids) was determined by ex-vivo microCT imaging of a freshly harvested fat pad from a C57BL/6J mouse. The harvested fat pad only served to provide a broad estimate of the threshold, and would not be necessary for future studies using the same genetic mouse strain. Subsequently, the lower and upper threshold values were adjusted by selecting only those voxels within a histogram of all grayscale values of a given region of interest (ROI) that represented either adipose tissue and muscle/internal organs (lean tissue). This is readily accomplished as the distribution of tissue grayscale values from a microCT scan is bimodal in nature, with one mode representing adipose tissue voxels and the other mode representing lean tissue voxels (Fig. 2). For our analyses, we selected regions from an animal with average body mass in which the tissue composition consisted of approximately 50% fat, 50% lean volume, and was of sufficient size to ensure that the histogram had sufficient data points to provide two distinct peaks within the distribution. Thus, thresholds can be set to selectively visualize fat volume, lean volume, or both. By comparing raw to segmented images, the selected threshold was visually confirmed for animals on the extremes of low- and high body mass. These thresholds were fixed thresholds and applied consistently across all animals and regions of interest.
Figure 2.
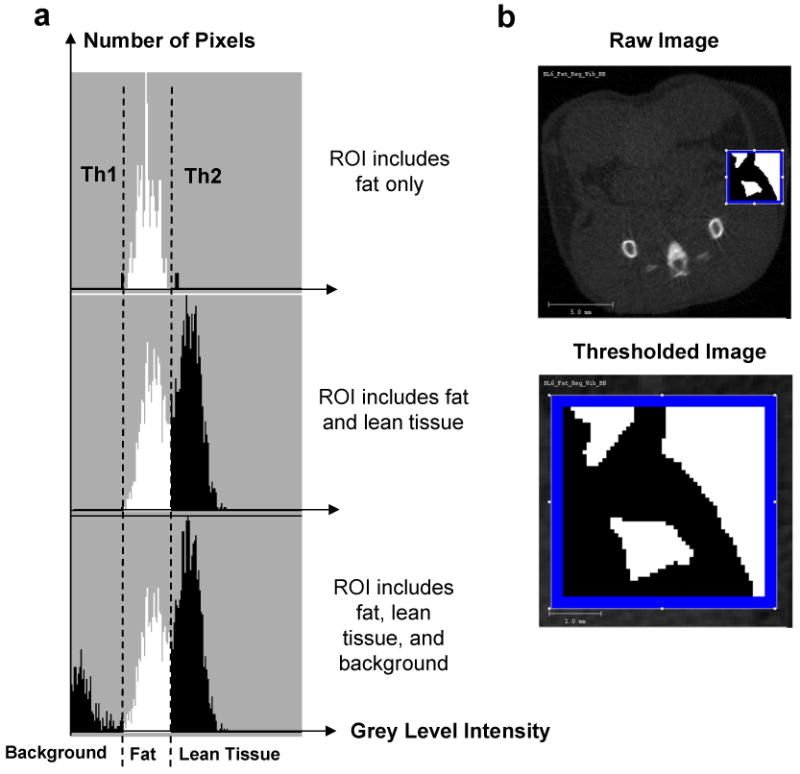
Selection of threshold values for each tissue type to separate fat and bone from other tissues. (a). Representative regions of interest (ROI) of known composition were selected. Histograms of the gray-level intensities (x-axis) within these representative ROIs were generated. The top histogram presents a histogram for a ROI in which only one tissue type (fat) was present. The relatively homogenous fat tissue is represented by a narrow distribution of gray level intensities (densities), allowing the selection of an upper and lower thresholds (Th1 and Th2) specific for fat. For the histogram below, an ROI was selected in which two tissue types - fat and lean tissue (muscles and/or internal viscera) – were present, causing a bimodal intensity distribution. The bottom histogram shows a trimodal distribution of density values from a ROI with two tissue types and background. (b). A reconstructed image from the mid-torso areas was utilized in the selection of the ROI with known tissue types (top). The enlarged image (bottom) provides an example for a ROI which yields a bimodal distribution.
2.4 Quantification of Visceral and Subcutaneous Fat
For determinations of abdominal adipose volume, a subset of 45 animals was randomly selected from the total animal population of 90. The total adipose tissue (TAT) volume was first evaluated, and then further subdivided into compartments. The abdominal muscular wall was used as the demarcation line to separate visceral adipose tissue (VAT) from subcutaneous adipose tissue (SAT) (Eguchi et al., 2007). Histologically, the muscle fascia is distinct and easy to identify (Fig. 1). In microCT density based images of an animal, this muscle layer appears brighter because of its higher density. To separate the lower density fat compartments on both sides on either side of the muscle, the fascia can either be traced manually by drawing contour lines, or detected automatically to increase processing speed and reduce user-variability (Lublinsky et al., 2007; Buie et al., 2007). The separation of fat regions was performed on segmented images. Here, the fat compartments in the abdominal region were separated and quantified using a custom IPL script based on the Canny method for edge detection (Canny, 1986; Lublinsky et al., 2008)
2.5 Statistics
Across all mice (n = 90 for whole body evaluations, n=45 for abdominal evaluations), linear regressions were used to determine the association between the microCT-determined adipose volumes and explanted fat pad weights. For the abdominal region of each animal, total adipose volume in (TAT) was divided into visceral (VAT) or subcutaneous (SAT) adipose volume and regressed against fat pad weight individually. All data were reported as mean ± standard deviation, and statistical significance was defined at p<0.05.
3. Results
3.1 Validation of Scan Data
The in vivo microCT scans provided a sufficiently high contrast and signal-to-noise ratio to identify and isolate adipose tissue throughout the body of the mouse (Fig. 3). As expected, the degree of adiposity varied greatly across the group of 90 mice. The use of skeletal sites as anatomical landmarks allowed the precise definition of the region of interest, both for measurements between different animals as well as for multiple measurements within the same animal. This was particularly important because we found that adipose and other soft tissues were poor landmarks because of their variable location due to physiological factors (e.g., gastrointestinal status) and variability associated with positioning (e.g., stretching) the animal in the scanner.
Figure 3.
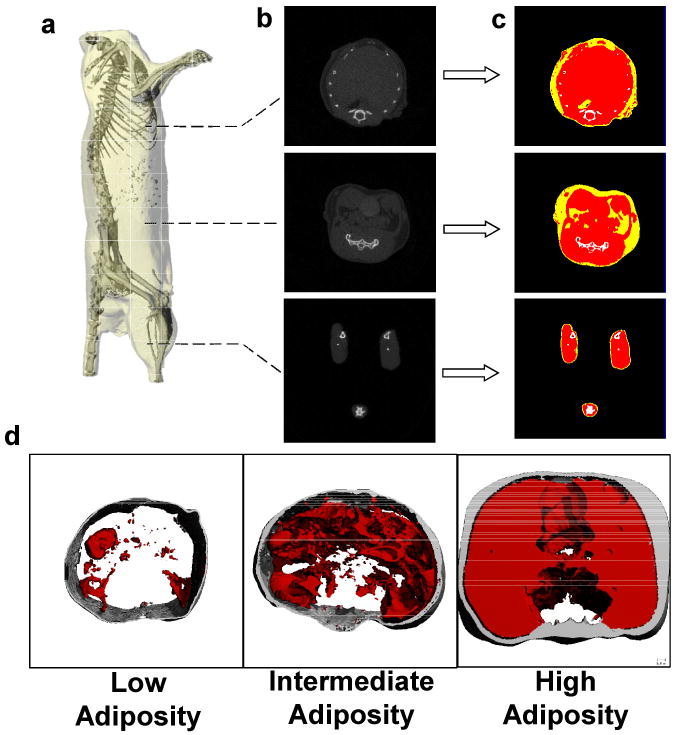
(a) Reconstructed microCT scan of a mouse in which the skeleton can be readily identified to define the region of interest. (b). The majority of the adipose tissue in the mouse is localized in the abdominal region, as the thoracic cavity and legs show lower prevalence of low density (fat) tissue. (c). To quantify fat volume in these different body compartments, tissues of different density were segregated and categorized as either fat (yellow) lean mass (red) or bone (white). (d). Representative images from three different animals with either low, intermediate, or high adiposity. Subcutaneous fat is shown in gray, visceral fat in red.
Across the ninety mice, total adipose values of the body (minus head and feet) exhibited a very strong and positive correlation with the physiologic weight of the discrete visceral and subcutaneous fat pads that were explanted at sacrifice (2wks after the scans). The coefficient of determination (R2) for the correlation between the harvested subcutaneous fat pad and microCT fat volume of the entire body was 0.91 (p<0.001) while the correlation between the harvested visceral fat pad and whole-body fat volume (R2 = 0.94, p<0.001) was similarly high (Fig. 4a).
Figure 4.

(a) Total fat volume (from the base of the skull to the distal tibia) determined by in vivo microCT was highly correlated with both the visceral and subcutaneous tissue weight of the fat pads harvested at sacrifice (n=90). (b). A scan of the abdominal region reduced the scan time by two-thirds. Despite the much smaller region, fat volume of the abdomen (spanning between L1 and L5 vertebrae) was highly correlated with total fat volume of the entire mouse body (n=45).
The length of time required to scan an entire mouse with our scanner at the specified settings was approximately 40 minutes and, inherently, proportional to the length of each mouse. To decrease the scan time and the exposure of the animal to anesthesia and radiation, it was investigated whether similar information on fat volume can be gained by reducing the length of the region of interest from the whole body to the abdominal area. Selection of this much smaller abdominal region, encompassing the mid-torso between the L1 and L5 vertebrae, reduced the scan-time by two thirds, from 35-40 minutes to 12-13 minutes. Whole-body fat volume was very highly correlated with abdominal fat volume across the 45 mice (R2 = 0.99, p<0.001, Fig 4b) and, therefore, the R2 values between microCT fat volume and fat pad weight did not change significantly by restricting the region of interest to the abdominal area (R2 = 0.92 for subcutaneous fat pad and R2 = 0.96 for epididymal fat pad, p<0.001 each).
3.2 Visceral and Subcutaneous Fat Discriminations
To investigate any potentially different relations between the subcutaneous/visceral adipose tissue compartments and fat pad weights, visceral fat volume was automatically separated from subcutaneous fat volume by customized algorithms for the abdominal region encompassing L1 to L5. The weight of the visceral fat pad weight was highly correlated with the microCT determined VAT volume (R2 =0.95, p<0.001, Fig. 5a). The correlation between the subcutaneous fat pad weight and the microCT determined SAT volume was equally high (R2 =0.91, p<0.001, Fig. 5b). Further, VAT volume was highly correlated with SAT volume (R2 = 0.98, p<0.001, Fig. 5c), similar to the correlation between visceral fat pad weight and subcutaneous fat pad weight (R2 =0.95, p<0.001).
Figure 5.

Evaluation of abdominal adiposity separating visceral adipose tissue (VAT) from subcutaneous adipose tissue (SAT). For these analyses, data from 45 animals were randomly selected from the entire population. (a). Visceral adipose tissue volume was highly correlated with the weight of the visceral (perigonadal) fat pad (p<0.001). (b). Subcutaneous adipose tissue volume was highly correlated with the weight of the subcutaneous (from the lower back) fat pad (p<0.001). (c). As the microCT calculated volumes for both fat deposits correlated well with the weights of the respective fat pads, VAT and SAT area were also correlated to each other (p<0.001).
4. Discussion
With the high current, and projected, activity in obesity and diabetes related research, the ability to non-invasively image different types and locations of adipose tissue in small animal models has become increasingly important. The primary aim of this study was to validate the methodology of in vivo microCT scanning as a substitute for the ex vivo measurements of fat pads. Mice used in this study were of the most commonly utilized inbred strain in biomedical research and displayed differences in body fat volume by an order of magnitude. The very high correlations between total / subcutaneous / visceral fat volume with the specific subcutaneous and visceral fat pad weights demonstrated the utility of this technique in providing real time data on adiposity in the mouse, in a quick, non-invasive manner. That the correlations using fixed thresholds were consistent across this very diverse sample of mice (body mass, body fat, diet, gender, and treatment) attests to the robustness of this method. While this study was performed in mice, it can be readily adapted to any animal model that fits into a microCT scanner.
All evaluated data for visceral and subcutaneous adipose tissue showed strong correlations to the weight of the explanted fat pads. However, the perigonadal (visceral) fat correlations were slightly higher than the mesenteric (subcutaneous) correlations even though the R2 values for either type of fat were not significantly different from each other. This difference may have been caused by the location of the isolated mesenteric fat pad which, in contrast to the perigonadal fat pad, was not entirely within the evaluated abdominal region. Moving the distal anatomical landmark further distally, may further enhance the coefficient of determination. The high R2 values for the linear regressions between microCT-calculated fat volumes and fat pad weights over a large range of data demonstrates the utility of in vivo microCT to determine differences in body composition between different groups but it is important to note that the absolute values of the calculated fat volumes were entirely dependent on the region of interest. As the cross-sectional fat content varies greatly along the longitudinal axis of the mouse torso, the regressions cannot be used for future studies to predict the specific weight of visceral or subcutaneous fat pad weights based on the microCT data.
Our data showed that the information derived from whole-body microCT scans was equivalent to scans of only the abdominal region between the L1 and L5 vertebrae. In clinical studies, relatively few (typically one to five) CT slices in the abdominal area between the L2 and L3 vertebra are analyzed to assess adiposity (Kanaley et al., 2007). While this suggests that it may be possible to further reduce the length of the region of interest in the mouse, it may cause inaccuracies in the discrimination between visceral and subcutaneous fat, particularly in small and lean animals, as the total volume of evaluated fat deposits would be greatly decreased. Regardless, our data demonstrate that the scanning and evaluating of only the mid-torso of a mouse, encompassing the majority of the intra-abdominal fat, will provide a precise relative assessment of total, subcutaneous, and visceral adipose tissue.
For our analyses, the calculated SAT value also included the volume of the skin, as the density of skin is similar to the density of fat (Rins et al., 1991) and is therefore assigned to fat within the selected threshold values. The full thickness of skin for the C57BL/6J inbred mouse strain is approximately 120 microns (Kodera et al., 2002). Based on the resolution of the microCT scans, the skin encompassed up to two voxels in the radial direction and this volume was included in our reported fat volumes. For the spatial analyses of SAT and VAT, the skin volume defaulted as part of the subcutaneous compartment (based on location). Because skin voxels contributed a relatively small and consistent volume to the SAT, no efforts were made to subtract them either from SAT or TAT. Nevertheless, in very lean mice or in mice with very little subcutaneous fat, algorithms could be used to adjust SAT volume to exclude the contribution from skin.
Adipose mass and increased adiposity can alter systemic physiology by changing the endocrine and metabolic state of the tissue (Weisberg et al., 2003) and the measurement of in vivo fat volume and adipose burden may be an important surrogate indicator of metabolic health. Thus, the ability to determine this parameter non-invasively in a live animal will not only provide longitudinal data without the need to sacrifice the animal, but will also increase the statistical power by the ability to perform intra-animal comparisons. Our data indicate that in vivo microCT of small animals can quickly and reliably provide data on adipose volume at spatial resolutions that are high enough to quantify specific and very small deposits of fat within animals of varying adiposity.
Acknowledgments
The authors thank Bhavin Busa and Pooja Rambhia for technical assistance. Financial support by NASA, NIAMS, and the Wallace Coulter Foundation is gratefully acknowledged.
Footnotes
Publisher's Disclaimer: This is a PDF file of an unedited manuscript that has been accepted for publication. As a service to our customers we are providing this early version of the manuscript. The manuscript will undergo copyediting, typesetting, and review of the resulting proof before it is published in its final citable form. Please note that during the production process errors may be discovered which could affect the content, and all legal disclaimers that apply to the journal pertain.
Conflict of Interest: None of the authors have any conflict of interest
References
- Bastie CC, Zong H, Xu J, Busa B, Judex S, Kurland IJ, Pessin JE. Integrative metabolic regulation of peripheral tissue fatty acid oxidation by the SRC kinase family member Fyn. Cell Metab. 2007;5:371–381. doi: 10.1016/j.cmet.2007.04.005. [DOI] [PubMed] [Google Scholar]
- Brockmann GA, Bevova MR. Using mouse models to dissect the genetics of obesity. Trends Genet. 2002;18:367–376. doi: 10.1016/s0168-9525(02)02703-8. [DOI] [PubMed] [Google Scholar]
- Buie HR, Campbell GM, Klinck RJ, MacNeil JA, Boyd SK. Automatic segmentation of cortical and trabecular compartments based on a dual threshold technique for in vivo micro-CT bone analysis. Bone. 2007;41:505–515. doi: 10.1016/j.bone.2007.07.007. [DOI] [PubMed] [Google Scholar]
- Calderan L, Marzola P, Nicolato E, Fabene PF, Milanese C, Bernardi P, Giordano A, Cinti S, Sbarbati A. In vivo phenotyping of the ob/ob mouse by magnetic resonance imaging and 1H-magnetic resonance spectroscopy. Obesity (Silver Spring) 2006;14:405–414. doi: 10.1038/oby.2006.54. [DOI] [PubMed] [Google Scholar]
- Canny J. IEEE Transactions on Pattern Analysis and Machine Intelligence. Vol. 8. 1986. A Computational Approach to Edge Detection. [PubMed] [Google Scholar]
- Chiba Y, Saitoh S, Takagi S, Ohnishi H, Katoh N, Ohata J, Nakagawa M, Shimamoto K. Relationship between visceral fat and cardiovascular disease risk factors: the Tanno and Sobetsu study. Hypertens Res. 2007;30:229–236. doi: 10.1291/hypres.30.229. [DOI] [PubMed] [Google Scholar]
- Despres JP. Cardiovascular disease under the influence of excess visceral fat. Crit Pathw Cardiol. 2007;6:51–59. doi: 10.1097/HPC.0b013e318057d4c9. [DOI] [PubMed] [Google Scholar]
- Eguchi M, Tsuchihashi K, Saitoh S, Odawara Y, Hirano T, Nakata T, Miura T, Ura N, Hareyama M, Shimamoto K. Visceral obesity in Japanese patients with metabolic syndrome: reappraisal of diagnostic criteria by CT scan. Hypertens Res. 2007;30:315–323. doi: 10.1291/hypres.30.315. [DOI] [PubMed] [Google Scholar]
- Fox CS, Massaro JM, Hoffmann U, Pou KM, Maurovich-Horvat P, Liu CY, Vasan RS, Murabito JM, Meigs JB, Cupples LA, D'Agostino RB, Sr, O'Donnell CJ. Abdominal visceral and subcutaneous adipose tissue compartments: association with metabolic risk factors in the Framingham Heart Study. Circulation. 2007;116:39–48. doi: 10.1161/CIRCULATIONAHA.106.675355. [DOI] [PubMed] [Google Scholar]
- Garcia MC, Wernstedt I, Berndtsson A, Enge M, Bell M, Hultgren O, Horn M, Ahren B, Enerback S, Ohlsson C, Wallenius V, Jansson JO. Mature-onset obesity in interleukin-1 receptor I knockout mice. Diabetes. 2006;55:1205–1213. doi: 10.2337/db05-1304. [DOI] [PubMed] [Google Scholar]
- Garman R, Gaudette G, Donahue LR, Rubin C, Judex S. Low-level accelerations applied in the absence of weight bearing can enhance trabecular bone formation. J Orthop Res. 2007;25:732–740. doi: 10.1002/jor.20354. [DOI] [PubMed] [Google Scholar]
- Gesta S, Bluher M, Yamamoto Y, Norris AW, Berndt J, Kralisch S, Boucher J, Lewis C, Kahn CR. Evidence for a role of developmental genes in the origin of obesity and body fat distribution. Proc Natl Acad Sci USA. 2006;103:6676–6681. doi: 10.1073/pnas.0601752103. [DOI] [PMC free article] [PubMed] [Google Scholar]
- Gesta S, Tseng YH, Kahn CR. Developmental origin of fat: tracking obesity to its source. Cell. 2007;131:242–256. doi: 10.1016/j.cell.2007.10.004. [DOI] [PubMed] [Google Scholar]
- Haffner SM. Abdominal adiposity and cardiometabolic risk: do we have all the answers? Am J Med. 2007;120:S10–S16. doi: 10.1016/j.amjmed.2007.06.006. [DOI] [PubMed] [Google Scholar]
- Imbeault P, Lemieux S, Prud'homme D, Tremblay A, Nadeau A, Despres JP, Mauriege P. Relationship of visceral adipose tissue to metabolic risk factors for coronary heart disease: is there a contribution of subcutaneous fat cell hypertrophy? Metabolism. 1999;48:355–362. doi: 10.1016/s0026-0495(99)90085-9. [DOI] [PubMed] [Google Scholar]
- Kanaley JA, Giannopoulou I, Ploutz-Snyder LL. Regional differences in abdominal fat loss. Int J Obes (Lond) 2007;31:147–152. doi: 10.1038/sj.ijo.0803359. [DOI] [PubMed] [Google Scholar]
- Kodera T, McGaha TL, Phelps R, Paul WE, Bona CA. Disrupting the IL-4 gene rescues mice homozygous for the tight-skin mutation from embryonic death and diminishes TGF-beta production by fibroblasts. Proc Natl Acad Sci USA. 2002;99:3800–3805. doi: 10.1073/pnas.052709999. [DOI] [PMC free article] [PubMed] [Google Scholar]
- Kuo LE, Kitlinska JB, Tilan JU, Li L, Baker SB, Johnson MD, Lee EW, Burnett MS, Fricke ST, Kvetnansky R, Herzog H, Zukowska Z. Neuropeptide Y acts directly in the periphery on fat tissue and mediates stress-induced obesity and metabolic syndrome. Nat Med. 2007;13:803–811. doi: 10.1038/nm1611. [DOI] [PubMed] [Google Scholar]
- Lublinsky S, Luu YK, Rubin CT, Judex S. An Automated Algorithm to Separate Visceral from Subcutaneous Fat in Micro Computed Tomographies. 2008. [Google Scholar]
- Lublinsky S, Ozcivici E, Judex S. An automated algorithm to detect the trabecular-cortical bone interface in micro-computed tomographic images. Calcif Tissue Int. 2007;81:285–293. doi: 10.1007/s00223-007-9063-8. [DOI] [PubMed] [Google Scholar]
- Maurovich-Horvat P, Massaro J, Fox CS, Moselewski F, O'Donnell CJ, Hoffmann U. Comparison of anthropometric, area- and volume-based assessment of abdominal subcutaneous and visceral adipose tissue volumes using multi-detector computed tomography. Int J Obes (Lond) 2007;31:500–506. doi: 10.1038/sj.ijo.0803454. [DOI] [PubMed] [Google Scholar]
- Muller R, Hahn M, Vogel M, Delling G, Ruegsegger P. Morphometric analysis of noninvasively assessed bone biopsies: comparison of high-resolution computed tomography and histologic sections. Bone. 1996;18:215–220. doi: 10.1016/8756-3282(95)00489-0. [DOI] [PubMed] [Google Scholar]
- Parekh PI, Petro AE, Tiller JM, Feinglos MN, Surwit RS. Reversal of diet-induced obesity and diabetes in C57BL/6J mice. Metabolism. 1998;47:1089–1096. doi: 10.1016/s0026-0495(98)90283-9. [DOI] [PubMed] [Google Scholar]
- Reed DR, Bachmanov AA, Tordoff MG. Forty mouse strain survey of body composition. Physiol Behav. 2007;91:593–600. doi: 10.1016/j.physbeh.2007.03.026. [DOI] [PMC free article] [PubMed] [Google Scholar]
- Rins M, Diez I, Calpena AC, Obach R. Skin density in the hairless rat. Evidence of regional differences. Eur J Drug Metab Pharmacokinet. 1991:456–457. Spec No 3. [PubMed] [Google Scholar]
- Rubin CT, Capilla E, Luu YK, Busa B, Crawford H, Nolan DJ, Mittal V, Rosen CJ, Pessin JE, Judex S. Adipogenesis is inhibited by brief, daily exposure to high-frequency, extremely low-magnitude mechanical signals. Proc Natl Acad Sci USA. 2007 doi: 10.1073/pnas.0708467104. [DOI] [PMC free article] [PubMed] [Google Scholar]
- Ruegsegger P, Koller B, Muller R. A microtomographic system for the nondestructive evaluation of bone architecture. Calcif Tissue Int. 1996;58:24–29. doi: 10.1007/BF02509542. [DOI] [PubMed] [Google Scholar]
- Taicher GZ, Tinsley FC, Reiderman A, Heiman ML. Quantitative magnetic resonance (QMR) method for bone and whole-body-composition analysis. Anal Bioanal Chem. 2003;377:990–1002. doi: 10.1007/s00216-003-2224-3. [DOI] [PubMed] [Google Scholar]
- Weisberg SP, McCann D, Desai M, Rosenbaum M, Leibel RL, Ferrante AW., Jr Obesity is associated with macrophage accumulation in adipose tissue. J Clin Invest. 2003;112:1796–1808. doi: 10.1172/JCI19246. [DOI] [PMC free article] [PubMed] [Google Scholar]