

Abstract
Background
Older persons with diabetes are heterogeneous with respect to life expectancy and frailty, and new guidelines recommend individualizing care.
Objectives
1) To describe variation in the preferences of older diabetic patients regarding aggressiveness of glycemic control and avoiding diabetic complications. 2) To determine correlates of patient preferences and physician treatment goals. 3) To assess whether physicians’ goals were consistent with their patients’ preferences.
Research Design
Cross-sectional surveys and chart reviews in urban academic clinics.
Subjects
473 diabetic patients 65 years or older; 64 physicians.
Measures
Patient preferences (utilities on a scale from 0-1, 0=death, 1=perfect health) for diabetic complications and intensity of treatment; physician target treatment goals and ratings of aggressiveness of approach.
Results
80% of the patients were African-American, 63% were women, average age was 73.7 ± 5.9 years and 26% expected to live 5 years or less. Patient preferences/utilities showed significant variation: blindness 0.39 (SD 0.32), lower leg amputation 0.45 (0.34), conventional treatment 0.76 (0.27), intensive insulin treatment 0.64 (0.32). Physicians’ hemoglobin A1c goal was ≤ 7% in 69% of patients. Greater estimated patient life expectancy was consistently associated with higher patient utilities and was associated with physicians’ willingness to use aggressive treatments. Physicians’ treatment goals and approaches were associated with patients’ utilities for treatment.
Conclusions
Older patients vary greatly in their preferences regarding diabetic complications and treatments. Acknowledging patient preferences, along with life goals and prognostic data, may improve quality of treatment decisions.
Keywords: diabetes, aging, preferences, utilities
In the United States, approximately 13% of people 60 years or older have known diabetes, and about 6% have undiagnosed diabetes.1,2 Currently 40% of persons with type 2 diabetes are 65 years or older, and diabetes is expected to increase in prevalence as the population ages.3 A particularly vexing problem is that little evidence exists to guide the management of older persons with diabetes, who characteristically have shorter life expectancies and frequently have more competing comorbidities than younger persons with diabetes.4,5 In addition, the elderly population is heterogeneous with respect to prognosis, life expectancy, severity of illness, comorbidities, social support, and possibly patient preferences.6 Until recently, scant attention has been paid to whether care of older persons with diabetes should differ from that of younger persons.
In 2003, the California Healthcare Foundation and American Geriatrics Society released the first guideline to emphasize the importance of individualizing care for older persons with diabetes.7 The American Diabetes Association endorsed this guideline and has increasingly devoted commentary to the care of the elderly in its standards of medical care. In 2007, the ADA acknowledges the diversity of the elderly population and recommends that active, cognitively intact persons with life expectancy of 10 or more years should be encouraged to adhere to standard glycemic targets, while those patients with advanced complications, limited lifespan, or major cognitive or functional impairment might have less intensive goals.8
A key challenge for caring for older persons with diabetes is that there is frequently considerable uncertainty about how to best make treatment decisions for a given patient. Some decisions are fairly straightforward. For example, an otherwise healthy older person with a long life expectancy would be likely to benefit from an aggressive treatment approach to prevent the microvascular and macrovascular complications of diabetes, while a patient with metastatic cancer or advanced dementia and short life expectancy might be less likely to benefit.9 However, many older patients with diabetes have a much less clear prognostic picture.
In clinical settings, shared decision-making models of the patient-provider encounter might be useful for enhancing simultaneous consideration of scientific evidence, clinical judgment, and patient preferences.10 Management of older persons with diabetes has largely relied on extrapolating scientific evidence from younger persons and using clinical judgment, with less attention given to assessing and incorporating patient preferences. Understanding patient preferences may be particularly useful clinically among patients for whom scientific evidence is lacking and clinical judgment is difficult. Effective doctor-patient communication and incorporation of patient preferences are likely to be important components of the decision-making process that could help ensure that all older patients receive the treatment approach that is optimal for them as individuals. Unfortunately, little is known about how older diabetic patients assess different possible disease complications and treatment approaches, whether certain traits serve as reliable proxies for patient preferences, and the degree to which physicians individualize their care approaches.
Therefore, we aimed to: 1) describe variation in the preferences of older patients with diabetes regarding aggressiveness of glycemic control and avoiding the microvascular and macrovascular complications of diabetes, 2) determine whether sociodemographic and clinical factors were correlated with these patient preferences and physician treatment goals, and 3) assess whether physicians’ treatment goals were consistent with their patients’ preferences.
Methods
Study Population
We studied patients 65 years or older with diabetes and their physicians at the general internal medicine, geriatrics, and endocrinology clinics of the X between December 2000 and January 2003. Patients were identified prior to a clinic visit through the medical center’s scheduling software, and a diabetes diagnosis was confirmed through the medical record. After enrolling approximately 350 patients, we targeted patients of physicians who had less than the average number of enrolled patients per physician at the time. We telephoned 1,067 potentially eligible participants of whom 694 (65%) answered the telephone. Of these 694 contacted patients, 607 (87%) agreed to participate in the interview, 35 patients declined outright to participate, and 87 deferred to be contacted at another clinic visit. Of the 607 patients scheduled for an interview, 52 did not show up at the designated interview time. Thus, 555 (80%) of approached patients were enrolled and completed the interview. Seventy-seven of 79 eligible attending physicians agreed to participate in the study: Sixty-four physicians (15 endocrinologists, 39 general internists, 10 geriatricians) completed surveys for 473 patients who constituted the final study sample. The study was approved by the X Institutional Review Board.
Patient Survey
We assessed health status with a global health perception question on a 5-point Likert scale (Excellent…Poor),11 the Medical Outcomes Study Short Form 12 (SF-12),12 and the Katz Index of Activities of Daily Living.13
We assessed patient utilities for diabetic complications and treatments with the time trade-off method and visual analog scale.14-16 We use the time trade-off as a preference-based measure of health-related quality of life.17 The time trade-off method is based on a theoretical utility model that specifies lifetime utility as the product of quality of life (h) between 0 (death) and 1 (perfect health) multiplied by the duration of life (t). The time trade-off method offers a subject two alternatives, each of which would be a certainty as opposed to a gamble:
state i for time T (life expectancy of an individual with the chronic condition) followed by death, yielding lifetime utility = hi*T;
in perfect health for time t < T followed by death, yielding lifetime utility = 1*t.
The subject is given a series of questions where time t is changed using the ping pong method until the subject is indifferent between the two choices, when presumably hi*T = 1*t.18 Thus, the preference value for state i is represented by hi = t/T. We asked time trade-off questions for the diabetic complications blindness (“to live with blindness from diabetes”), renal failure requiring dialysis, and lower leg amputation. We also asked time trade-off questions for descriptions of conventional diabetes therapy (check glucose few times per week; might take pills to lower glucose or might take insulin once a day), intensive diet therapy (strict diabetic diet that limits the number of concentrated sweets), intensive pill therapy (2 pills and periodic blood checks), and intensive insulin therapy (2 shots of insulin per day, check home glucose few times a day, severe hypoglycemic event every 2 years). For example, “Which of the following would you prefer: Live with intensive insulin treatment for 10 years, Live in perfect health for 9 years, No preference because these seem about the same to you.” For the treatment utility questions, the subjects were asked to consider how the therapy would affect their daily lives and not consider the long-term effects of the treatments.
Physician Survey
For each interviewed patient, we distributed a one-page survey after the visit to the physician primarily responsible for his or her diabetes care. The physician was instructed to answer the survey for each individual patient and not his or her approach to diabetes care in general. The survey asked physicians to identify specific hemoglobin A1c, systolic blood pressure, and LDL cholesterol treatment goals for the particular patient. The physicians were also asked to rate the importance for each particular patient of preventing acute symptoms, preventing microvascular and macrovascular complications, and avoiding burdens of treatment, respectively, on a 5-choice scale from “extremely important” to “very unimportant.” Finally, the physician was asked to state the most aggressive hypoglycemic treatment he or she would consider in the particular patient given the overall goals, as well as to estimate the number of years the patient would live and to report how many years they had been taking care of the patient.
Chart Review
We reviewed medical records for information including comorbid illnesses and laboratory values.19 On a 10% re-review of medical records to assess inter-rater reliability, the kappa scores were 0.92 for HbA1c and 0.75 for systolic blood pressure levels.
Data Analysis
Separate logistic and ordinal logistic regression analyses were conducted to assess the associations of 1) patient utilities for complications and treatment choices with patient demographic and clinical characteristics, 2) physician goals and preferences for the patient’s treatment with patient characteristics and 3) physician goals and preferences for the patient’s treatment with patient utilities for complications and treatment choices.20,21 Adjustment for physician specialty and duration of the patient-physician relationship were evaluated when modeling physician goals and preferences. For analysis, patient time trade-off utilities were collapsed into ordinal categories with three levels. Levels were chosen to correspond as nearly as possible to tertiles of the empirical distributions while maintaining comparability by specifying a single set of levels for complications (< 0.10, 0.10 – 0.50, >0.50) and another for treatment options (< 0.55, 0.55 – 0.90, > 0.90). The association between patient time trade-off utilities and patient characteristics was analyzed using ordinal logistic regression with robust standard errors to account for clustering of patients within physicians; the proportional odds assumption was tested. For analysis, physicians’ preferences for preventing symptoms and treatment burden, measured on a 5-point Likert scale, were dichotomized as ‘very or extremely important’ versus lower ratings; treatment aggressiveness was dichotomized as two or more insulin shots per day versus less intensive treatments, and treatment goals were dichotomized according to whether they coincided with standard guidelines. Dichotomized physician treatment goal and preference outcomes were analyzed using mixed logistic regression, with physician as a random effect to incorporate correlation due to clustering of patients within physicians.22,23 Covariates were modeled as categorical factors, except for the SF-12 mental and physical component scores, which were entered as continuous covariates. Levels of covariates were collapsed when indicated by the model fit (i.e., their coefficients were similar in magnitude and did not differ significantly from each other). Univariate models were fit first to estimate bivariate associations between outcomes and predictors. Multivariable regression models then were fit to evaluate simultaneously the factors associated with patient utilities and physician treatment goals and preferences, using backward selection with variables that were significant at p < 0.20 in univariate models entered as candidate covariates. Analyses were conducted in Stata 9.2.24
Results
Patient Population
Of the 473 patients, 80% were African-American, 63% were women, 71% graduated from high school, and the average age was 73.7 ± 5.9 years. Over 99% of the patients had type 2 diabetes, and the average duration of diabetes was 13.2 ± 10.4 years (Table 1). Forty-four percent assessed their health as fair or poor, 23% had one or more deficiencies in their Katz Activities of Daily Living. Thirty-six percent used insulin, and 46% had at least one diabetic complication. Twenty-six percent expected to live 5 years or less. Sixty-two percent of the patients were cared for by an internist alone, 24% by an endocrinologist alone or in conjunction with an internist, 14% by a geriatrician or geriatrician plus others.
Table 1.
Patient Characteristics (%1) N = 473
| Sociodemographic Characteristics | Charlson Comorbidity Index | ||
| Female | 63 | 0 | 18 |
| Age, yrs (Mean [SD]) | 73.7 (5.9) | 1 | 24 |
| African-American | 80 | 2 | 24 |
| Education | ≥3 | 34 | |
| < High School | 29 | Cardiovascular Risk Factors | |
| High School graduate | 27 | Hypertension | 89 |
| > High School | 44 | Hyperlipidemia | 52 |
| Income | Smoking | ||
| < $10,000 | 23 | Current | 8 |
| $10,001-$25,000 | 25 | Former | 37 |
| $25,001-$50,000 | 24 | None | 55 |
| >$50,000 | 12 | Alcohol abuse | 7 |
| Did not know/Refused | 16 | Prior Cardiovascular Events | |
| Marital Status | Myocardial Infarction | 12 | |
| Married or Living as if Married | 44 | Heart Failure | 18 |
| Divorced/Separated/Widowed | 52 | Cerebrovascular Disease | 17 |
| Single (Never married) | 4 | Body Mass Index (Mean [SD]) | 30.1 (6.4) |
| Could use more help with daily tasks | 33 | Health Status/Functional Status | |
| Clinical Characteristics | General health perception | ||
| Type 2 diabetes | 99.8 | Excellent/Very good | 19 |
| Duration of diabetes, yrs (Mean [SD]) | 13.2 (10.4) | Good | 37 |
| Diabetic Complications | Fair/Poor | 44 | |
| Nephropathy | 19 | Katz Index of ADLs2 | |
| Creatinine > 4.0 mg/dL | 3 | ||
| Neuropathy | 22 | 0 | 77 |
| Peripheral vascular disease | 19 | 1 | 15 |
| Retinopathy | 14 | ≥ 2 | 8 |
| Any of the above | 46 | SF-12 (Mean [SD]) | |
| Uses Insulin | 36 | Physical | 37.5 (6.4) |
| Number of doses of insulin per day | Mental | 49.9 (6.8) | |
| 1 | 25 | Life Expectancy3 | |
| 2 | 70 | ≤ 5 years | 26 |
| ≥ 3 | 5 | 6-10 years | 32 |
| Frequency of Home Blood Glucose Monitoring | 11-15 years | 21 | |
| 2x per day or more | 40 | > 15 years | 21 |
| 1x per day | 31 | ||
| < 1x per day | 29 |
Percentage totals may differ from 100% due to rounding.
ADLs = Activities of daily living
Life expectancy was estimated by patients in the patient interview.
Patient Utilities and Preferences
Patients generally felt that diabetic complications would significantly affect their quality of life with average time trade-off utilities of blindness 0.39 (SD 0.32), renal failure requiring dialysis 0.36 (0.31), and leg amputation 0.45 (0.34). On average, leg amputation was not thought to be as severe as blindness (p<0.001) and dialysis was considered most severe (p<0.001 vs. amputation, p=0.047 vs. blindness). However, as can be seen by the large standard deviations as well as the graphical display of the distributions in Figure 1, wide variation exists in the utilities different patients place on these diabetic complications. Patients noted that treatments could also adversely affect quality of life as indicated by their time trade-off utilities, with a larger decrement for intensive insulin treatment (p<0.001 vs. each other treatment): conventional treatment 0.76 (0.27), intensive dietary treatment 0.76 (0.28), intensive pill treatment 0.77 (0.27), intensive insulin treatment 0.64 (0.32). The distributions in Figure 1 again show the wide variation in patient ratings of the utility of these treatment approaches. Utilities also showed wide variation within strata defined by demographic and clinical characteristics of patients.
Figure 1. Patient Utilities for Diabetic Complications and Treatments.
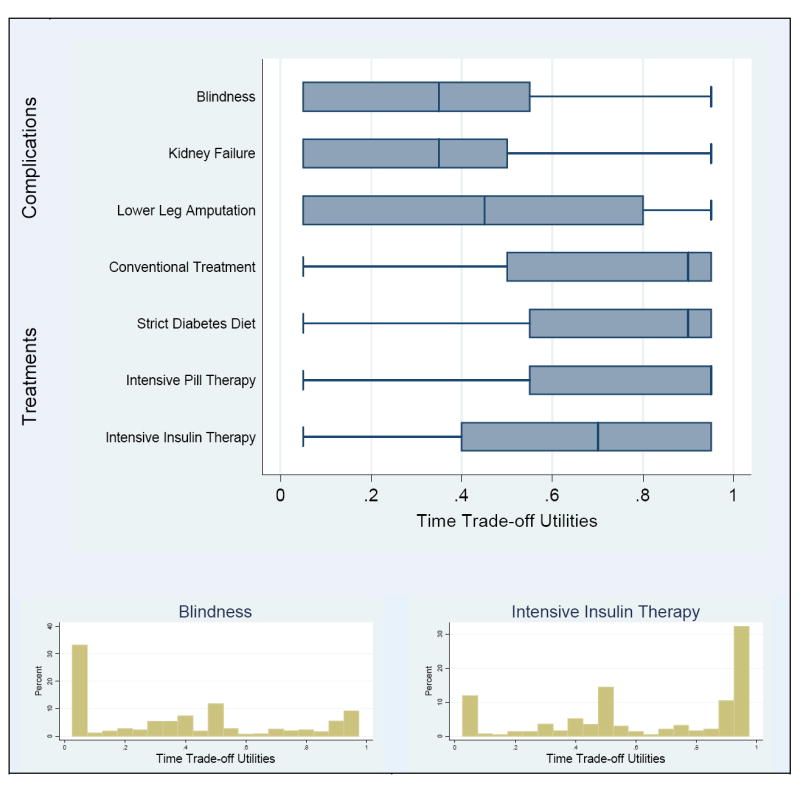
Boxplots of time trade-off utilities (TTOs) for diabetes complications and treatments reveal broad patterns of their distributions, which facilitates comparison. The detailed features in the histograms for blindness and intensive insulin therapy are typical of the TTO distributions for diabetes complications and treatments, respectively. The fact that utilities of 0 and 1 were not observed is an artifact of the algorithm for eliciting them. In the boxplots, the vertical line within the box represents the median value, and the edges of the box are the first and third quartiles. The lines extending from the edges of the box end at the last value within 1.5 times the interquartile range (third minus first quartile) from the edge of the box. Any values beyond this distance are considered outliers and are plotted individually.
Associations of Patient Utilities with Patient Demographic and Clinical Characteristics
In univariate analysis, patients who expected to live longer were more likely to rate all diabetic complications (blindness, leg amputation, kidney failure) and treatment regimens (conventional, intensive pill, intensive insulin) that were assessed closer to perfect health – as were younger patients, except for intensive pill therapy (Table 2). Patients with annual income exceeding $50,000 had higher utilities for all three complications and for conventional treatment, compared to those at the lowest income level (< $10,000). Having completed high school was marginally but consistently associated with higher utilities for all treatment approaches. Patient utilities for complications showed no significant associations with any of the clinical factors considered. In contrast, patients with no ADL limitations were more likely to have higher utility for intensive pill therapy compared to those with 2 or more ADL deficiencies, with a similar trend for conventional treatment and intensive insulin therapy. Utilities for intensive insulin therapy were related to the greatest number of patient factors. Life expectancy and income were consistent multivariate predictors of patient utilities for complications and treatment approaches (Table 2 and footnote explanation).
Table 2.
Relationship of Patient Time Trade-off Utilities for Complications and Treatment Choices to Patient Characteristics: Ordinal Logistic Regression Analysis 1, 2, 3
| Dependent Variables: Patient Time Trade-off Utilities (TTOs)
|
||||||
|---|---|---|---|---|---|---|
| TTOs for Complications | TTOs for Treatment Approaches | |||||
| Living with Lower Leg Amputation4 | Living with Blindness4 | Living with Kidney Failure4 | Conventional Treatment5 | Intensive Pill Therapy5 | Intensive Insulin Therapy5 | |
| TTO Mean ± SD | 0.45 ± 0.34 | 0.39 ± 0.32 | 0.36 ± 0.31 | 0.76 ± 0.27 | 0.77 ± 0.27 | 0.64 ± 0.32 |
| Life Expectancy | odds ratios (95% confidence intervals) | |||||
|
| ||||||
| Patient’s Estimate, yrs | ||||||
| 0 – 5 | 1.00 | 1.00 | 1.00 | 1.00 | 1.00 | 1.00 |
| 6 – 10 | 1.94 (1.28, 2.95) | 1.84 (1.19, 2.85) | 1.43 (1.02, 2.00) | 2.25 (1.38, 3.67) | 1.51 (0.91, 2.49) | 1.47 (0.95, 2.25) |
| 11 – 15 | 3.66 (2.21, 6.05) | 3.12 (1.79, 5.45) | 2.34 (1.27, 4.30) | 3.76 (2.06, 6.87) | 2.50 (1.53, 4.08) | 1.98 (1.25, 3.14) |
| > 15 | 4.13 (2.52, 6.79) | 4.80 (2.83, 8.16) | 3.04 (1.68, 5.48) | 3.27 (1.96, 5.48) | 2.29 (1.32, 3.96) | 2.56 (1.67, 3.93) |
| ✓ p < 0.0001 | ✓ p < 0.0001 | ✓ p = 0.002 | ✓ p < 0.0001 | ✓ p = 0.001 | ✓ p = 0.0002 | |
|
| ||||||
| Demographic Characteristics | odds ratios (95% confidence intervals) | |||||
|
| ||||||
| Age, yrs | ||||||
| 65 – 69 | 1.00 | 1.00 | 1.00 | 1.00 | 1.00 | |
| 70 – 74 | 0.64 (0.45, 0.92) | 0.76 (0.52, 1.13) | 0.70 (0.46, 1.06) | 0.89 (0.64, 1.24) | 0.82 (0.62, 1.09) | |
| 75 – 79 | 0.44 (0.28, 0.69) | 0.45 (0.26, 0.79) | 0.52 (0.30, 0.87) | 0.59 (0.38, 0.90) | 0.62 (0.41, 0.93) | |
| ≥ 80 | 0.33 (0.19, 0.56) | 0.34 (0.20, 0.59) | 0.38 (0.20, 0.71) | 0.52 (0.31, 0.89) | 0.50 (0.31, 0.80) | |
| p = 0.0001 | p = 0.0003 | p = 0.02 | p = 0.03 | p = 0.004 | ||
|
| ||||||
| Male | 1.53 (1.04, 2.25) | |||||
| p = 0.03 | ||||||
|
| ||||||
| Married | 1.56 (1.13, 2.14) | |||||
| ✓ p = 0.007 | ||||||
|
| ||||||
| Education ≥ High School | 1.52 (0.98, 2.35) | 1.40 (0.97, 2.02) | 1.43 (0.97, 2.10) | |||
| p = 0.06 | p = 0.07 | (✓) p = 0.07 | ||||
|
| ||||||
| Household Income, $ | ||||||
| < 10 K | 1.00 | 1.00 | 1.00 | |||
| 10 – 25 K | 0.83 (0.53, 1.28) | 1.03 (0.61, 1.76) | 0.78 (0.50, 1.23) | 1.45 (0.88, 2.39) | ||
| 25 – 50 K | 0.96 (0.64, 1.43) | 0.85 (0.55, 1.30) | 0.74 (0.47, 1.15) | 1.54 (0.99, 2.40) | ||
| > 50 K | 2.45 (1.60, 3.74) | 1.93 (1.16, 3.22) | 1.69 (1.03, 2.77) | 2.25 (1.30, 3.88) | ||
| ✓ p < 0.0001 | ✓ p = 0.002 | ✓ p = 0.0001 | p = 0.03 | |||
|
| ||||||
| Clinical Characteristics | odds ratios (95% confidence intervals) | |||||
|
| ||||||
| Any Diabetic Complication | 1.39 (1.01, 1.89) | |||||
| (✓) p = 0.04 | ||||||
|
| ||||||
| SF-12 Physical | 1.04 (1.02, 1.07) | 1.03 (1.00, 1.05) | ||||
| ✓ p = 0.001 | p = 0.07 | |||||
|
| ||||||
| ADL Deficiencies | ||||||
| 0 | 1.00 | 1.00 | 1.00 | |||
| 1 | 0.85 (0.49, 1.47) | 1.09 (0.65, 1.84) | 0.76 (0.48, 1.21) | |||
| 2 – 6 | 0.45 (0.22, 0.92) | 0.33 (0.15, 0.72) | 0.38 (0.16, 0.89) | |||
| p = 0.09 | ✓ p = 0.01 | p = 0.07 | ||||
|
| ||||||
| Diabetes Duration, yrs | ||||||
| 0 – 5 | 1.00 | |||||
| 6 – 10 | 0.73 (0.45, 1.19) | |||||
| 11 – 15 | 0.89 (0.49, 1.62) | |||||
| > 15 | 1.25 (0.83, 1.88) | |||||
| ✓ p = 0.01 | ||||||
Univariate ordinal logistic regression of time trade-off utility on patient characteristics, with robust standard errors to incorporate clustering of patients within physicians.
Empty cells in the table correspond to non statistically significant associations.
None of the patient time trade-off utilities were significantly associated with race/ethnicity, wealth, needing help, or the Charlson Comorbidity Index.
Time trade-off utility categories for complications (approximate tertiles) : (i) < 0.10, (ii) .010 – 0.50, (iii) > 0.50
Time trade-off utility categories for treatments (approximate tertiles) : (i) < 0.55, (ii) 0.55 – 0.90, (iii) > 0.90
✓ Significant in multivariate model; (✓) indicate marginal significance (p ≤ 0.07 in all cases).
Physician Treatment Goals
Physicians estimated that nearly a third of the patients had a life expectancy of 5 years or less, a more pessimistic prognostication than their patients’ assessment (26%). Physicians aimed for a HbA1c ≤ 7% in 69% of their patients, systolic blood pressure ≤ 130 mm Hg in 70%, and LDL cholesterol ≤ 100 mg/dL in 82% (Table 3). The goal of preventing acute symptoms was thought to be extremely important 49% of the time. In contrast, the longer-term goal of preventing microvascular and macrovascular complications was thought extremely important in 29% of patients and very important in 44% of patients. Avoiding the burdens of treatment was thought extremely important in 18% of patients and somewhat important or unimportant in 35%. When asked what is the most aggressive hypoglycemic treatment they would consider for the particular patient, physicians stated oral hypoglycemic agents or 1 shot of insulin per day ± oral agents in 36%, 2 shots of insulin per day in 47% and 3 shots of insulin per day in 17%.
Table 3.
Relationship of Physician Treatment Goals and Approaches to Patient Characteristics and Patient Time Trade-off Utilities: Univariate Mixed Logistic Regression Analysis 1, 2, 3
| Dependent Variables: Physician Responses for Each Individual Patient
|
|||||||
|---|---|---|---|---|---|---|---|
| Prevention very or extremely important
|
Would consider Prescribing 2 or more Insulin shots per day4 | Target Treatment Goals
|
|||||
| Acute Symptoms | Micro/macro-vascular Complications | Treatment Burden | HbA1c ≤ 7% | Systolic Blood Pressure ≤ 130 mm Hg | LDL Cholesterol ≤ 100 mg/dL | ||
| Overall Percent | 87% | 73% | 65% | 64% | 69% | 70% | 82% |
| Life Expectancy | odds ratios (95% confidence intervals) | ||||||
|
| |||||||
| Physician Estimate, yrs | |||||||
| 0 – 5 | 1.00 | 1.00 | 1.00 | 1.00 | 1.00 | 1.00 | 1.00 |
| 6 – 10 | 2.12 (0.85, 5.26) | 5.72 (3.19, 10.3) | 0.49 (0.27, 0.90) | 1.87 (1.09, 3.21) | 2.64 (1.46, 4.76) | 2.30 (1.20, 4.41) | 2.79 (1.40, 5.56) |
| > 10 | 0.76 (0.29, 2.00) | 24.3 (9.19, 64.4)) | 0.21 (0.10, 0.43) | 4.05 (1.94, 8.45) | 5.72 (2.44, 13.4) | 1.79 (0.78, 4.09) | 6.92 (2.33, 20.5) |
| (✓) p = 0.09 | ✓ p < 0.0001 | ✓ p = 0.0002 | ✓ p = 0.0007 | ✓ p = 0.0001 | ✓ p = 0.04 | ✓ p = 0.001 | |
|
| |||||||
| Patient Estimate, yrs | |||||||
| 0 – 5 | 1.00 | 1.00 | 1.00 | 1.00 | 1.00 | 1.00 | |
| 6 – 10 | 1.70 (0.67, 4.36) | 2.40 (1.35, 4.29) | 0.81 (0.42, 1.56) | 2.09 (1.14, 3.83) | 2.55 (1.32, 4.93) | 0.79 (0.37, 1.68) | |
| > 10 | 3.36 (1.26, 8.96) | 5.13 (2.81, 9.36) | 0.53 (0.29, 0.97) | 2.64 (1.48, 4.71) | 2.20 (1.20, 4.02) | 1.87 (0.85, 4.11) | |
| p = 0.053 | ✓ p < 0.0001 | p = 0.10 | p = 0.003 | p = 0.01 | (✓) p = 0.06 | ||
|
| |||||||
| Demographic Characteristics | odds ratios (95% confidence intervals) | ||||||
|
| |||||||
| Age, yrs | |||||||
| 65 – 69 | 1.00 | 1.00 | 1.00 | 1.00 | 1.00 | 1.00 | |
| 70 – 74 | 0.60 (0.30, 1.20) | 2.30 (1.21, 4.39) | 0.62 (0.34, 1.15) | 1.37 (0.71, 2.64) | 0.57 (0.27, 1.18) | 0.78 (0.32, 1.91) | |
| 75 – 79 | 0.30 (0.15, 0.57) | 1.71 (0.89, 3.28) | 0.63 (0.33, 1.19) | 0.75 (0.39, 1.46) | 0.45 (0.21, 0.97) | 0.31 (0.13, 0.73) | |
| ≥ 80 | 0.07 (0.03, 0.16) | 3.43 (1.53, 7.68) | 0.25 (0.12, 0.53) | 0.44 (0.21, 0.94) | 0.27 (0.12, 0.65) | 0.17 (0.06, 0.45) | |
| p < 0.0001 | p = 0.01 | p = 0.005 | p = 0.03 | p = 0.02 | p = 0.001 | ||
|
| |||||||
| Male | 3.35 (1.59, 7.08) | ||||||
| ✓ p = 0.002 | |||||||
|
| |||||||
| Married | 1.96 (1.22, 3.13) | 1.83 (1.04, 3.20) | |||||
| p = 0.005 | ✓ p = 0.03 | ||||||
|
| |||||||
| High School Education | 2.07 (0.95, 4.49) | ||||||
| (✓) p = 0.07 | |||||||
|
| |||||||
| Wealth < $10,000 | 0.51 (0.29, 0.89) | ||||||
| ✓ p = 0.02 | |||||||
|
| |||||||
| Clinical Characteristics | odds ratios (95% confidence intervals) | ||||||
|
| |||||||
| Needs Help | 0.38 (0.18, 0.82) | 0.42 (0.26, 0.70) | 1.70 (0.97, 2.96) | 0.59 (0.36, 0.96) | 0.44 (0.26, 0.76) | ||
| ✓ p = 0.01 | p = 0.0007 | p = 0.06 | (✓) p = 0.03 | p = 0.003 | |||
|
| |||||||
| Any Diabetic Complication | 0.63 (0.40, 0.99) | 1.95 (1.17, 3.26) | |||||
| p = 0.047 | p = 0.01 | ||||||
|
| |||||||
| SF-12 Physical | 1.04 (1.00, 1.08) | ||||||
| p = 0.04 | |||||||
|
| |||||||
| ADL Deficiencies | |||||||
| 0 | 1.00 | 1.00 | 1.00 | 1.00 | |||
| 1 – 2 | 0.38 (0.16, 0.90) | 0.81 (0.46, 1.44) | 1.21 (0.65, 2.23) | 0.54 (0.29, 1.02) | |||
| 3 – 6 | 0.61 (0.10, 3.72) | 0.22 (0.07, 0.67) | 7.40 (1.62, 33.7) | 0.28 (0.08, 1.03) | |||
| p = 0.08 | p = 0.02 | p = 0.03 | p = 0.04 | ||||
|
| |||||||
| Charlson Comorbidity Index | |||||||
| 1 | 1.00 | 1.00 | 1.00 | 1.00 | |||
| 2 – 3 | 0.69 (0.35, 1.36) | 0.66 (0.34, 1.29) | 0.66 (0.34, 1.28) | 0.37 (0.17, 0.81) | |||
| ≥ 4 | 0.35 (0.18, 0.71) | 1.90 (0.92, 3.93) | 0.39 (0.19, 0.77) | 0.58 (0.26, 1.29) | |||
| p = 0.004 | ✓ p = 0.002 | p = 0.02 | ✓ p = 0.04 | ||||
|
| |||||||
| Diabetes Duration, yrs | |||||||
| 0 – 5 | 1.00 | ||||||
| 6 – 10 | 1.02 (0.55, 1.92) | ||||||
| 11 – 15 | 2.85 (1.35 6.01) | ||||||
| > 15 | 1.79 (0.98, 3.26) | ||||||
| ✓ p = 0.02 | |||||||
|
| |||||||
| Time Trade-off Utilities | odds ratios (95% confidence intervals) | ||||||
|
| |||||||
| Lower Leg Amputation5 | |||||||
| < 0.10 | 1.00 | 1.00 | 1.00 | ||||
| 0.10 – 0.50 | 1.74 (0.98, 3.10) | 1.05 (0.56, 1.99) | 2.25 (1.19, 4.23) | ||||
| > 0.50 | 1.89 (1.05, 3.41) | 0.53 (0.28, 1.01) | 1.81 (0.97, 3.37) | ||||
| p = 0.07 | ((✓)) p = 0.06 | ✓ p = 0.03 | |||||
|
| |||||||
| Conventional Treatment6 | |||||||
| < 0.55 | 1.00 | 1.00 | 1.00 | ||||
| 0.55 – 0.90 | 1.71 (0.92, 3.20) | 0.39 (0.19, 0.80) | 0.59 (0.29, 1.19) | ||||
| > 0.90 | 2.40 (1.35, 4.27) | 0.47 (0.24, 0.93) | 1.35 (0.70, 2.60) | ||||
| p = 0.01 | ((✓)) p = 0.03 | ✓ p = 0.03 | |||||
|
| |||||||
| Intensive Pill Treatment6 | |||||||
| < 0.55 | 1.00 | 1.00 | |||||
| 0.55 – 0.90 | 2.03 (1.05, 3.90) | 0.38 (0.18, 0.80) | |||||
| > 0.90 | 2.09 (1.18, 3.69) | 0.38 (0.19, 0.75) | |||||
| ✓ P = 0.03 | ((✓)) p = 0.01 | ||||||
|
| |||||||
| Intensive Insulin Treatment6 | |||||||
| < 0.55 | 1.00 | ||||||
| 0.55 – 0.90 | 0.52 (0.28, 0.99) | ||||||
| > 0.90 | 0.53 (0.29 0.94) | ||||||
| ((✓)) p = 0.045 | |||||||
|
| |||||||
| Intra-cluster correlation (range over models) | 0.59 – 0.63 | 0.21 – 0.28 | 0.50 – 0.54 | 0.35 – 0.37 | 0.38 – 0.45 | 0.63 – 0.65 | 0.50 – 0.55 |
Univariate mixed logistic regression of physician response on patient characteristics and time trade-off utilities, with physician entered as a random effect.
Empty cells in the table correspond to non statistically significant associations.
None of the physician goals and preferences were associated with patient race/ethnicity, income, SF12 – mental, or patient time trade-off utilities for blindness or kidney failure.
N = 461; excludes 12 patients in ‘other’ category
Time trade-off utility categories for complications (approximate tertiles) : (i) < 0.10, (ii) 0.10 – 0.50, (iii) > 0.50
Time trade-off utility categories for treatments (approximate tertiles) : (i) < 0.55, (ii) 0.55 – 0.90, (iii) > 0.90
✓ Significant in multivariate model; (✓) indicates marginal significance (p ≤ 0.07 in all cases); ((✓)) indicates any one of the covariates marked in this way may be included with life expectancy and Charlson Comorbidity Index in the model – no 2 patient utilities are significant together.
Physician treatment goals differed by specialty, with endocrinologists and general internists significantly more likely than geriatricians to rate preventing micro/macrovascular symptoms very or extremely important (OR 4.68, p<0.001) and to select target HbA1c ≤ 7% (OR 7.74, p = 0.002) and target systolic blood pressure ≤ 130 mm Hg (OR 8.28, p = 0.02). Endocrinologists were significantly more likely than either geriatricians or general internists to consider 2 or more insulin shots per day for their patients (OR=5.42, p = 0.001). Physician responses did not vary from early to later patients, as would occur if experience influenced their responses.
Association of Physician Treatment Goals with Patient Characteristics
The most consistent univariate correlate of more aggressive physician goals and treatment preferences was longer life expectancy (Table 3), followed by younger age. Estimates of patient life expectancy by both physicians and patients were associated with physician attitudes towards the importance of achieving specific treatment goals (Figure 2). Life expectancy was also the most powerful independent correlate in multivariate analysis (Table 3 and footnote explanation). Physicians were also more likely to choose more aggressive treatment goals and approaches for healthier patients – as assessed by diabetic complications, SF-12 physical health score, Charlson Comorbidity Index, ADL deficiencies, or needing help. Willingness to prescribe 2 or more insulin shots per day was also associated with longer duration of diabetes. In contrast to correlates of more aggressive treatment goals and preferences, importance to physicians of preventing treatment burden was positively associated with shorter life expectancy, being older, and having any diabetic complication, one or more ADL deficiencies, or higher Charlson Comorbidity Index, and marginally with needing help. Importance of preventing microvascular and macrovascular complications was associated with the greatest number of patient characteristics, followed by treatment burden, willingness to prescribe 2 or more insulin shots per day, and target HbA1c ≤ 7%. Physician goals were not associated with duration of the relationship between patient and physician. Neither duration of patient-physician relationship nor physician specialty modified the associations between physician goals and patient characteristics.
Figure 2.
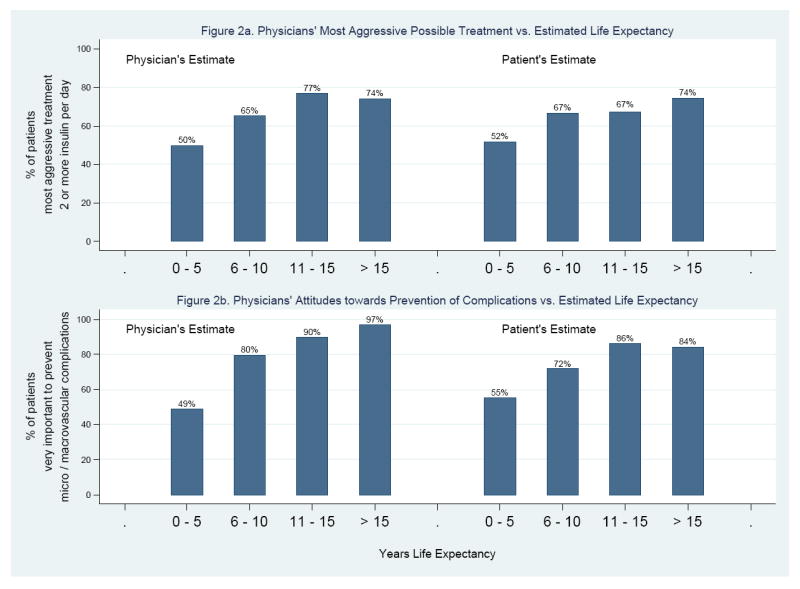
Physician Goals and Attitudes vs. Patient Life Expectancy
Association of Physician Treatment Goals with Patient Utilities for Diabetic Treatments and Complications
Physicians’ ratings of the importance of preventing microvascular and macrovascular complications and treatment burden were significantly associated with patients’ utilities for treatment, and marginally associated with their utilities for lower leg amputation (Table 3). Specifically, physicians were more likely to rate preventing complications as very or extremely important among patients who considered conventional treatment or intensive pill treatment closer to perfect health. Physicians were more likely to aim for HbA1c ≤ 7% among patients with higher utilities for amputation or conventional treatment. In contrast, physicians’ ratings of the importance of preventing treatment burden were inversely related to patient utilities for all three treatment approaches, and marginally so to patient utilities for amputation. These associations often remained significant in multivariate analysis (Table 3 and footnote explanation). No other significant associations between aggressiveness of treatment and patient utilities were observed. Associations between physician goals and patient utilities were not modified by physician specialty or duration of the physician-patient relationship.
Patient versus Physician-Level Variation
Most physicians with two or more patients in the study differentiated between their patients by selecting a range of values for estimated patient life expectancy (96%), importance of preventing micro- and macrovascular complications (94%), and most aggressive treatment they would consider (91%). A large majority differentiated with respect to importance of preventing acute symptoms (78%) and treatment burden (78%), and targeted HbA1c (82%) and systolic blood pressure (78%). However, over half (55%) selected 100 mg/dL as target LDL cholesterol value for all of their patients. As expected, dichotomized responses (e.g., target HbA1c ≤ 7%) were less heterogeneous and the estimated within-physician correlation in mixed logistic regression analysis was substantial, ranging from 0.21 for importance of preventing micro- and macrovascular complications to 0.65 for target systolic blood pressure (Table 3). Few physicians had patients with homogeneous clinical characteristics.
Discussion
California Healthcare Foundation / American Geriatrics Society and American Diabetes Association guidelines are major advances from earlier care recommendations that did not acknowledge the special considerations of older persons nor the heterogeneity of the geriatric population.7,8 The individualization of care of older persons with diabetes is a logical principle and a shared decision-making approach between clinician and patient should be part of this process.10 However, how the clinician should actually operationalize individualization of care for his or her older patients remains challenging.25
Acknowledging patient treatment preferences is believed to be an important element in determining the ideal treatment plan for individual patients but little is known about such preferences. Prior studies have assessed preferences/utilities in diabetic patients 26-35 but few have compared utilities of patients to those of physicians. On a population level, Landy et al. found that physicians gave lower time trade-off values to diabetic states compared to persons with diabetes who rated the same states.36 Heisler et al. asked diabetic patients and their physicians to rank their top three priorities for biomedical treatment goals and strategies, and found that overall agreement between them was low.37
Our study adds important information by describing variation in the preferences and approaches of older diabetic patients and their own physicians. We incorporate subjective expected utility theory and examine the concordance of their views. Several important points are apparent. First, much variation exists in the utilities patients place on different diabetic complications and styles of treatment. It is striking how a complication such as lower leg amputation can vary so widely in how patients rate it. Of note, treatments such as insulin are thought by patients to have significant adverse effects on quality of life. Thus, the nature, potential burdens, and patient perceptions of different treatment options should be openly discussed.
Second, expected life expectancy and age are the most powerful independent correlates of patient utilities for diabetic complications and treatments, suggesting that on average patients are incorporating global prognosis into their preferences as recommended by the new geriatric guidelines. However, the association of income greater than $50,000 with higher utilities for diabetic complications and the trend for high school graduation to be correlated with higher utilities for treatment approaches raise the possibility of differential understanding and impact of complications and treatments by socioeconomic status. More research needs to explore these possible disparities in older diabetic persons. In addition, the wide variation within strata defined by demographic and clinical characteristics of patients supports the importance of actively discussing preferences with patients as opposed to using relatively crude proxy traits to assume patients’ wishes. Interestingly, life expectancy as measured by patients is correlated with their utilities, but life expectancy as estimated by physicians is not. Patients generally are more optimistic regarding life expectancy than physicians. In contrast, physician treatment goals are correlated with estimates of patient life expectancy by both patient and physician.
Third, even though this is an elderly patient population, clinicians most commonly aim for the standard American Diabetes Association target goals of glycemic, blood pressure, and cholesterol control, and there are relatively few instances where clinicians aim for less intensive targets. For many older patients with diabetes, the standard American Diabetes Association targets are probably a reasonable default. However, in cases where the treatment regimen becomes onerous, has significant side effects, affects quality of life adversely, or is unlikely to significantly alter quality or quantity of life, striving for the standard targets may be problematic.10
Fourth, physicians’ treatment goals and approaches were associated with patients’ utilities for treatment. These correlations as well as the association between physician-estimated life expectancy and patient treatment attitudes suggest that physicians in our study generally have a good understanding of their patients in formulating their management approaches or possibly have influenced their patients’ beliefs. These findings are consistent with physicians practicing according to the basic principles of the geriatric diabetes care guidelines. Conversely, the relatively high percentages of physicians aiming for intensive treatment targets raises the questions of whether they are truly individualizing care and engaging in shared decision making. Moreover, the traditional focus of diabetes management is on risk factor control and prevention of complications, even though other goals such as independence may be most valued by older persons.38 The shared decision-making process might improve by also including discussion of overall life goals, better prognostic data, and consideration of patient preferences towards different treatment approaches and diabetic complications.
Our study has several limitations. Patient utilities provide information suggesting what patients might be expected to do based on a set of theoretical assumptions about their preferences and behaviors chosen rationally to realize those preferences. However, what patients actually do may depend on other factors, such as costs or departures from “rational” decisions.39 Another limitation of our study is that it examines only a single predominantly African-American, urban population at an academic center. Our study examines patient utilities and physician preferences at one time point and does not incorporate long-term benefits and costs of different treatment approaches, for example as modeled in cost-effectiveness analysis.40,41 Incorporating utilities into a decision-analytic cost-effectiveness framework might help clarify why variations in some utilities have little effect on overall patient preferences among treatments. In addition, the order in which questions were asked to patients could affect results, and we do not have actual disease severity information on visual impairment and amputation, nor data on physician characteristics. Nonetheless, our study is one of the first to examine the concordance of patient and physician preferences in the care of older persons with diabetes, and is useful for exploring challenges in operationalizing geriatric-specific diabetes guidelines.42
Older diabetic patients with multiple comorbidities are complex and frequently a poor fit for clinical practice guidelines designed for younger people. Geriatric-specific diabetes guidelines are an advance, but often difficult to operationalize. A shared decision-making process that incorporates scientific evidence, clinical judgment, and patient preferences may enhance the likelihood that care approaches are optimal for individuals. Decision aids or computer support to elicit patient preferences and utilities and provide better prognostic data may be avenues to improve the doctor-patient encounter and shared decision-making process within the time constraints of the office visit.43-45
Acknowledgments
Supported by the National Institute on Aging (R01 AG17872-01), National Institute of Diabetes and Digestive and Kidney Diseases Diabetes Research and Training Center (P60 DK20595). Dr. Chin is supported by a Midcareer Investigator Award in Patient-Oriented Research from the National Institute of Diabetes and Digestive and Kidney Diseases (K24 DK071933). Drs. Chin and Meltzer were Robert Wood Johnson Generalist Physician Faculty Scholars, and Dr. Huang was supported by a NIA Geriatric Academic Program Award (K12 AG00488) and a NIA Career Development Award (K23 AG021963).
Footnotes
Presented in part at the 2004 American Diabetes Association meeting, Orlando, Florida, 2002 American Diabetes Association meeting, Philadelphia, Pennsylvania, and 2001 Midwest Society of General Internal Medicine meeting, Chicago, Illinois.
References
- 1.Mokdad AH, Ford ES, Bowman BA, et al. Diabetes trends in the U.S.: 1990-1998. Diabetes Care. 2000;23:1278–1283. doi: 10.2337/diacare.23.9.1278. [DOI] [PubMed] [Google Scholar]
- 2.Harris MI, Flegal KM, Cowie CC, et al. Prevalence of diabetes, impaired fasting glucose, and impaired glucose tolerance in U.S. adults. The Third National Health and Nutrition Examination Survey, 1988-1994. Diabetes Care. 1998;21:518–524. doi: 10.2337/diacare.21.4.518. [DOI] [PubMed] [Google Scholar]
- 3.Kenny SJ, Aubert RE, Geiss LS. Prevalence and incidence of non-insulin-dependent diabetes. In: Harris MI, Cowie CC, Stern MP, editors. Diabetes in America. 2. Washington, D.C.: U.S. Government Printing Office; 1995. pp. 47–67. NIH publ no 95-1468. [Google Scholar]
- 4.Welch HG, Albertsen PC, Nease RF, et al. Estimating treatment benefits for the elderly: the effect of competing risks. Ann Intern Med. 1996;124:577–584. doi: 10.7326/0003-4819-124-6-199603150-00007. [DOI] [PubMed] [Google Scholar]
- 5.Bertoni AG, Krop JS, Anderson GF, et al. Diabetes-related morbidity and mortality in a national sample of U.S. elders. Diabetes Care. 2002;25:471–475. doi: 10.2337/diacare.25.3.471. [DOI] [PubMed] [Google Scholar]
- 6.Chin MH, Su AW, Jin L, et al. Variations in the care of elderly persons with diabetes among endocrinologists, general internists, and geriatricians. J Gerontol Med Sci. 2000;55A:M601–M606. doi: 10.1093/gerona/55.10.m601. [DOI] [PubMed] [Google Scholar]
- 7.California Healthcare Foundation/American Geriatrics Society Panel on Improving Care for Elders with Diabetes. Guidelines for improving the care of the older person with diabetes mellitus. J Am Geriatr Soc. 2003;51(suppl):S265–S280. doi: 10.1046/j.1532-5415.51.5s.1.x. [DOI] [PubMed] [Google Scholar]
- 8.American Diabetes Association. Clinical practice recommendations 2007. Diabetes Care. 2007;30(suppl 1):S1–S103. [PubMed] [Google Scholar]
- 9.Solomon DH, Wenger NS, Saliba D, et al. Appropriateness of quality indicators for older patients with advanced dementia and poor prognosis. J Am Geriatr Soc. 2003;51:902–907. doi: 10.1046/j.1365-2389.2003.513331.x. [DOI] [PubMed] [Google Scholar]
- 10.Chin MH, Polonsky TS, Thomas VD, et al. Developing a conceptual framework for understanding illness and attitudes in older, urban African Americans with diabetes. Diabetes Educator. 2000;26:439–449. doi: 10.1177/014572170002600311. [DOI] [PubMed] [Google Scholar]
- 11.Mossey JM, Shapiro E. Self-rated health: a predictor of mortality among the elderly. Am J Public Health. 1984;72:800–808. doi: 10.2105/ajph.72.8.800. [DOI] [PMC free article] [PubMed] [Google Scholar]
- 12.Ware JE, Jr, Kosinski M, Keller SD. SF-12: How to Score the SF-12 Physical and Mental Health Summary Scales. Second Edition. Boston, MA: The Health Institute, New England Medical Center; 1995. [Google Scholar]
- 13.Katz S, Ford AB, Moskowitz RW, et al. Studies of illness in the aged. The Index of ADL: a standardized measure of biological and psychosocial function. JAMA. 1963;185:914–919. doi: 10.1001/jama.1963.03060120024016. [DOI] [PubMed] [Google Scholar]
- 14.Redelmeier DA, Detsky A. A clinician’s guide to utility measurement. Prim Care. 1995;22:271–281. [PubMed] [Google Scholar]
- 15.Naglie G, Krahn MD, Naimark D, et al. Primer on medical decision analysis: part 3 – estimating probabilities and utilities. Med Decis Making. 1997;17:136–141. doi: 10.1177/0272989X9701700203. [DOI] [PubMed] [Google Scholar]
- 16.Drummond MF, O’Brien BJ, Stoddart GL, et al. Methods for the Economic Evaluation of Health Care Programmes. Second. Oxford: Oxford University Press; 1999. pp. 143–149. [Google Scholar]
- 17.Lenert L, Kaplan RM. Validity and interpretation of preference-based measures of health-related quality of life. Med Care. 2000;38(9 Suppl):II138–150. doi: 10.1097/00005650-200009002-00021. [DOI] [PubMed] [Google Scholar]
- 18.Hunink MGM, Glasziou PP, Siegel JE, et al. Decision Making in Health and Medicine: Integrating Evidence and Values. Cambridge, United Kingdom: Cambridge University Press; 2001. Valuing outcomes; pp. 88–127. [Google Scholar]
- 19.Charlson ME, Pompei P, Ales KL, MacKenzie CR. A new method of classifying prognostic comorbidity in longitudinal studies: development and validation. Journal of Chronic Diseases. 1987;40(5):373–383. doi: 10.1016/0021-9681(87)90171-8. [DOI] [PubMed] [Google Scholar]
- 20.McCullagh P, Nelder JA. Generalized Linear Models. 2. London: Chapman and Hall; 1989. [Google Scholar]
- 21.McCullagh P. Regression Models for ordinal data (with Discussion) Journal of the Royal Statistical Society, Series B. 1983;42:109–142. [Google Scholar]
- 22.Pendergast JF, Gange SJ, Newton MA, et al. A survey of methods for analyzing clustered binary response data. International Statistical Review. 1996;64:89–118. [Google Scholar]
- 23.Diggle PJ, Liang K-Y, Zeger SL. Analysis of Longitudinal Data. Oxford: Clarendon Press; 1994. [Google Scholar]
- 24.StatCorp, College Station, Texas, 2004.
- 25.Huang ES, Gorawara-Bhat R, Chin MH. Practical challenges of individualizing diabetes care in older patients. Diabetes Educator. 2004;30:558–570. doi: 10.1177/014572170403000407. [DOI] [PubMed] [Google Scholar]
- 26.Sharma S, Oliver-Fernandez A, Bakal J, et al. Utilities associated with diabetic retinopathy: results from a Canadian sample. Br J Ophthalmol. 2003;87:259–261. doi: 10.1136/bjo.87.3.259. [DOI] [PMC free article] [PubMed] [Google Scholar]
- 27.Brown MM, Brown GC, Sharma S, et al. Utility values and diabetic retinopathy. Am J Ophthal. 1999;128:324–330. doi: 10.1016/s0002-9394(99)00146-4. [DOI] [PubMed] [Google Scholar]
- 28.Brown MM, Brown GC, Sharma S, et al. Quality of life associated with visual loss: a time tradeoff utility analysis comparison with medical health states. Ophthalmology. 2003;110:1076–1081. doi: 10.1016/S0161-6420(03)00254-9. [DOI] [PubMed] [Google Scholar]
- 29.Sullivan SD, Lew DP, Devine EB, et al. Health state preference assessment in diabetic peripheral neuropathy. Pharmacoeconomics. 2002;20:1079–1089. doi: 10.2165/00019053-200220150-00004. [DOI] [PubMed] [Google Scholar]
- 30.Tennvall GR, Apelqvist J. Health-related quality of life in patients with diabetes mellitus and foot ulcers. Journal of Diabetes and its Complications. 2000;14:235–241. doi: 10.1016/s1056-8727(00)00133-1. [DOI] [PubMed] [Google Scholar]
- 31.Coffey JT, Brandle M, Zhou H, et al. Valuing health-related quality of life in diabetes. Diabetes Care. 2002;25:2238–2243. doi: 10.2337/diacare.25.12.2238. [DOI] [PubMed] [Google Scholar]
- 32.Clarke P, Gray A, Holman R. Estimating utility values for health states of type 2 diabetic patients using the EQ-5D (UKPDS 62) Med Decis Making. 2002;22:340–349. doi: 10.1177/0272989X0202200412. [DOI] [PubMed] [Google Scholar]
- 33.Brown GC, Brown M, Sharma S, et al. Quality of life associated with diabetes mellitus in an adult population. Journal of Diabetes and its Complications. 2000;14:18–24. doi: 10.1016/s1056-8727(00)00061-1. [DOI] [PubMed] [Google Scholar]
- 34.Wexler DJ, Grant RW, Wittenberg E, et al. Correlates of health-related quality of life in type 2 diabetes. Diabetologia. 2006;49:1489–1497. doi: 10.1007/s00125-006-0249-9. [DOI] [PubMed] [Google Scholar]
- 35.Huang ES, Brown SE, Ewigman BG, Foley EC, Meltzer DO. Patient perceptions of quality of life with diabetes-related complications and treatments. Diabetes Care. 2007 July 10; doi: 10.2337/dc07-0499. published online. [DOI] [PMC free article] [PubMed] [Google Scholar]
- 36.Landy J, Stein J, Brown MM, et al. Patient, community and clinician perceptions of the quality of life associated with diabetes mellitus. Med Sci Monit. 2002;8:CR543–548. [PubMed] [Google Scholar]
- 37.Heisler M, Vijan S, Anderson RM, et al. When do patients and their physicians agree on diabetes treatment goals and strategies, and what difference does it make? J Gen Intern Med. 2003;18:893–902. doi: 10.1046/j.1525-1497.2003.21132.x. [DOI] [PMC free article] [PubMed] [Google Scholar]
- 38.Huang ES, Gorawara-Bhat R, Chin MH. Self-reported goals of older type 2 diabetes patients. J Am Geriatr Soc. 2005;53:306–311. doi: 10.1111/j.1532-5415.2005.53119.x. [DOI] [PMC free article] [PubMed] [Google Scholar]
- 39.Drummond MF, O’Brien BJ, Stoddart GL, et al. Cost-utility analysis. In: Drummond MF, O’Brien BJ, Stoddart GL, et al., editors. Methods for the Economic Evaluation of Health Care Programmes. Second. Oxford: Oxford University Press; 1999. pp. 143–149. [Google Scholar]
- 40.Gold MR, Seigel JE, Russell LB, et al., editors. Cost-effectiveness in Health and Medicine. New York: Oxford University Press; 1996. [Google Scholar]
- 41.Huang ES, Shook M, Jin L, et al. The impact of patient utilities on the cost-effectiveness of intensive glucose control in older type 2 diabetes patients. Diabetes Care. 2006;29:259–264. doi: 10.2337/diacare.29.02.06.dc05-1443. [DOI] [PMC free article] [PubMed] [Google Scholar]
- 42.Huang ES. Goal setting in older adults with diabetes. In: Munshi MN, Lipsitz LA, editors. Geriatric Diabetes. New York: Informa Healthcare USA; 2007. pp. 271–282. [Google Scholar]
- 43.O’Connor AM, Stacey D, Entwistle V, et al. Decision aids for people facing health treatment or screening decisions. Cochrane Database Syst Rev. 2003;(2):CD001431. doi: 10.1002/14651858.CD001431. [DOI] [PubMed] [Google Scholar]
- 44.O’Connor AM, Legare F, Stacey D. Risk communication in practice: the contribution of decision aids. BMJ. 2003;327:736–740. doi: 10.1136/bmj.327.7417.736. [DOI] [PMC free article] [PubMed] [Google Scholar]
- 45.Edwards A, Thomas R, Williams R, et al. Presenting risk information to people with diabetes: evaluating effects and preferences for different formats by a web-based randomized controlled trial. Patient Educ Couns. 2006;63:336–349. doi: 10.1016/j.pec.2005.12.016. [DOI] [PubMed] [Google Scholar]