

Abstract
Electrochemical detection is becoming increasingly important for the detection of biological species. Most current biological research with electrochemical detection is done with carbon fiber electrodes due to their many beneficial properties. The ability to build electrochemical sensor from noble metals instead of carbon fibers may be beneficial in developing inexpensive multiplexed electrochemical detection schemes. To advance understanding and to test the feasibility of using noble metal electrochemical sensors the detection of dopamine, a biologically important small molecule was studied here. Specifically, dopamine detection on gold microelectrodes was characterized and compared to P-55 carbon fiber microelectrodes of the same geometry, using background subtracted fast scan cyclic voltammetry. While not as sensitive to dopamine as carbon fibers, it was observed that gold microelectrodes have six times the saturation coverage per area and 40 times the linear working range. Selectivity to dopamine, in comparison to several other neurotransmitters and their derivatives, is also quantitatively described.
1. Introduction
Recent developments in electrode fabrications, such as microfabrication and surface modifications (such as self assembled monolayers), have reinvigorated an electrochemical interest in noble metals for use in neurobiological applications [1–7]. Although many detection techniques are available for the in vivo detection of neurotransmitters, few are able to determine an analyte-selective response with subsecond temporal resolution. For years background subtracted fast scan cyclic voltammetry (FSCV) has been used to identify and distinguish readily-oxidizable biological compounds; namely catecholamines [8–10]. Electrochemical characterization of catecholamine oxidation on carbon fiber microelectrodes has been well described, and recently optimized using FSCV [11]. It has not, however, been used to fully investigate surface interactions on noble metal electrodes that have different electrochemical properties, such as gold. Gold electrodes, while not as ideal as carbon fibers for FSCV in vivo measurements, provide an easy platform for electrode surface modifications and microfabricated electrode arrays.
The catecholamine dopamine has been widely and extensively studied as a result of its multifaceted importance within neurobiological systems. Aside from being a precursor to epinephrine and norepinephrine, dopamine (DA) also has an essential role in the neurological reward centers and pathways; specifically the substantia nigra, caudate-putamen, ventral tegmental area and nucleus accumbens [12–17]. Dopaminergic neurons in such areas release the respective neurotransmitter into the synaptic cleft which cause a measurable, subsecond, change in concentration [16]. In addition, defects in the dopaminergic pathways are associated with neurological disorders such as Parkinson’s disease, ADHD and drug addiction [18–20]. In vivo and in vitro DA has been extensively studied using carbon fiber microelectrodes and FSCV. This extensive knowledge, in addition to its biological importance, makes dopamine an optimal choice to characterize gold microelectrodes while comparing them to carbon fiber microelectrodes using FSCV.
Adsorption, which causes a preconcentration of analyte on the electrode surface prior to oxidation, can have numerous causes and is responsible for a variety of kinetic responses. Using background subtracted FSCV, Bath et al. characterized the adsorption of dopamine onto a carbon fiber surface and hypothesized that protonated catecholamines adsorb to oxide groups on the carbon surface. They also showed that adsorption causes a decrease in response time, however an increase in signal was seen [21]. Heien et al also described the adsorptive nature of DA on over-oxidized carbon fibers. Their study concluded that adsorptive electrostatic forces between protonated DA and the working electrode partially resulted from holding the working electrode at a negative potential in reference to Ag/AgCl [11].
The ability to easily microfabricate gold has made it a prime candidate for wide range of electrochemical studies, including multi-electrode arrays with the ability to detect and differentiate multiple neurotransmitters [2, 4, 5]. Gold also possesses beneficial surface properties that, for example, enable it to covalently bond to thiol groups, which form self-assembled monolayers (SAMs); making it an ideal metal for a variety of electrochemical sensors [22]. Adsorption of catecholamines on gold has been characterized using slow scan cyclic voltammetry and ellipsometry; however, these techniques do not allow subsecond dopamine detection, and do not provide the necessary selectivity and sensitivity for real-time in vivo detection [23]. In addition, utilization of chronoamperometry in combination with gold electrodes for in vivo use must be further modified for analyte selectivity [4].
Because the electrochemical properties of gold differ from those of carbon fibers, it is necessary to kinetically characterize electroactivity of dopamine on gold using FSCV before proceeding with other projects. This study characterizes gold microelectrodes using the FSCV method, and as a reference, compares them to carbon fiber microelectrodes.
2. Experimental
2.1. Chemicals
All chemicals described herein were obtained from Sigma-Aldrich (St. Louis, MO) and used as received. Aqueous solutions were prepared using doubly distilled water. A TRIS buffer solution (pH 7.4) consisting of 15 mM TRIS, 140 mM NaCl, 3.25 mM KCL, 1.2 mM CaCl2, 1.25 mM NaH2PO4, 1.2 mM MgCl2 and 2.0 mM Na2SO4 was used as a carrier for dopamine injection analysis. This buffer resembles the ionic composition of an in vivo cerebral-spinal environment, and thus was selected for the carrier stream. Solutions of 1mM potassium ferrocene carboxylic acid were prepared in 1 M potassium chloride, in order to assess the kinetics of the gold and carbon electrodes.
2.2. Flow injection apparatus
As previously described [11, 21, 24] a flow injection system was constructed using a 6 port injection valve (Upchurch Scientific model V-451) positioned atop a two position pneumatic actuator (Rheodyne model 5701). The pneumatic actuator was used in conjunction with a 12 volt solenoid valve kit (Rheodyne, Rohnert Park, CA), at 40 psi. A variable resistance infusion pump (Harvard apparatus, Holliston, MA) was used to introduce the analyte and carrier stream to the electrode surface, which was situated in an electrochemical cell, at a constant rate of 2 mL/min.
2.3. Electrodes
All carbon fiber P-55 discs microelectrodes were constructed as previously described [25]. An isolated carbon fiber was aspirated into a glass capillary and pulled using a micropipette puller (Narashige, Tokyo, Japan). The electrodes were then sealed with an epoxy resin (Epon 828 with 15% m-phenlylenediamine by weight, Miller Stephenson Chemical Co., Danbury, CT), and polished using a diamond coated polishing wheel (Sutter Instruments). Carbon electrodes were backfilled with a 4 M potassium acetate/0.15M potassium chloride solution. Stainless steel wires were then inserted for electrical contact.
The gold disc microelectrodes were manufactured as previously described by bonding the 25 µm and 200 µm diameter gold wire (99.99%, Goodfellow Limited, England) to a stainless steel wire via silver epoxy (H20-PFC, EPO-TEK, Billerica, MA), then inserting them into a soft-glass capillary [26]. Proper insulation was insured by melting the glass around the gold with a heating coil. The electrodes were then finely polished using alumina slurries (Buehler, Lake Bluff, Illinois) with three subsequent size particles 1, 0.3, 0.05 µm. To ensure a clean surface the electrodes were repolished using the 0.05 µm slurry and rinsed with doubly distilled water prior to all experiments.
2.4. Data Acquisition
In order to minimize external electrical noise all flow injection analysis was performed inside a grounded Faraday cage and referenced to a Ag/AgCl electrode (Bioanalytical Systems, West Lafayette, IN). Background subtracted cyclic voltammograms were obtained using the EI 400 (Ensman Instrumentation, Bloomington, IN) in combination with custom LABVIEW (National Instruments, Austin, TX) programming, and locally constructed hardware; as previously described [11, 27]. Data was filtered, at 2 Hz, using a low-pass filter within the software.
3. Results and Discussion
3.1. Response of Gold and Carbon Fiber electrodes
In order to properly characterize dopamine adsorption on gold electrodes using FSCV a potential window for gold had to be determined. The optimal scan range for carbon fiber microelectrodes in physiological buffer was applied to the gold electrodes to observe the limit of the gold electrodes (figure 1) [11].
Figure 1.
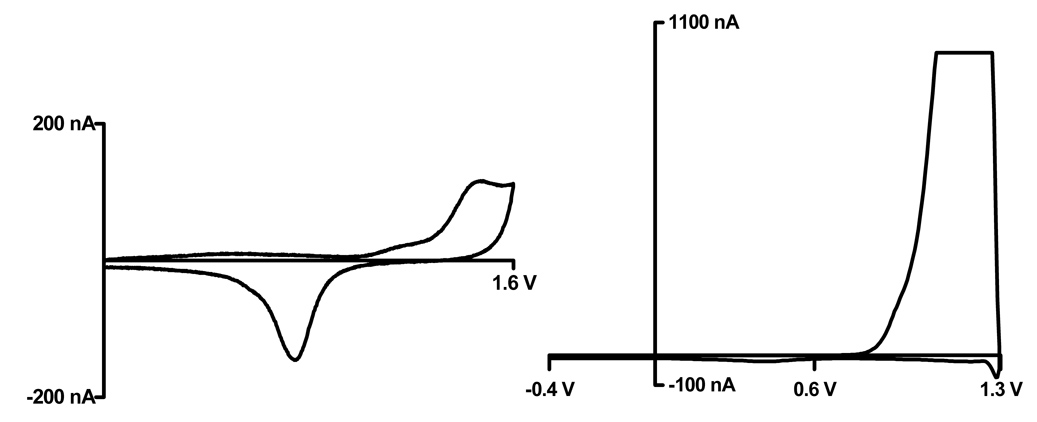
Determination of potential scan limits on gold microelectrodes. (left) Cyclic voltammogram of 25 µm gold electrode in 0.1 M perchloric acid (right) Physiological TRIS buffer (pH 7.4) (peak current saturated the amplifier) Scan rate: 0.1 V/s
A typical cyclic voltammogram for a gold electrode in 0.1 M perchloric acid is shown in figure 1, to the right is a voltammogram in chloride containing TRIS buffer. This buffer is used because its ionic composition closely resembles that of an in vivo environment. However, in TRIS buffer, a corrosion current was observed around 1.1 V vs Ag/AgCl, when scanning in the anodic direction. This is consistent with the potential for chloride oxidation, which is described by the following reaction:
The data suggests that the anodic scan limit for gold electrodes should not exceed 0.7 V vs. Ag/AgCl. An electrode holding potential of −0.2 V and a sweep to a peak potential of 0.6 V vs. Ag/AgCl seemed rational, and was implemented for the remainder of the experiments. The smaller scan range is certainly a drawback, however the faster electron kinetics of gold compensate for this and allow electroactive species, like dopamine, to be detected within a smaller potential window.
To compare faradic reactions using the fast scan technique, FSCV’s of a ferrocenecarboxylic acid solution were recoded for 25 µm and 200 µm diameter gold surface and compared to that of a P-55 carbon (~10 µm in diameter) electrode surface (figure 2).
Figure 2.
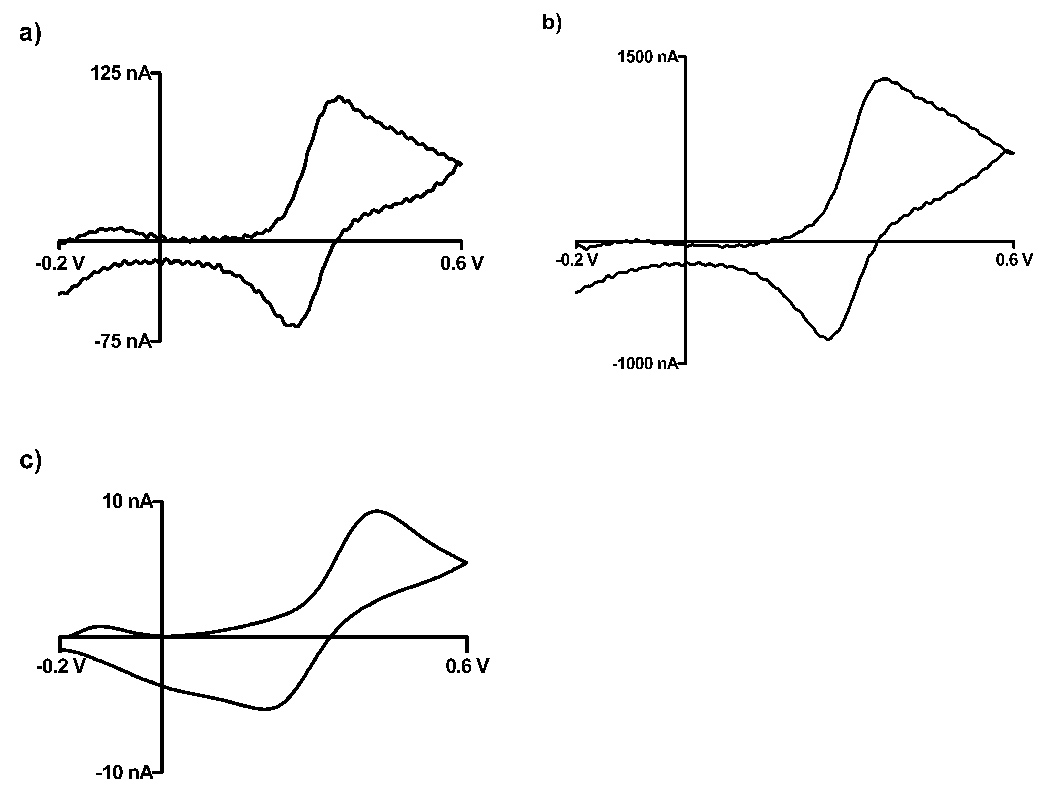
Comparison of voltammograms at gold and carbon fiber disk microelectrodes. Background subtracted cyclic voltammograms of Ferrocenecarboxylic acid in 1 M KCL, scan rate: 100 V/s for (a) 25 µm Au (b) 200 µm and (c) Carbon P-55 discs.
Peak current separations were used to characterize the electron transfer kinetics for the desired material. The separations were comparable for the different size gold electrodes, at 80 ± 4 mV and 93 ± 2 mV for the 25 µm diameter and 200 µm diameter, respectively. The difference in peak location can be accounted for by the fact that smaller electrodes minimize iR drop in resistive solutions; thus allowing a smaller peak separation [28]. Carbon fibers show a slower response, exhibited by its peak separation of 206 mV ± 3 mV. The slower kinetics of carbon compared to gold has been previously observed [26, 29, 30] and confirms the ability to detect analytes in a smaller potential window on a gold surface.
3.2. Adsorption of DA at gold surface
A significant factor affecting the kinetic response of microelectrodes is the adsorption of species from solution onto the electrode surface. Here, the adsorption of DA to gold electrodes from solution will be investigated. For detailed information on the adsorption of DA to carbon fiber electrodes see Heien et al. and Bath et al. [11, 21]. Polished gold electrodes are thought to develop an oxide monolayer that forms when cycled in electrolytic solution [31]. Oxide layers have been shown to increase adsorption of cationic species such as dopamine, which undergoes protonation in physiological pH. [21]. In addition, electrostatic forces between the negative holding potential on the electrode surface and protonated dopamine have been implicated in increased adsorption [11].
In FSCV, peak currents for adsorptive species are linearly proportional to the scan rate applied to the electrode, whereas currents of non adsorbing analytes are proportional to the square root of the scan rate, the equations are as follows [28]:
| (1) |
| (2) |
As seen above, another linear relationship in FSCV exists between peak faradaic current and electrode surface area. Figure 3 shows peak currents plotted as a function of scan rate to test for linearity of dopamine adsorption on the gold electrode surface. Also included in this figure are representative voltammogramms for a 5 second bolus injection of 10 µM dopamine on 25 µm (c) and 200 µm (d) diameter gold electrodes at a scan rate of 100 V/s.
Figure 3.
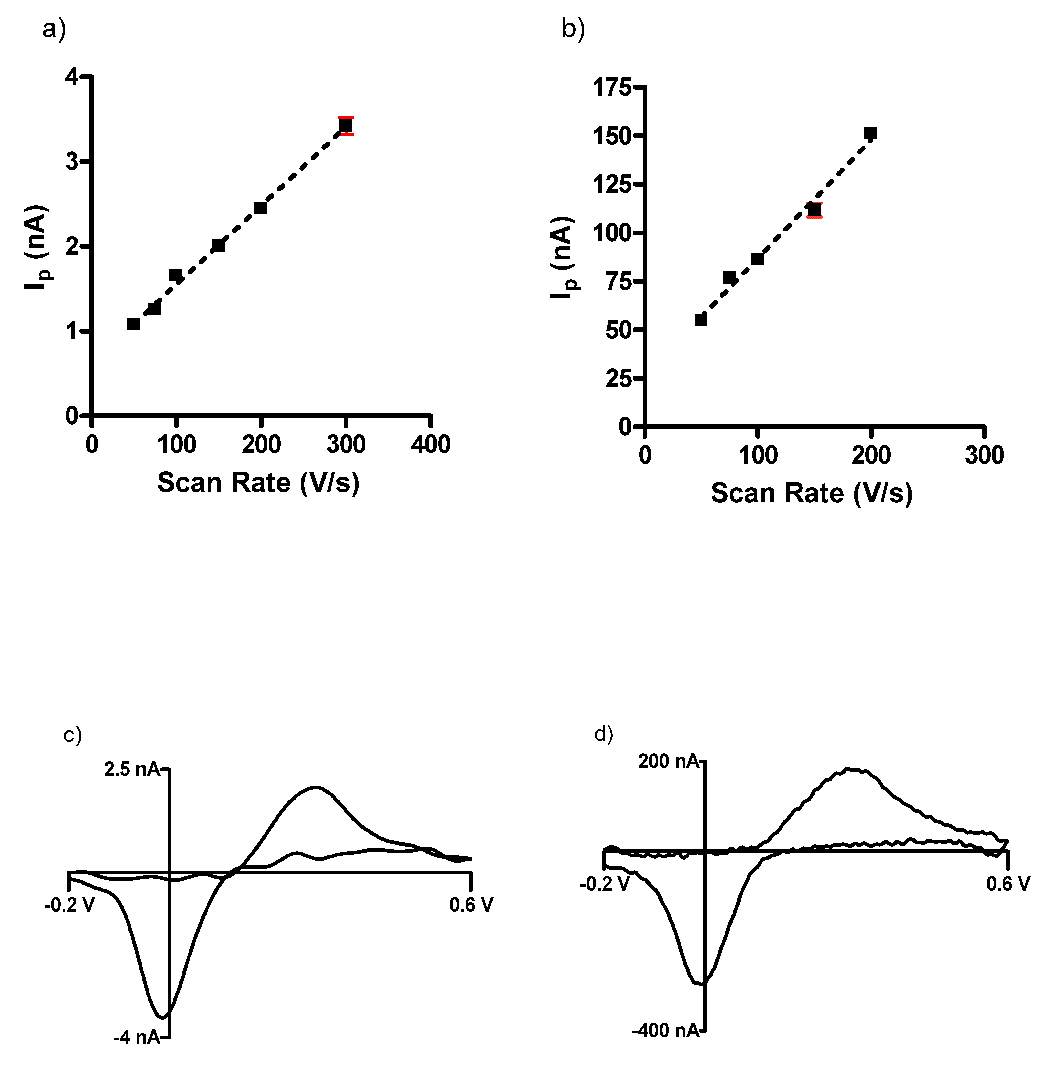
Characterization of DA adsorption. (a,b) Peak faradaic currents as a function of scan rate for 25 and 200 µm diameter gold disc electrodes. (n = 4 for each data point, standard error represented by error bars) (c,d) fast scan cyclic voltammograms in response to a 10 µM dopamine injection on 25 µm diameter and 200 µm diameter gold electrodes. Scan Rate: 100 V/s in TRIS buffer, pH 7.4.
The linear relationship that exists between scan rate and peak current for both 25 µm and 200 µm diameter electrodes confirms that dopamine behaves like an adsorptive species on the gold surface. P-55 disc carbon fiber microelectrodes exhibit a similar linear response, and are able to be scanned at a higher rate due to the larger potential window of carbon [21]. It was also observed that the peak current response to dopamine increases proportional to the area on gold electrodes. The oxidation and reduction peaks of dopamine were located at 0.299 ± 0.03 V and −0.028 ± 0.004 V, respectively, for the 25 ìm diameter electrodes; while the 200 µm diameter electrodes exhibited peaks at 0.33 ± 0.03 V and −0.051 ± 0.001 V(n = 8, 4 electrodes). The peak separations for the 25 µm electrodes were smaller than those of the 200 µm, again this is due to the minimization of the iR drop, and therefore an increase in kinetic transfer rate, with smaller electrodes. The relative error of the peak potentials was small (< 4 mV) illustrating that reproducible results are possible on a single electrode.
To further characterize the adsorption of dopamine on the gold electrodes plots of peak faradaic current vs. dopamine concentration were created and fitted to the Langmuir isotherm governed by the equation:
| (3) |
In figure 4, peak currents were measured as a result of injecting dopamine concentrations ranging from 1 µM to 5000 µM. The dashed line illustrates diffusion-controlled currents created by the digital simulation program DigiSim®. This line was then digitally subtracted from the observed data to obtain the adsorptive constituent.
Figure 4.

Construction of Langmuir adsorption isotherm. (a) Graph of peak current vs. dopamine concentration on 25 µm diameter gold electrode. Dashed line represents simulated diffusion controlled responses. (b) The dashed line represents the Langmuir isotherm model using β = 4.36 × 10⁻⁴ cm3 pmol−1 and Γs = 637.6 pmol cm−2 upon which the experimental data points fall. (c) Linear range of dopamine detection on gold electrodes. Scan rate: 100 V/s in TRIS buffer (pH 7.4). Standard error is represented by the error bars (n = 4).
Using elipsometry, Zerbino et al. described a weak adsorption of dopamine on gold resulting from incipient oxide layer formation [31]. The Langmuir isotherm is generally suitable for weak adsorption; as it assumes that all adsorption sites are equivalent and that the ability of a particle to adsorb is not hindered by the occupation of a nearby binding site. In figure 4(b), it can be seen that the isotherm data fits the isotherm when the apparent capacitance (β) and the saturation coverage (Γs) equal 4.36 × 10⁻⁴ cm3 pmol−1 and 637.6 pmol cm−2; respectively. In comparison to carbon fibers, the data suggests that the saturation coverage is about 6 times higher on the gold microelectrodes then on carbon fiber microelectrodes, per cm2. This is in accordance with proposed theories which state that adsorption binding sites on treated carbon electrodes are limited, namely, to carbonyl groups and oxidized areas [11, 32, 33]. If the entire gold surface develops an oxide monolayer, as Zerbino et al. suggests, it would explain the higher in saturation coverage.
Figure 4(c) shows the linear range of dopamine on gold electrodes. Carbon electrodes exhibit a linear range up to 5 µM [11, 24]. The present results show a 40 fold increase in a linear working range for dopamine (~200 µM) having a slope of 1.24 × 10⁻³ cm. Although this far exceeds the necessary range for in vivo measurements, it could be useful for applications that require a large dynamic range of dopamine detection. The slope of this curve indirectly relates to the sensitivity of the electrode. Heien et al. reported that the over oxidation of the carbon fiber surface yielded a slope of 6.4 × 10⁻³ cm, compared to the 1.0 × 10⁻³ cm slope observed using the traditional waveform [11]. The current data suggests that sensitivity to dopamine on gold microelectrodes is comparable to carbon fibers using the traditional waveform. The gold electrodes are, however, about five times less sensitive than carbon fibers using the extended waveform.
3.3. Selectivity
A good electrochemical sensor should not only be sensitive to the analyte of interest, but also selective for that compound. The brain contains many readily-oxidizable compounds that may interfere with dopamine detection. Some of these interferents were analyzed individually in order to obtain representative voltammograms. The ability to distinguish dopamine from these interferents was then determined by comparing the dopamine voltammogram to that of the interferent. This analysis is valid for voltammograms containing one electroactive species, not deconvoluting CV’s with multiple components. Specfically, the degree of selectivity was examined by comparing the CV’s of dopamine to those of the metabolic products of dopamine (3-MT, DOPAC), other neurotransmitters (epinephrine, norepinephrine (NE), serotonin (5-HT), one of its metabolites 5-hydroidole acetic acid (5-HIAA)), as well as other oxidizable biological substances (uric acid(UA), and ascorbic acid (AA)).
Figure 5 shows the representative CVs of the aforementioned analytes in physiological TRIS buffer (pH 7.4). The cyclic voltammograms for these analytes on P-55 carbon fiber disc electrodes were previously preformed [11]. Concentrations were also increased 5 fold to fully characterize the cyclic voltammograms on gold electrodes, although dopamine was detected with concentrations as little as 500 nM. Panel A shows a typical CV for dopamine, while panels b and c show DOPAC and 3-MT (4-hydroxy-3methoxyphenylethylamine), respectively. In an in vivo rat model, DOPAC and 3-MT are metabolized from dopamine. The cyclic voltammograms for both of these metabolites can be distinguished from dopamine on gold microelectrodes.
Figure 5.
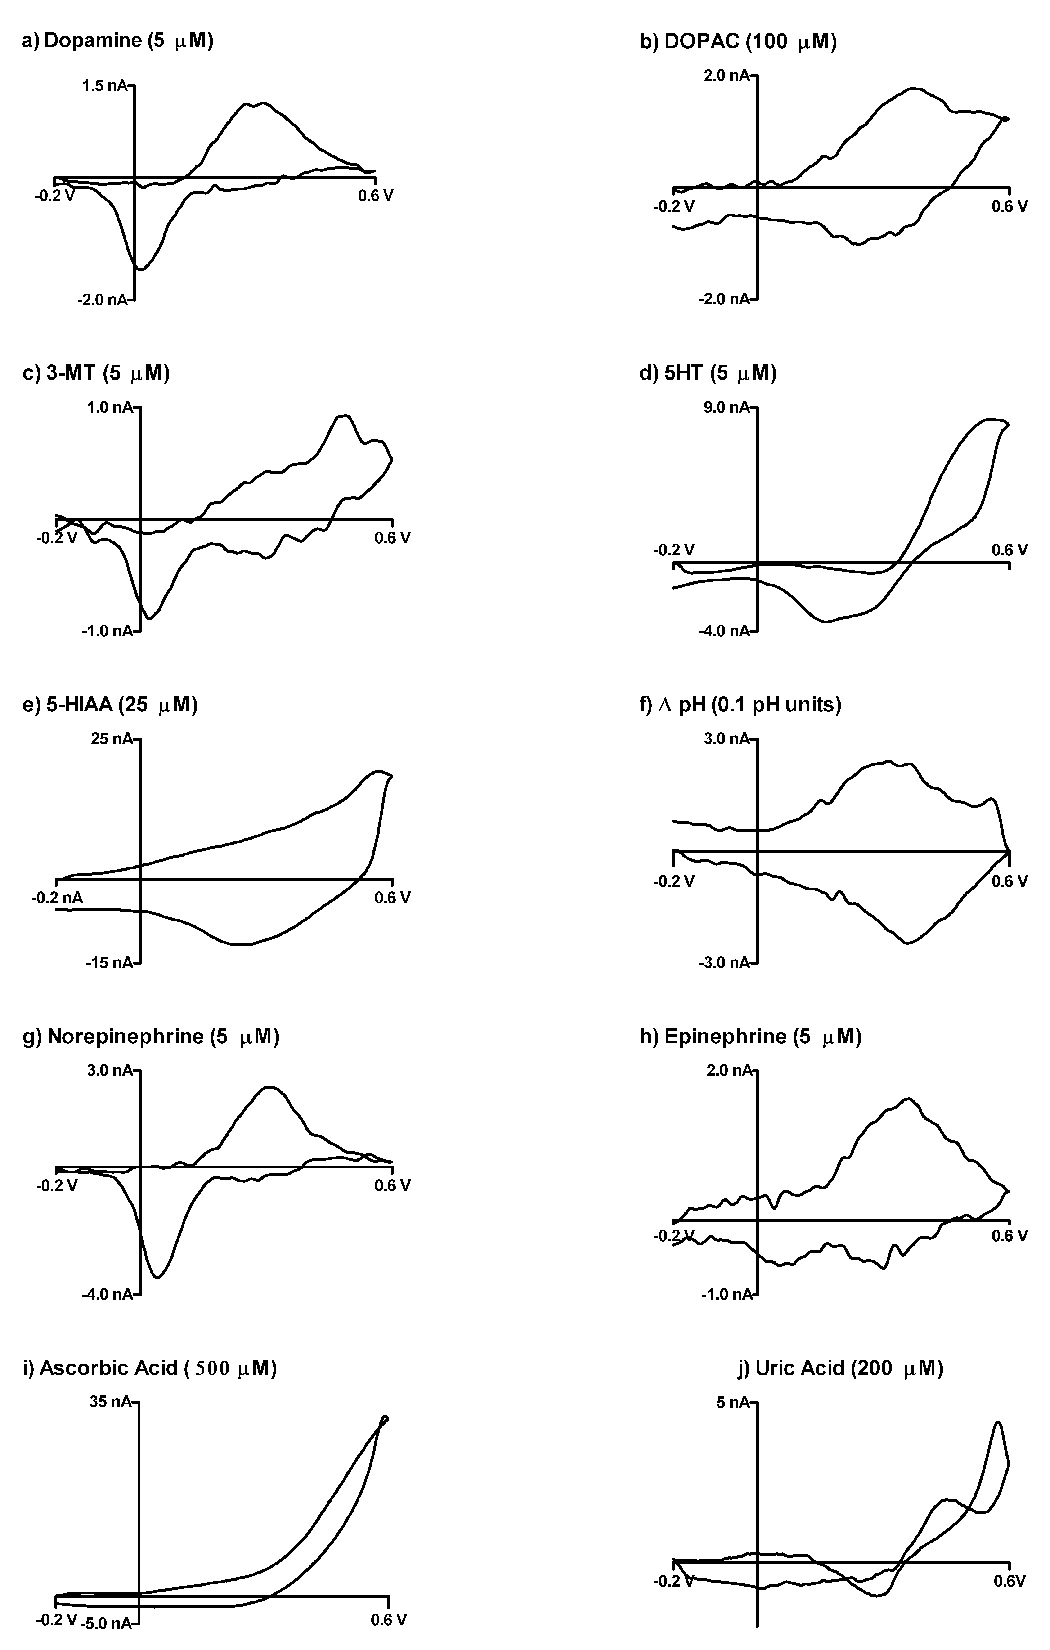
Fast scan cyclic voltammograms for various compounds on gold microelectrodes. All cyclic voltammograms were taken 300 ms after introduction to electrode surface. Scan rate: 100 V/s in TRIS buffer (pH 7.4)
Panels d and e show cyclic voltammograms for the neurotransmitter serotonin and its metabolite 5-HIAA (5-hydoxyindole acetic acid). The voltammograms of these two analytes can be distinguished from that of dopamine. The position of the oxidation and reduction peaks of these voltammograms, as with carbon fibers, are located at more positive potentials than that of dopamine.
Representative voltammograms for norepinephrine and epinephrine are shown in panel f and g. It is very difficult to distinguish the voltammograms of norepinephrine and dopamine, a trend also observed on carbon fibers. However, in contrast to carbon fibers, the voltammogram of epinephrine exhibits a very insensitive response from that of dopamine. This insensitivity on gold electrodes has been observed previously on gold using slow scan CV [34, 35]. In 2003, Zeng et al. showed that the oxidation of epinephrine on a bare gold electrode is a diffusion controlled process, as the peak current increased linearly with the square root of the scan rate. This effect could be a result of the methyl side chain, which exists on the protonated side of epinephrine, interfering with adsorption on the gold surface.
In vivo pH changes have been recorded using carbon fiber microelectrodes and have also been shown to change as a result of blood vessel dilation and electrical stimulation of dopaminergic neurons [36]. Panel f shows a typical background subtracted cyclic voltammogram for a 0.1 unit pH shift on a gold microelectrode. A measurable change is observed and is comparable to carbon fibers in this potential window. This “signal” is presumably due to a change in capacitance caused by an pH dependent alteration of the absorptive properties on the gold surface becomes apparent by background subtraction [24]. In 1999, Runnels et al. reported that electrolysis of oxide groups on a carbon fiber surface contributes to a measurable change in pH [37]. It is plausible that a similar mechanism exists on the gold surface as well.
Cyclic voltammograms of ascorbic and uric acid (panels i and j) were also recorded. These electroactive species are common in an in vivo environment and are commonly thought of as interferents when trying to isolate a dopaminergic signal. The voltammograms of these analytes were analogous to those recorded on carbon fiber microelectrodes using the extended waveform [11].
FSCV is able to distinguish different compounds in vivo based on the shape and location of the oxidation potential for a respective analyte. To quantitatively compare the CV shapes of these analytes to DA, correlation coefficients were calculated (table 1) [16, 38]. To do this, a template CV of dopamine was recorded at each electrode and digitally compared to the CVs of the other analytes. This is done by normalizing the oxidation peak amplitude to that of dopamine, then calculating the r value for each voltammogram. The r value was used instead of the r2 in order to assess a negative correlation between voltammograms. An increased correlation coefficient indicates that the analyte produces a voltammogram that is more comparable to dopamine. As with P-55 carbon fiber disc electrodes, norepinephrine exhibited the highest correlation compared to dopamine (r = 0.95) followed by epinephrine at (r = 0.85). Interestingly, these compounds are nearly identical on carbon fibers (data not shown). Comparing the above table to that produced by Hermans et al. shows one significant discrepancy between gold and carbon fiber microelectrodes[24]. The voltammogram of serotonin (5-HT) produced on a gold surface yields a correlation coefficient of r = 0.34 ± 0.02 compared to 0.81 ± 0.05 on carbon fibers. This, in all probability, is caused by the decreased range of the potential window altering the voltammogram.
Table 1.
Correlation coefficients (r) relating the cyclic voltammograms of dopamine to those of various electroactive compounds shown in figure 5 on gold disc microelectrodes. Each analyte measurement was normalized to the recorded dopamine response for that electrode. (n = 6, 2 measurements from 3 electrodes). Error measurements are the standard deviations of the respective means.
| DOPAC | 3-MT | 5-HT | 5-HIAA | Δ pH (basic) | NE | Epinephrine | AA | Uric Acid |
|---|---|---|---|---|---|---|---|---|
| 0.67 ± 0.03 | 0.74 ± 0.04 | 0.34 ± 0.02 | 0.67 ± 0.07 | −0.53 ± 0.03 | 0.95 ± 0.01 | 0.85 ± 0.03 | 0.29 ± 0.07 | 0.51 ± 0.02 |
In physiological pH the analytes that contained protonated amine groups (dopamine, 3-MT, serotonin, and norepinephrine) exhibited voltammograms that had defined oxidation and reduction peaks within the potential window. In contrast, analytes that do not have the protonated amine group (epinephrine, DOPAC, Ascorbic Acid, Uric Acid) exhibited amorphous voltammograms or those with oxidation and reduction peaks outside the potential window of gold. The results indicate that other analytes that experience protonation of their amine groups, like DA, experience a preaccumulation on the electrode surface prior to oxidation; thus, are able to be identified using FSCV on a gold surface.
4. Conclusion
This report characterized the detection of dopamine on the gold surface for two sizes of disk electrodes (25 µm and 200 µm diameter) using background subtracted fast scan cyclic voltammetry. The collected data was compared to the well studied process of using FSCV on carbon fiber microelectrodes. After an acceptable potential scan window was determined, adsorption of dopamine on gold was characterized. The saturation coverage as well as the linear range of dopamine on gold was found to be much higher than on carbon fibers. Typical voltammograms for other analytes were also recorded to test the selectivity of gold in respect to dopamine. It was observed that analytes with protonated amine end groups produced clear voltammograms. In general, gold electrodes exhibited a similar selectivity in comparison to P-55 carbon fibers. Some exceptions were noted and attributed to more selective adsorption properties or using a smaller potential window.
Although not the optimal choice for neurotransmitter detection using FSCV (due to lower sensitivity using the extended waveform, gold possesses unique properties that allow it to be easily modified. These modifications provide multiple platforms that could possibly enhance the specificity and selectivity of real time neurotransmitter detection. These results provide a basis for using the FSCV method in conjunction with modified gold electrodes in the future.
Acknowledgements
The authors would like to acknowledge financial support from NIH (NS 15841) to RMW and from NIH (DA023586) to MKZ.
Footnotes
Publisher's Disclaimer: This is a PDF file of an unedited manuscript that has been accepted for publication. As a service to our customers we are providing this early version of the manuscript. The manuscript will undergo copyediting, typesetting, and review of the resulting proof before it is published in its final citable form. Please note that during the production process errors may be discovered which could affect the content, and all legal disclaimers that apply to the journal pertain.
References
- 1.Cosofret VV, Erdosy M, Johnson TA, Buck RP, Ash RB, Neuman MR. Anal. Chem. 1995;67:1647–1653. [Google Scholar]
- 2.Burmeister JJ, Gerhardt GA. Anal. Chem. 2001;73:1037–1042. doi: 10.1021/ac0010429. [DOI] [PubMed] [Google Scholar]
- 3.Whitesides GM, Ostuni E, Takayama S, Jiang X, Ingber DE. Annual Review of Biomedical Engineering. 2001;3:335–373. doi: 10.1146/annurev.bioeng.3.1.335. [DOI] [PubMed] [Google Scholar]
- 4.Burmeister JJ, Gerhardt GA. Trends in Analytical Chemistry. 2003;22:498–502. [Google Scholar]
- 5.Day BK, Pomerleau F, Burmeister JJ, Huettl P, Gerhardt GA. J. Neurochem. 2006;96:1626–1635. doi: 10.1111/j.1471-4159.2006.03673.x. [DOI] [PubMed] [Google Scholar]
- 6.Palyvoda O, Chen C-C, Auner GW. Biosensors and Bioelectronics. 2007;22:2346–2350. doi: 10.1016/j.bios.2006.08.021. [DOI] [PubMed] [Google Scholar]
- 7.Schäferling M, Riepl M, Pavlickova P, Paul H, Kambhampati D, Liedberg B. Microchim. Acta. 2003;142:193–203. [Google Scholar]
- 8.Armstrong-James M, Millar J, Kruk ZL. Nature. 1980;288:181–183. doi: 10.1038/288181a0. [DOI] [PubMed] [Google Scholar]
- 9.Stamford JA, Kruk ZL, Millar J, Wightman RM. Neurosci. Lett. 1984;51:133–138. doi: 10.1016/0304-3940(84)90274-x. [DOI] [PubMed] [Google Scholar]
- 10.Heien MLAV, Johnson MA, Wightman RM. Anal. Chem. 2004;76:5697–5704. doi: 10.1021/ac0491509. [DOI] [PubMed] [Google Scholar]
- 11.Heien MLAV, Phillips PEM, Stuber GD, Seipel AT, Wightman RM. Analyst. 2003;128:1413–1419. doi: 10.1039/b307024g. [DOI] [PubMed] [Google Scholar]
- 12.Venton BJ, Wightman RM. Synapse. 2007;61:37–39. doi: 10.1002/syn.20343. [DOI] [PubMed] [Google Scholar]
- 13.Garris PA, Ciolkowski EL, Pastore P, Wightman RM. J. Neurosci. 1994;14:6084–6093. doi: 10.1523/JNEUROSCI.14-10-06084.1994. [DOI] [PMC free article] [PubMed] [Google Scholar]
- 14.Robinson DL, Venton BJ, Heien ML, Wightman RM. Clin. Chem. 2003;49:1763–1773. doi: 10.1373/49.10.1763. [DOI] [PubMed] [Google Scholar]
- 15.Schultz W. Nat. Rev. Neurosci. 2000;1:199–207. doi: 10.1038/35044563. [DOI] [PubMed] [Google Scholar]
- 16.Venton BJ, Wightman RM. Anal. Chem. A-Pages. 2003;75:414A–421A. [Google Scholar]
- 17.Waelti P, Dickinson A, Schultz W. Nature. 2001;412:43–48. doi: 10.1038/35083500. [DOI] [PubMed] [Google Scholar]
- 18.Cooper JS, Bloom FE, Roth RH. The biological basis of Neuropharmacology. Oxford: Oxford University Press; 1996. [Google Scholar]
- 19.Phillips PE, Stuber GD, Heien ML, Wightman RM, Carelli RM. Nature. 2003;422:614–618. doi: 10.1038/nature01476. [DOI] [PubMed] [Google Scholar]
- 20.Biederman J, Faraone SV. The Lancet. 2005;366:237–248. doi: 10.1016/S0140-6736(05)66915-2. [DOI] [PubMed] [Google Scholar]
- 21.Bath BD, Michael DJ, Trafton BJ, Joseph JD, Runnels PL, Wightman RM. Anal. Chem. 2000;72:5994–6002. doi: 10.1021/ac000849y. [DOI] [PubMed] [Google Scholar]
- 22.Bakker E, Qin Y. Anal. Chem. 2006;78:3965–3984. doi: 10.1021/ac060637m. [DOI] [PMC free article] [PubMed] [Google Scholar]
- 23.Raj CR, Okajima T, Ohsaka T. J. Electroanal. Chem. 2003;543:127–133. [Google Scholar]
- 24.Hermans A, Seipel AT, Miller CE, Wightman RM. Langmuir. 2006;22:1964–1969. doi: 10.1021/la053032e. [DOI] [PMC free article] [PubMed] [Google Scholar]
- 25.Kawagoe KT, Zimmerman JB, Wightman RM. J. Neurosci. Methods. 1993;48:225–240. doi: 10.1016/0165-0270(93)90094-8. [DOI] [PubMed] [Google Scholar]
- 26.Hermans A, Wightman RM. Langmuir. 2006;22:10348–10353. doi: 10.1021/la061209e. [DOI] [PMC free article] [PubMed] [Google Scholar]
- 27.Michael DJ, Joseph JD, Kilpatrick MR, Travis ER, Wightman RM. Anal. Chem. 1999;71:3941–3941. doi: 10.1021/ac990491+. [DOI] [PubMed] [Google Scholar]
- 28.Bard AJ, Faulkner LR. Electrochemical Methods. New York: Wiley; 2001. [Google Scholar]
- 29.Cline KK, Mcdermott MT, Mccreery RL. J. Phys. Chem. 1994;98:5314–5319. [Google Scholar]
- 30.Deakin MR, Stutts KJ, Wightman RM. J. Electroanal. Chem. 1985;182:113–122. [Google Scholar]
- 31.Zerbino JO, Sustersic MG. Langmuir. 2000;16:7477–7481. [Google Scholar]
- 32.Chen PH, Fryling MA, Mccreery RL. Anal. Chem. 1995;67:3115–3122. [Google Scholar]
- 33.Vasquez RE, Imai H. Bioelectrochemistry and Bioenergetics. 1985;14:389–403. [Google Scholar]
- 34.Zeng B, Zhao YYF. Electroanalysis. 2003;15:1054–1059. [Google Scholar]
- 35.Yue Bai J, Wang L, Jing Wang H, Fei Huang P, Qing Zhao Y, Di Fan S. Microchimica Acta. 2006;156:321–326. [Google Scholar]
- 36.Venton BJ, Zhang H, Garris PA, Phillips PE, Sulzer D, Wightman RM. J. Neurochem. 2003;87:1284–1295. doi: 10.1046/j.1471-4159.2003.02109.x. [DOI] [PubMed] [Google Scholar]
- 37.Runnels PL, Joseph JD, Logman MJ, Wightman RM. Anal. Chem. 199;71:2782–2789. doi: 10.1021/ac981279t. [DOI] [PubMed] [Google Scholar]
- 38.Troyer KP, Heien ML, Venton BJ, Wightman RM. Curr. Opin. Chem. Biol. 2002;6:699–703. doi: 10.1016/s1367-5931(02)00374-5. [DOI] [PubMed] [Google Scholar]