

Abstract
Oncolytic viral therapy is under evaluation for toxicity and efficacy in clinical trials relating to several different tumors. We report a significant increase in the angiogenic index of oncolytic virus (OV)-treated glioma-matrigel implants (2.83-fold, P < 0.02). In a rat intracranial glioma model, large tumors from OV-treated animals were significantly more angiogenic than the phosphate-buffered saline (PBS)-treated control tumors (OV: 101 ± 21.6; PBS: 19.8 ± 10; P = 0.0037). Transcript profiling of OV-treated tumors revealed dysregulation of several transcripts involved in glioma angiogenesis. OV-mediated induction of CYR61 gene expression (8.94-fold, P = 0.001) correlated significantly with the presence of OV in tumor tissue in vivo (R = 0.7, P < 0.001). Further, induction of CYR61 mRNA and protein were confirmed in multiple human cancer cell lines and primary human tumor-derived cells in vitro, and in tumor lysate and cerebrospinal fluid (CSF) in vivo. Finally, we show that treatment of glioma cells with Cilengitide, known to counter CYR61-induced integrin activation, significantly suppressed the proangiogenic effect of OV treatment of gliomas (P < 0.05).
Introduction
Gliomas are the most common primary tumor of the central nervous system, and glioblastoma multiforme is the most aggressive form (World Health Organization grade IV) of malignant astrocytoma, with the worst prognosis and median survival of <1 year.1 Current treatments are merely palliative and only marginally impact patient survival. However, the elucidation of various molecular genetic alterations characteristic of gliomas has led to the design and testing of targeted therapeutics that have been effective in animal models of cancer, but whose efficacy has remained unproven in clinical trials. The aggressive nature of the disease underscores the need for design and testing of biological therapies such as oncolytic viruses (OVs).
Oncolytic viral therapy exploits the natural or engineered propensity of some viruses to replicate in cancer cells, causing their lytic destruction with minimal damage to non-neoplastic tissue. The inherent ability of herpes simplex viruses (HSVs) to infect a wide variety of tumors, combined with their cytolytic nature and their ability to persist as episomes, makes them very suitable for use in the development of OV therapy. Also, anti-herpetic drugs are available to keep undesirable viral replication in check.2 The results of several ongoing clinical trials have confirmed the safety of OV therapy, but the expectations of a significant clinical response from this strategy have yet to be realized. Nevertheless, highly innovative strategies to enhance OV infection, efficacy, and spread through the neoplasm continue to be investigated.3,4 For example, the impact of oncolytic virotherapy on the tumor microenvironment has not been investigated yet in any great detail.
Host immune responses to OV infection of tumors are perceived to be detrimental because they orchestrate rapid viral clearance, but they are beneficial as well because they set the stage for a systemic antitumor immune response.5 The physiological response to infection and injury often includes vasodilatation, hyperpermeability, and angiogenesis.6 We have recently described a significant increase in tumor vascular permeability and a concurrent increase in host inflammatory cells consequent to OV treatment.7,8 Tumors infiltrating inflammatory cells are also known to alter the normal homeostasis between pro- and antiangiogenic factors.9 We postulated that the oncolytic HSV-1 treatment of intracranial tumors would also alter the tumor angiotome (secreted proteins involved in angiogenesis) resulting in changes in secreted angiogenic and angiostatic factors.
In this study we demonstrate the increase in the angiogenic potential of glioma cells infected with OV and the increase in microvessel density (MVD) in tumors after OV therapy as compared to untreated tumors. An evaluation of the changes in gene expression of several secreted angiogenic and antiangiogenic factors revealed a significant induction of CYR61 in vivo. We also demonstrate a significant positive correlation between the expression of CYR61 and the amount of virus present in tumor tissue in vivo.
Results
OV treatment of human glioma xenografts induces neoangiogenesis
In order to test the impact of OV treatment on angiogenesis, we compared the angiogenic potential of OV-treated human glioma LN229 cells with that of phosphate-buffered saline (PBS)-treated cells in a Direct In Vivo Angiogenesis Assay (DIVAA). Angioreactors filled with LN229 glioma cells suspended in basement membrane extracts were treated either with the OV rHSVQ1 [multiplicity of infection (MOI = 1)] or with PBS, and were implanted into the rear flanks of athymic nude mice. The mice were killed 15 days later, and the angioreactors were examined visually in order to assess the amount of angiogenesis initiated into each tube through the open end (Figure 1a). The amount of hemoglobin (Hb) in each tube was quantified using the Wako Hb B kit (Figure 1b). Visually, only one of the nine tubes containing PBS-treated glioma cells showed evidence of blood vessel formation inside the tube (arrow head), while six of the nine tubes containing rHSVQ1-treated LN229 cells treated showed evidence of blood vessel growth inside the tubes (arrow head). Quantification of Hb confirmed a statistically significant increase in angiogenesis in the OV-treated angioreactors (P < 0.02). These results suggest that OV treatment of human glioma xenografts induces an angiogenic response.
Figure 1. Treatment of human glioma cells with oncolytic virus (OV) increases their angiogenic potential.
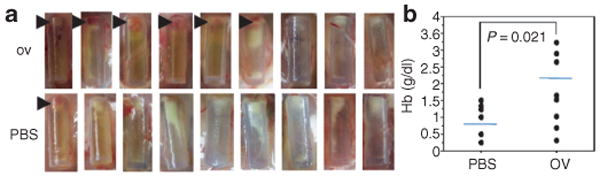
(a) Images of individual angioreactors containing HSVQ-treated (top) or phosphate-buffered saline (PBS)-treated LN229 glioma cells at the time of harvesting. Briefly, angioreactors filled with LN229 glioma cells treated with either PBS or HSVQ (n = 9/group) were implanted subcutaneously in athymic nude mice. Fifteen days after implantation, the angioreactors were harvested and analyzed visually for blood vessels that had developed into the tubes. The presence of visually obvious initiation of blood vessels into six of the nine HSVQ-treated angioreactors and into one of the nine PBS-treated angioreactors are indicated by arrow heads. (b) Quantification of hemoglobin (Hb) in angioreactors treated with HSVQ or PBS. The contents of the individual angioreactors were isolated and the amount of Hb in each tube was quantified. Note the significantly higher values of Hb in angioreactors filled with HSVQ-treated LN229 cells as compared to values in angioreactors with PBS-treated LN229 cells (2.58 times higher, P < 0.021). HSV-1, herpes simplex virus 1.
We tested the impact of OV treatment on tumor angiogenesis after oncolysis of intracranial glioma in immune-competent rats. Seven days after intracranial tumor implantation, rats were treated with either PBS or hrR3. PBS-treated animals died of tumor burden, with a median survival of 13 days. Rats treated with hrR3 survived significantly longer than the PBS-treated rats (P < 0.001, Figure 2a). In order to evaluate the effect of oncolysis on the angiogenesis of tumors, we compared the MVD in tumors from PBS-treated and OV-treated animals dying of tumor burden (days 12–14 for PBS-treated rats and days 16–18 for OV-treated rats). Fluorescent microscope analysis of the perfused vasculature in representative tumor sections from rats treated with PBS exhibited decreased MVD as compared to tumor sections from rats treated with OV (Figure 2b). Quantitatively, there was a statistically significant increase in MVD in gliomas treated with OV (P = 0.005, Figure 2c), indicating that OV treatment of glioma results in increased angiogenesis.
Figure 2. Induction of angiogenesis in oncolytic virus (OV)-treated tumors in a syngeneic rat glioma model.
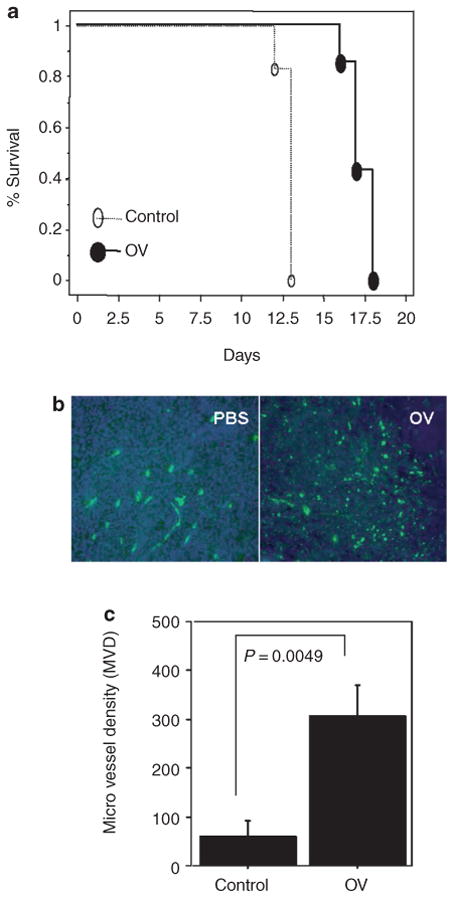
(a) Kaplan–Meier analysis of rats with brain tumors treated with phosphate-buffered saline (PBS) or hrR3. Seven days after intracranial tumor implantation (D74/HveC glioma cells), rats were treated with PBS or hrR3 by direct intratumoral injection. All the rats were monitored closely and killed when they showed signs of morbidity. Note the significant increase in survival of tumor bearing rats treated with hrR3 as compared to PBS-treated rats (P = 0.0006). (b) Fluorescent microscopy images of tumor sections derived from PBS- or OV-treated animals at the time of killing the animals. Rats, with intracranial tumors treated with PBS or hrR3, were killed when they displayed signs of morbidity. Five minutes before being killed, the rats were injected with fluorescein isothiocyanate–conjugated dextran by tail-vein injection. Brain sections from the animals were analyzed by fluorescence microscopy for perfused blood vessels. Note the substantial increase in vascular density in OV-treated tumors as compared to PBS-treated tumors. (c) Quantification of microvessel density (MVD) in tumor sections from rats treated with PBS or hrR3. Note the significant increase in MVD in tumors of OV-treated rats (P = 0.0049).
Changes in expression of secreted angiogenic factors consequent to OV therapy
Taken together with our findings published earlier,7 the totality of these results provides evidence for a model in which OV-induced lysis produces initial hyperpermeability in tumors, followed by a process of angiogenesis. In order to examine this further, we investigated changes induced in glioma angiotome consequent to OV treatment in vivo. Seven days after intracerebral tumor implantation, rats were treated with PBS or hrR3 (an HSV-1-derived OV).10,11 The animals were killed 12 hours after OV infection, and the harvested tumor tissue was evaluated using quantitative real-time PCR (QRT-PCR) for changes in expression of the indicated genes implicated in glioma angiogenesis and/or HSV-1 pathology. Only 3 of the 10 genes analyzed were significantly dysregulated consequent to OV infection of tumor tissue (Table 1). Among these, the antiangiogenic factor TSP-1 was downregulated (0.53, P = 0.005), whereas angiogenic factors CYR61 (8.94-fold, P = 0.0012) and Ang-2 (3.73-fold, P = 0.0028) were significantly upregulated in OV-treated tumor tissue as compared to tissue from PBS-treated control animals. These findings showed that a relatively rapid response to OV treatment of gliomas consisted of changes in transcript levels in respect of 3 of the 10 analyzed angiogenic factors.
Table 1. Oncolytic hrR3-induced changes in angiogenic and angiostatic factors in rat glioma 12 hours after oncolytic virus (OV) infection.
| Gene name | untreated (fold/actin) |
OV treated (fold/actin) |
Fold Induced | P value | Implicated in HSV-1 pathology | Implicated in glioma angiogenesis |
|---|---|---|---|---|---|---|
| VEGF | 0.018 | 0.012 | 0.667 | 0.298 | Yes27 | Yes33 |
| MMP9 | 0.001 | 0.004 | 4.000 | 0.0194 | Yes43 | Yes32 |
| TSP-1 | 0.130 | 0.069 | 0.531 | 0.0050 | Yes44 | Yes25 |
| CYR61a | 0.031 | 0.277 | 8.940 | 0.0012 | ND | Yes45 |
| bFGF | 0.00085 | 0.00125 | 1.470 | 0.39 | ND | Yes46 |
| PDGF | 0.779 | 0.476 | 0.611 | 0.122 | ND | Yes36 |
| MMP2 | 0.0061 | 0.00033 | 0.054 | 0.0057 | ND | Yes |
| Ang1 | 0.004 | 0.003 | 0.750 | 0.218 | ND | Yes37 |
| Ang-2a | 0.0026 | 0.0096 | 3.730 | 0.0028 | ND | Yes47 |
| SF/HGF | 0.0001 | 0.00007 | 0.700 | 0.586 | ND | Yes48,49 |
| BAI1 | 0.00248 | 0.00245 | 0.988 | 0.9630 | ND | Yes20 |
Abbreviations: bFGF, basic fibroblast growth factor; HSV-1, herpes simplex virus 1; MMP9, matrix metalloproteinase 9; ND, not determined; PDGF, platelet derived growth factor; VEGF, vascular endothelial growth factor.
Changes in the angiogenic profile of tumors derived from rats with D74/HveC glioma cells 12 hours after treatment with oncolytic HSV-1 (hrR3). The animals were killed after 12 hours, total RNA was obtained from each tumor tissue, and the levels of indicated gene expression relative to endogenous β-actin were evaluated by quantitative real-time PCR, as described.
Genes which are significantly induced upon OV infection of tumors. Genes with a significant change in expression upon OV infection are in bold.
Significant correlation between CYR61 and OV presence in tumors derived from immune-competent as well as from immune-modulated rats
OV treatment of tumors has been shown to initiate a robust antiviral host immune response.7,12 We as well as others have shown earlier that the treatment of animals with cyclophosphamide (CPA) increases OV propagation in tumors by suppressing antiviral host immune responses.13–15 We next sought to determine whether the increase in OV particles seen in CPA-treated gliomas would correlate with changes in the levels of TSP-1, CYR61, and Ang-2 transcripts. As expected, RT-PCR analysis of tumor tissue from OV-treated rats bearing intracranial tumors pretreated with PBS or CPA revealed higher levels of OV-expressed β-galactosidase (β-gal) in tumors from CPA-treated animals (Supplementary Figure S1). An evaluation of changes in the levels of CYR61 and Ang-2 messenger RNA (mRNA) in these tumor samples revealed a significantly greater induction of CYR61 in tumors from animals treated with OV + CPA as compared to tumors derived from animals treated with OV alone (2.7-fold higher, P = 0.0094). No significant changes were observed in the levels of Ang-2 and TSP-1 gene expression in OV + CPA-treated animals compared to tumors derived from animals treated with OV alone (OV versus OV + CPA: 0.61-fold, P > 0.05 for Ang-2, and 1.23-fold, P > 0.05 for TSP-1) (Figure 3a-c). Scatter plot analyses of the levels of CYR61, Ang-2, and TSP-1 relative to OV-encoded β-gal in these tumors revealed a significant positive correlation between CYR61 and β-gal (R = 0.710, and P = 0.0009), but not between Ang-2 and β-gal (P = 0.342) or between TSP-1 and β-gal (P = 0.069) (Figure 3d-f). These results indicated that the levels of CYR61 induced in tumor tissue correlated with the amount of OV in tumor tissue.
Figure 3. Correlation between CYR61 and β-galactosidase (β-gal), but not between TSP-1 and Ang-2 levels, with oncolytic virus (OV) encoded lacZ.

(a–c) Quantitative real-time PCR (QRT-PCR) for OV-encoded (a) CYR61, (b) Ang-2, and (c) TSP-1 gene expression in rat brain tumors. Rats with intracranial brain tumors were pretreated with phosphate-buffered saline (PBS)/cyclophosphamide (CPA) on day 5, and with PBS/OV on day 7 after tumor cell implantation. Seventy-two hours after OV infection, the animals were killed, and the amounts of Ang-2, CYR61, and TSP-1 messenger RNA (mRNA) relative to β-actin were quantified using QRT-PCR (n = 9/group). There was a significant increase in CYR61 mRNA in animals treated with OV + CPA as compared to animals treated with OV alone. (d,e) Scatter plot analysis of the expression of OV encoded (d) β-gal versus CYR61, (e) Ang 2, and (f) TSP-1 rat glioma tumor tissue, both with and without CPA pretreatment. Note the significant positive correlation between CYR61 and β-gal (R = 0.710, P = 0.0009), but not between β-gal and Ang-2 (R = 0.189, P = 0.451) or between β-gal and TSP-1 (R = 0.268, P = 0.283).
Rapid and dose-dependent induction of CYR61 consequent to hrR3 infection of glioma cells in vitro by three different conditionally replication-competent HSV-1-derived viruses
The positive correlation observed between CYR61 expression and OV levels suggested that CYR61 may be directly induced consequent to OV infection of tumor cells. In order to evaluate whether the induction of CYR61 in OV-treated tumors represents a direct effect of OV infection, we evaluated temporal changes in CYR61 expression in rat glioma cells infected with OV in vitro. D74/HveC rat glioma cells were infected with hrR3 virus (MOI = 0.05), cell lysates were harvested at 0, 4, 8, and 24 hours after infection, and the levels of CYR61 relative to endogenous actin were evaluated using QRT-PCR. As indicated in Figure 4a, there was a significant and early increase in CYR61 mRNA expression relative to endogenous actin in each sample after OV infection (0, 4, 8, and 24 hours; 0.001 ± <0.001, 0.005 ± <0.001, 0.008 ± 0.001, and 0.417 ± 0.089, respectively). CYR61 expression increased as early as 4 hours after infection and was maintained up to 8 hours after infection, with a further 52.1-fold increase in induction between 8 and 24 hours (Figure 4a). The HSV-1 lytic cycle is ∼12–16 hours, and this upsurge in CYR61 expression between 8 and 24 hours could coincide with a second wave of viral replication and burst. For testing this possibility, we infected D74/HveC glioma cells with increasing amounts of hrR3. The cells were harvested 24 hours after infection, and the amounts of CYR61 induced in cells infected at the indicated MOIs were analyzed using QRT-PCR. As shown in Figure 4b, there was increased induction of CYR61 with increasing MOI of OV, indicating a positive linear dose–response relationship between CYR61 induction and OV (at MOIs of 0, 0.01, 0.05, 0.1, and 1; 0.002 ± <0.001, 0.004 ± 0.002, 0.026 ± 0.006, 0.193 ± 0.019, and 0.130 ± 0.045, respectively). There was no increase in CYR61 between cells infected at MOIs of 0.1 and 1, probably reflecting saturation in infectious cycles of cells between these MOIs. Taken together, these findings showed that OV infection of glioma cells results in a dose-dependent increase in CYR61 transcript.
Figure 4. Rapid and dose-dependent induction of CYR61 messenger RNA (mRNA) in rat glioma cells in vitro.

(a) D74 cells were infected with hrR3 in vitro, and cell lysates were harvested 0, 4, 8, and 24 hours after infection. After RNA isolation and complementary DNA synthesis, the samples were analyzed for CYR61 expression using quantitative realtime PCR (QRT-PCR). The results were standardized by expressing CYR61 induction as a multiple of actin expression in each sample. Fold change in CYR61 levels relative to uninfected cells reveals, a rapid induction of CYR61 after hrR3 infection of glioma cells. (b) Induction of cellular CYR61 consequent to oncolytic virus (OV) infection displays a dose-response relationship with the number of infectious viral particles used. D74/HveC rat glioma cells were plated and infected with hrR3 at the indicated multiplicity of infection (MOI). Total RNA from cells was harvested 24 hours after infection and analyzed for CYR61 mRNA expression relative to actin. Note that induction of CYR61 increases with increase in infectious particles. (c) Schematic of the various herpes simplex virus-1 (HSV-1)-derived OVs used in this study. (A) HSV-1 genome structure showing the UL (unique long sequences) and US (unique small sequences). Enlargements of the UL region depict the γ34.5 and ICP6 domains. (B) HSVQ is an HSV-1-derived virus with deletions of both γ34.5 genes and interruption of ICP6 by an insertion of enhanced green fluorescent protein (EGFP). This renders the virus unable to replicate in nondividing cells. (C) rQNestin34.5 is an HSVQ-derived virus in which one copy of the γ34.5 gene is reinserted into the UL39 locus under a nestin promoter, making the virus more potent in nestin-positive glioma-initiating cells. (D) hrR3 is an HSV-1-derived OV with an in-frame insertion of LacZ within its ICP6 locus, causing disruption of the viral ribonucleotide reductase gene. (d) In vitro, D74 rat glioma cells were infected with replication-incompetent amplicon, ultraviolet (UV)-inactivated hrR3, or the indicated OV. Total cellular RNA was harvested 24 hours after infection and analyzed for expression of cellular CYR61 relative to actin, as described in Materials and Methods. Note the significant induction of CYR61 mRNA expression in each of the three OVs relative to the uninfected sample. No significant induction was observed after replication-deficient amplicon infection or UV-inactive hrR3 infection of cells.
We next tested whether the induction of cellular CYR61 could be reproduced by infection with HSV-1-derived OVs harboring different mutations. We compared changes in the levels of CYR61 in D74/HveC glioma cells consequent to infection with three different HSV-1-derived OVs: hrR3, rHSVQ, and rQNestin34.5. The genetic alterations in each of these HSV-derived OVs are shown in Figure 4c. In hrR3, the viral gene ICP6 is disrupted by an in-frame insertion of LacZ. rHSVQ is also disrupted in the ICP6 gene and, additionally, deleted for both copies of the neurovirulence γ34.5 gene. rQNestin34.5 is a second-generation OV derived from rHSVQ, in which one copy of the deleted γ34.5 gene is reinserted under transcriptional regulation of a glioma-specific nestin promoter/enhancer element.10,16 As negative controls we employed a replication-defective HSV amplicon vector and a UV-inactivated hrR3. Figure 4d shows that there was no significant induction of CYR61 in cells infected with either the UV-inactivated hrR3 or with the replication-defective amplicon. As expected, CYR61 expression was induced in cells infected with each of the three OVs tested. The fold increase in CYR61 in samples treated with hrR3, rHSVQ, rHSVQNestin, AMP, and UV-inactivated hrR3 (expressed as multiples compared to CYR61 levels in untreated cells) was 10.9 ± 1.45, 5.83 ± 0.925, 6.86 ± 1.27, 0.97 ± 0.270, and 1.230 ± 0.245, respectively. These results indicate that the induction of CYR61 was associated with infection by an actively replicating virus and was not associated with infection by a replication-defective or inactivated virus.
Induction of CYR61 mRNA consequent to OV infection in human glioma cells in vitro
Our results indicated a rapid and dose-dependent induction of CYR61 after OV infection of D74/HveC rat glioma cells in vitro and in vivo. Next, we evaluated whether CYR61 mRNA would be similarly induced in human glioma cells after infection with HSV-1-derived OV. Human glioma cells were plated to be 75% confluent and then infected with rHSVQ1 for 24 hours. Total RNA harvested from the cells was analyzed for relative expression of CYR61 in uninfected and infected cells, using quantitative PCR as described. As shown in Table 2, there was significant induction of CYR61 gene expression in all the cell lines tested. In view of the fact that the genotypic and phenotypic properties of glioma cell lines have been shown to be altered by prolonged culture conditions in vitro with serum,17 we next tested the induction of CYR61 gene expression in primary tumor cells from patients' gliomas. These cells are serially passaged in mice as flank tumors and are grown as spheres in chemically defined serum-free medium containing human recombinant epidermal growth factor, basic fibroblast growth factor, and leukemia-inhibitory factor, shown to enrich for the glioma initiator or “stem-like” cell subpopulation.18,19 The pathology of the tumors from which these cells are derived is described in Materials and Methods (Supplementary Table S1). Briefly, the indicated cells were infected with rQNestin34.5 or PBS, total cellular RNA was isolated 24 hours after infection and analyzed for relative expression of CYR61 using QRT-PCR. Table 2 depicts the multiple by which induction of CYR61 increases consequent to infection of these human glioma cells. The induction of CYR61 consequent to OV infection in each tumor cell line provides evidence that CYR61 induction is a direct result of OV infection and occurs in a wide variety of human glioma cell lines and primary human glioma-derived cells.
Table 2. Induction of CYR61 mRNA upon oncolytic virus (OV) infection in several human glioma-derived cells and in cell lines, in vitro.
| Glioma cells | Uninfected CYR61/GAPDH |
Infected CYR61/GAPDH |
Fold induced infected/uninfected |
P value |
|---|---|---|---|---|
| Primary human glioma-derived cells | ||||
| OG02 | 45.7 | 218.8 | 4.8 | 0.00650 |
| 9.0 | 8.5 | 30.2 | 3.5 | 0.00700 |
| OGO6 | 12.1 | 34.7 | 2.9 | 0.00180 |
| 8.0 | 12.8 | 19.9 | 1.6 | 0.00310 |
| OG09 | 4.7 | 12.5 | 2.7 | 0.00030 |
| Human glioma cell lines | ||||
| LN229 | 3.3 | 30.7 | 9.3 | 0.0005 |
| U87 | 1.1 | 3.8 | 3.6 | <0.0001 |
| U343 | 4.0 | 10.0 | 2.5 | 0.0090 |
| U87ΔEGFR | 1.3 | 2.8 | 2.2 | 0.0150 |
Abbreviations: GAPDH, glyceraldehyde-3-phosphate dehydrogenase; mRNA, messenger RNA.
The listed human glioma cell lines and patient-derived tumor cells were each treated with phosphate-buffered saline or rQNestin 34.5 for 24 hours (multiplicity of infection = 1). The cells were then harvested and analyzed by quantitative realtime PCR. The samples were analyzed for the relative amount of CYR61 in each sample. The results were normalized to the levels in a normal brain. Note the induction of CYR61 mRNA expression upon OV infection in each tumor cell line.
Induction of CYR61 protein expression consequent to OV infection of human glioma cells in vitro and in vivo
Next we evaluated changes in levels of CYR61 protein in glioma cells after infection with OV in vitro and in vivo. U343 human glioma cells infected with hrR3 were compared with PBS-treated control cells to assess changes in CYR61 protein expression. Cells were harvested 16 hours after infection, and the amount of CYR61 in cell lysate and extracellular matrix was evaluated by western blot. The results clearly demonstrated an induction of both the secreted full-length and proteolytically processed forms20 of CYR61 in OV-infected cells (Figure 5a). We evaluated induction of CYR61 protein in human glioma tumors treated with OV in vivo. Mice with subcutaneous LN229 xenografts or with intracerebral tumors (U87ΔEGFR glioma cells) were treated with direct intratumoral injections of hrR3 or HSVQ, respectively. The mice were killed 24 hours after treatment, and the harvested tumor tissue was evaluated for CYR61 expression using western blot. Figure 5b shows the western blot analysis results for CYR61 protein in both subcutaneous and intracerebral human glioma tumors treated with OV. Figure 5c shows representative immunofluorescent images of sections from OV or PBS-treated tumor-bearing brain tissues. Next we examined whether CYR61 could be detected in the cerebrospinal fluid (CSF) of animals with gliomas that had been treated with the OV. Rats with intracranial tumors were treated with direct intratumoral injection of OV (hrR3). CSF was harvested from normal and tumor-bearing rats 24 hours after treatment with PBS and OV, respectively, as described in Materials and Methods, and CYR61 protein levels were analyzed using western blot. CYR61 levels were higher in the CSF of tumor-bearing rats treated with OV than in the controls (Figure 5d).
Figure 5. Induction of CYR61 protein in vitro and in vivo consequent to oncolytic virus (OV) infection.

(a) U343 human glioma cells were infected with hrR3 at a multiplicity of infection of 0.05. The cell lysate and extracellular matrix were harvested and analyzed for CYR61 expression using western blot. Note the significant induction of CYR61 in U343 cells infected with hrR3 relative to uninfected control cells. Asterisk indicates a proteolytic fragment of secreted CYR61 in U343 cells. Proteolytic processing of CYR61 has been described earlier. (b) Intracranial (human U87ΔEGFR glioma cells) and subcutaneous (LN229) tumors generated in athymic nude mice were treated with HSVQ or phosphate-buffered saline (PBS). The animals were killed 24 hours after treatment, and the harvested tumor lysate was analyzed for CYR61 expression using western blot. Note the substantial induction of CYR61 protein in tumors infected with HSVQ. (c) Representative immunofluorescent tumor sections from U87ΔEGFR tumors treated with OV/PBS in vivo. Seven days after tumor cell implantation, athymic nude mice were treated with PBS or hrR3, and killed 3 days after treatment. Sections from the tumor-containing brains were analyzed by immunofluorescence for CYR61 protein expression (red, top). Nuclear [4′,6-diamidino-2-phenylindole (DAPI)] staining (blue, bottom) shows the tumors containing highly nucleated area in the sections. (d) Rats with intracranial tumors (D74/HveC glioma cells) were treated with hrR3 7 days after tumor implantation. Twenty-four hours after OV treatment, cerebrospinal fluid (CSF) and tumors were harvested from the rats, as described in Materials and Methods. The harvested CSF and tumor lysate were analyzed for CYR61 and β-actin, using western blot. Note the increase in CYR61 protein in the CSF of rats with tumors treated with OV relative to tumor-bearing control rats treated with PBS.
Inhibition of CYR61 stimulated integrin activation inhibits OV induced vascularization
CYR61 is a 40 kd secreted heparin-binding protein encoded by a growth factor–inducible immediate-early gene. CYR61 has been shown to promote dose-dependent attachment and chemotaxis of endothelial cells in vitro and also promotes angiogenesis in chick chorioallantoic membrane assay and in rodent corneal angiogenesis assays.21,22 Its overexpression has been shown to promote glioma invasion and vascularization; indeed, its increased expression in a variety of malignancies, including glioma, is associated with a poor prognosis.23–25 Its angiogenic function has been attributed to its ability to bind and activate at least five different integrins (including integrins such as αVβ3 and αVβ5) that are involved in angiogenesis and matrix attachment.26,27 In order to test the role of CYR61-mediated integrin activation in OV-induced angiogenesis, we tested the impact of Cilengitide (cRGD), a known antagonist of CYR61-mediated integrin activation, on OV treatment-induced angiogenesis.26,27 Angioreactors filled with LN229 glioma cells suspended in basement membrane extracts were treated with the rHSVQ1 (MOI = 1) in the presence or absence of Cilengitide before being implanted into the rear flanks of athymic nude mice. Fifteen days later, the amount of angiogenesis initiated in each tube was quantified as described (Figure 6). Quantification of Hb confirmed a statistically significant reduction in angiogenesis in OV-treated angioreactors in the presence of cRGD (P = 0.0362). These results suggest that the OV treatment induces accumulation of integrin-activating CYR61and initiates angiogenesis in gliomas.
Figure 6. Impact of OV-induced CYR61 on glioma biology and oncolysis.
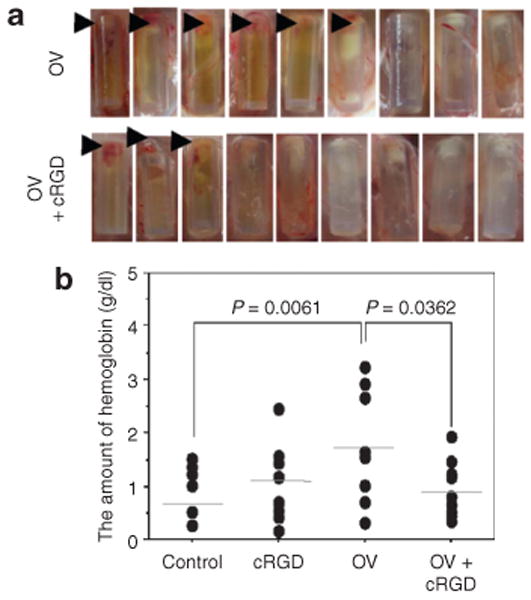
(a) Images of individual angioreactors containing HSVQ-treated (top) and phosphate-buffered saline (PBS)-treated LN229 glioma cells at the time of harvesting. Briefly, angioreactors filled with LN229 glioma cells treated with either PBS or HSVQ (n = 9/group) in the presence or absence of Cilengitide (30 ng/angioreactor) were implanted subcutaneously in athymic nude mice. Fifteen days after implantation the angioreactors were harvested and analyzed visually for blood vessels that had developed into the tubes. The presence of visually obvious initiation of blood vessels into six of the nine HSVQ-treated angioreactors and in three of the nine PBS-treated angioreactors are indicated by arrow heads. (b) Quantification of hemoglobin (Hb) in angioreactors: The contents of the individual angioreactors were isolated and the amount of Hb in each tube was quantified. Note the significant reduction in Hb content of angioreactors treated with HSVQ in the presence of Cilengitide (P ≤ 0.036).
Discussion
Oncolytic viral therapy is a biotherapeutic modality whose efficacy is currently being tested in clinical trials. We hypothesized that OV treatment would induce changes in the tumor “angiotome”, and that these could be exploited to predict OV infection of tumors. Our results indicate increased vascularity in the tumor after OV therapy, compared to untreated tumor. Further, we have found that there is a rapid and dose-dependent induction of CYR61 both in vitro and in vivo. We observed induction of CYR61 after infection with each of at least three different oncolytic HSV-1s, and in five primary glioma cells maintained under conditions that enrich for the glioma “stem-like” subpopulation. This rapid and dose-dependent induction was observed only with a replication-competent OV, and not with a UV-inactivated or –replication-deficient amplicon. Consistent with its published role in angiogenesis and glioma progression,23 the highest baseline expression of CYR61 was observed in tumor cells derived from a recurrent glioblastoma multiforme (OG02). However, despite its very high baseline expression in OG02 cells, CYR61 was induced more than fourfold consequent to OV infection in these cells. The induction of cellular secreted CYR61 protein consequent to OV infection, irrespective of its baseline expression and independent of host immune status, suggests that the monitoring of changes in its levels may be useful in evaluating the pharmacodynamics of host response to OV therapy. However, further studies will be needed to validate the predictive power of CYR61 protein in CSF as a biomarker to evaluate the pharmacodynamics of host response to OV therapy in humans.
We have demonstrated earlier that OV treatment of intracranial gliomas induces infiltration of peripheral leukocytes into the tumor, resulting in a significant increase in tumor vascular permeability.7 Given that host immune cells are known to be very closely involved both in tumor vessel formation and destruction,9 we tested the impact of OV treatment on glioma angiogenesis in vivo. Our results reveal that a significant increase in angiogenesis is initiated in glioma-matrigel implants consequent to OV treatment. We also observed a statistically significant increase in MVD in tumors after oncolytic HSV-1 treatment of intracranial tumors. This observation is corroborated by recent findings that report increased angiogenesis in subcutaneous human U87 glioma xenografts treated with oncolytic HSV-1.28 Intriguingly, oncolytic HSV-1-mediated destruction of proliferating endothelial cells in the tumor has also been shown to result in their destruction and a subsequent reduction in tumor MVD.29–31 These studies investigated oncolytic HSV-1 infection and the killing of proliferating endothelial tumor cells in vitro as well as in vivo. Benencia et al.31 showed reduced recruitment of blood vessels into matrigel explants implanted subcutaneously into mice. In these studies matrigel explants containing vascular endothelial growth factor-A (60 ng/ml) were injected subcutaneously into mice, and were treated with live or inactivated oncolytic HSV-1. The absence of glioma or tumor cells in these explants would have precluded the induction of CYR61 in them, and therefore the antiangiogenic effect observed 4 days after OV treatment possibly represents the direct oncolytic effect of OV on proliferating endothelial cells. In a second study by Mahller et al.,29 MPNST xenografts were treated with either PBS or OV. One week after treatment the tumors were evaluated for vessel density. It is not known whether the MPNST cells employed in this study also induced and secreted CYR61 consequent to OV infection. In our study we have compared the effect of changes in tumor microenvironment on tumor biology at later time points when mice were killed because of tumor burden. Our results indicate that increased angiogenic secretions in tumor microenvironment after oncolysis promote neovascularization of the residual tumor.
Corneal infection with wild-type HSV-1 has been shown to initiate an angiogenic response, associated with increased expression of angiogenic factors such as vascular endothelial growth factor, matrix metalloproteinase 9, and cyclo-oxygenase-2, and also reduced expression of antiangiogenic factors such as TSP-1 and TSP-2.28,32–34 In our study we investigated changes in transcripts of secreted angiogenic and angiostatic factors in intracranial tumors treated with hrR3. Our results indicate significant changes in TSP-1, Ang-2, and CYR61 gene expression in OV-treated tumors in rats. Reduction in TSP-1 protein levels in cells infected with wild-type or oncolytic HSV-1 has been demonstrated in earlier studies.28,32,35 Ang-1 and Ang-2 that are secreted, and their receptor Tie-2, play an important role in regulating vascular stability and growth during embryogenesis, inflammation, and carcinogenesis.36 In glioma, Ang-2 overexpression has been linked to both glioma invasion and angiogenesis.37 The impact of increased levels of Ang-2 remains to be elucidated.
Recent studies elucidating host responses to viral infection, using complementary DNA (cDNA) microarray techniques, have identified CYR61 to be upregulated in HeLa cells infected with coxsackievirus B3 and downregulated in adenovirus type 12– infected cells.38,39 This is, to our knowledge, the first report describing the induction of CYR61 consequent to OV infection of tumors. Our results demonstrate that induction of CYR61 after oncolysis results in the production of a proangiogenic glioma extracellular matrix which plays a key role in the neovascularization of the residual tumor. Future studies will investigate the impact of CYR61 on OV therapy and tumor response to oncolytic treatment.
Materials and Methods
Cells and viruses
Human U343, U87, U87ΔEGFR, and LN229 glioma cell lines were maintained in Dulbecco's modified minimal essential medium (DMEM) supplemented with 2% fetal bovine serum, 100 U/ml penicillin, and 100 μg/ml streptomycin. Rat glioma D74/HveC cells, stably transfected with human HveC receptor to facilitate HSV infection,40 were maintained in DMEM supplemented with 10% fetal bovine serum, 100 U/ml penicillin, 100 μg/ml streptomycin, and 3.7 μg/ml blasticidin. U87ΔEGFR cells, expressing a truncated, constitutively active, mutant form of epidermal growth factor receptor, were maintained in DMEM supplemented with 10% fetal bovine serum, 100 U/ml penicillin, 100 μg/ml streptomycin, and 200 μg/ml G418.16 Primary tumor cells from human patients, curated by the Dardinger Laboratory at Ohio State University, were obtained from A.O. and Y.S. (unpublished results). The cells were grown as a monolayer in DMEM supplemented with 2% serum. (See Supplementary Table S1 for details on the sources of these primary tumor cell lines). We used HSV-1-derived OVs, HSVQ, hrR3, rQNestin34.5, and rQ1-α-Fluc. The genetic structure of wild-type HSV-1 and of the various OVs used in this study are shown in Figure 3.
Animal surgery
All animal experiments were performed in accordance with the Subcommittee on Research Animal Care of the Ohio State University guidelines. Fischer rats 8–10 weeks of age were purchased (Taconic Farms, Germantown, NY) for the in vivo study. The anesthetized rats were fixed in a stereotactic apparatus, and a burr hole was drilled at 3 mm lateral to the bregma to a depth of 4 mm. Rat glioma D74/HveC cells (2 × 10⁵ cells in 2 μl Hank's buffered salt solution) were implanted, as outlined.41 One group of rats received an intraperitoneal injection of CPA (Bristol-Myers Squibb, Princeton, NJ) 5 days after tumor implantation, at a dose of 80 mg/kg of PBS. Seven days after the tumor cell implantation, the rats were anesthetized again and stereotactically inoculated with the indicated OV at the indicated dosage in 5 μl Hank's buffered salt solution at the same coordinates. The animals were closely monitored for any signs of morbidity and were killed 3 days after infection in agreement with our Institutional Animal Care and Use Committee protocol. Tumor-bearing right hemispheres of the brains were excised and processed for RNA, as described.
CSF was taken from some of the Fischer rats, as described earlier.16 The rats were anesthetized and fixed in a stereotactic apparatus. Then a 3-cm incision was made in the skin at the back of the head, and the overlying connective tissue was removed to expose the skull. A small hole was drilled in the skull using a dental burr on the sagittal midline immediately rostral to the interparietal-occipital bone suture. A polyethylene tube (PE10) was slowly inserted into the cisterna magna without damaging the cerebellum. All samples were collected and routinely centrifuged at 14,000 rpm for 8 minutes to remove any cells or debris from the fluid, which was taken into another sterile tube. Samples were frozen on dry ice and stored at −80 °C until use. Fifty microliters of CSF was collected from each rat using this method.
Athymic nude mice 6–8 weeks of age were purchased (Charles River Laboratories, National Cancer Institute-Frederick Animal Production Area, Frederick, MD) for in vivo study. The mice were anesthetized and fixed in a stereotactic apparatus, and a burr hole was drilled at 2 mm lateral to the bregma, to a depth of 3 mm. Human glioma U87ΔEGFR cells (2 × 10⁵ cells in 2 μl Hank's buffered salt solution) were implanted, as outlined.42 Seven days after the tumor cell implantation, the mice were anesthetized again and stereotactically inoculated with 1 × 10⁷ plaque forming units of rHSVQ suspended in 5 μl Hank's buffered salt solution, at the same coordinates. The animals were observed daily, and were killed 24 and 72 hours after infection. Tumor-bearing right hemispheres of the brains were excised and processed for protein, as described.
Investigations were performed using DIVAA Activation Kit (Trevigen, Gaithersburg, MD) and WAKO Hb B kit (Wako Chemicals, Richmond, VA) for assessing angiogenesis, in accordance with the manufacturer's directions. Briefly, angioreactors were filled with LN229 (2 × 10⁵) cells suspended in basement membrane extract with PBS or HSVQ (MOI = 1) and PBS or cRGD (30 ng), and maintained at 37 °C for 1 hour to promote gelling.
Mice were anesthetized, and a small incision was made on the dorsal–lateral surface ∼1 cm above the hip-socket. Angioreactors were implanted into the dorsal flanks of the mice with the open ends opposite to the incision, and the incision was closed. Fifteen days after the implantation of the angioreactors, the mice were killed. A 2 cm perimeter of skin surrounding the angioreactors was removed using dissection scissors. Blood vessels along the open end of angioreactor were severed with a scalpel. The caps at the bottom of the angioreactors were then removed and the basement membrane extract/vessel complex was harvested into a sterile microtube in 300 μl of CellSperse, transferred into a microtube, and incubated for 1 hour at 37 °C. Samples were placed in a 96-well dish. The Hb concentration was determined using the Wako Hb test.
RNA and cDNA preparation
Each 10-cm plate of cells in vitro was washed twice with 3 ml PBS, and total RNA was harvested using Trizol reagent (no. 15596-026; Invitrogen, Carlsbad, CA) in accordance with the manufacturer's directions. The air-dried pellet was resuspended in 25 μl of Ultrapure water. Immediately after the animals were killed, in vivo samples were prepared by sectioning the brain to isolate the tumor area. The tumor samples were then treated with Trizol reagent and homogenized by syringe, and the total RNA was harvested in accordance with the manufacturer's directions. The RNA isolated by this method was cleaned using an RNeasy Mini Kit (no. 74104; Qiagen, Valencia CA) in accordance with the manufacturer's instructions. cDNA was made using SuperScript First-Strand Synthesis System for RT-PCR (no. 11904018; Invitrogen, Carlsbad, CA).
QRT-PCR
QRT-PCR was performed on the cDNA derived from infected cells or tissue. Real-time continuous detection of PCR product is facilitated by monitoring the increase in fluorescence of SYBR Green, which binds to the double-stranded DNA generated during each cycle of the PCR. This fluorescence is quantified for determining the relative amounts of DNA in the initial sample. Briefly, to each well of a 96-well plate, 2.5 μl of the indicated forward and reverse primers, 2.5 μl Ultrapure water, 12.5 μl SYBR Green (no. 4304437; Applied Biosystems, Foster City, CA), and 5 μl cDNA sample were added. The reaction plate was sealed and centrifuged for 3 minutes at 1,200 rpm, and QRT-PCR was performed using a 7500 Real-time PCR System (Applied Biosystems). Samples were amplified in triplicate. Glyceraldehyde-3-phosphate dehydrogenase was used as internal control for all human cDNA samples, and β-actin was used for those of rats. Relative quantification of gene expression was expressed as a ratio of the difference in the number of cycles needed for expression of a gene in tumors from untreated rats as compared to those from treated rats. The formula used was 2dCt CYR61/2dCt control, in which Ct is the number of cycles for saturation and dCt is the difference between the number of cycles needed for expression of a gene in tumors from untreated rats (used as a baseline) and for expression of the same gene from treated rats (tumor or tumor plus virus). Primers for LacZ, β-actin, glyceraldehyde-3-phosphate dehydrogenase, and CYR61 were designed using the Primer Express Program (Applied Biosystems, Foster City, CA) (Supplementary Table S2).
Harvesting cells in culture
The conditioned medium was harvested and cleared of cellular debris by centrifugation at 4,000 rpm for 10 minutes. The resulting supernatant was stored at −20 °C. Cells were harvested by lysis in lysis buffer [8 mol/l urea, 4% sodium dodecyl sulfate, and protease inhibitor cocktail tablet (no. 11 836 153 001; Complete Mini)]. A rubber policeman was used for scraping the cells, and the cell lysate samples were also stored at −20 °C. After the cell harvesting, tissue culture plates were incubated with lysis buffer at 85 °C for 1 hour to harvest the insoluble, plate-bound extracellular matrix. The conditioned medium and extracellular matrix were further concentrated by trichloroacetic acid precipitation. Air-dried pellets were rehydrated and resuspended in urea lysis buffer. Cell lysates were sonicated and then centrifuged at 12,000 rpm for 8 minutes, and total protein was quantified using the RC DC Protein Assay kit (no. 500-0119; Bio-Rad, Hercules, CA).
Western blot analysis
Equal amounts of protein from the soluble supernatant were added to 6× sodium dodecyl sulfate loading buffer (1 μl loading buffer: 5 μl cell sample). The denatured samples were resolved by sodium dodecyl sulfate–polyacrylamide gel electrophoresis in a Criterion precast gel (no. 345-0009; Bio-Rad) to separate the proteins on the basis of their molecular weights. After electrophoresis, the proteins were transferred to a polyvinylidene fluoride transfer membrane (no. IPVH 20200; Immobilon; Sigma-Aldrich, St. Louis, MO) by electroblotting, and probed for the indicated protein using appropriate antibodies. The primary antibody used to probe for CYR61 was pAb anti-CYR61 (rabbit) (no. NB100-357; Novus Biologicals, Littleton, CO) in a 1:750 dilution of 5% blocking milk. The secondary antibody was polyclonal goat anti-rabbit immunoglobulin/horseradish peroxidase (no. P0448; Dakocytomation, Carpinteria, CA) in a 1:1,000 dilution of phosphate-buffered saline Tween 0.1%. The primary antibody used to probe for β-actin was monoclonal anti-β-actin antibody produced in mouse (no. A1978-200; Sigma-Aldrich) in a 1:2,000 dilution of 5% blocking milk. The secondary antibody was anti-mouse immunoglobulin G, horseradish peroxidase–linked whole antibody (from sheep) (no. NA931V; Amersham Biosciences, Piscataway, NJ) in a 1:20,000 dilution of phosphate-buffered saline Tween 0.1%.
Statistical analysis
Statistical analysis was carried out using Student's t-test. P values <0.05 were considered significant, and the data are presented as mean values ± SD. The relative value of each QRT-PCR group was compared using one-way ANOVA followed by Scheffe's post hoc test. Again, significance was assumed if the P value was <0.05, and the data are presented as mean values ± SD.
Supplementary Material
Supplementary Figure S1. Effect of CPA treatment on OV propagation in rats with brain tumors.
Supplementary Table S1. Sources of patient-derived primary tumor cell lines.
Supplementary Table S2. Primers used for quantitative real-time polymerase chain reaction in this study.
Acknowledgments
This work was supported by funding from the National Institutes of Health Grant (1K01NS059575 to B.K.; R01NS064607 to B.K.; P01 CA069246 to E.A.C.); The OSUCCC, Viral Oncogenesis Program seed grant (to B.K.); American Association for Neurological Surgeons/Congress of Neurological Surgeons, Section on Tumors/BrainLAB International Research Fellowship (to K.K.); American Brain tumor Association Medical student fellowship (to J.S.); The Deans undergraduate research fund (to R.T.).
References
- 1.Brat DJ, Castellano-Sanchez A, Kaur B, Van Meir EG. Genetic and biologic progression in astrocytomas and their relation to angiogenic dysregulation. Adv Anat Pathol. 2002;9:24–36. doi: 10.1097/00125480-200201000-00004. [DOI] [PubMed] [Google Scholar]
- 2.Varghese S, Rabkin SD. Oncolytic herpes simplex virus vectors for cancer virotherapy. Cancer Gene Ther. 2002;9:967–978. doi: 10.1038/sj.cgt.7700537. [DOI] [PubMed] [Google Scholar]
- 3.Hardcastle J, Kurozumi K, Chiocca EA, Kaur B. Oncolytic viruses driven by tumor-specific promoters. Curr Cancer Drug Targets. 2007;7:181–189. doi: 10.2174/156800907780058880. [DOI] [PubMed] [Google Scholar]
- 4.Aghi M, Rabkin S, Martuza RL. Effect of chemotherapy-induced DNA repair on oncolytic herpes simplex viral replication. J Natl Cancer Inst. 2006;98:38–50. doi: 10.1093/jnci/djj003. [DOI] [PubMed] [Google Scholar]
- 5.Fukuhara H, Todo T. Oncolytic herpes simplex virus type 1 and host immune responses. Curr Cancer Drug Targets. 2007;7:149–155. doi: 10.2174/156800907780058907. [DOI] [PubMed] [Google Scholar]
- 6.Frantz S, Vincent KA, Feron O, Kelly RA. Innate immunity and angiogenesis. Circ Res. 2005;96:15–26. doi: 10.1161/01.RES.0000153188.68898.ac. [DOI] [PubMed] [Google Scholar]
- 7.Kurozumi K, Hardcastle J, Thakur R, Yang M, Christoforidis G, Fulci G, et al. Effect of tumor microenvironment modulation on the efficacy of oncolytic virus therapy. J Natl Cancer Inst. 2007;99:1768–1781. doi: 10.1093/jnci/djm229. [DOI] [PubMed] [Google Scholar]
- 8.Fulci G, Breymann L, Gianni D, Kurozomi K, Rhee SS, Yu J, et al. Cyclophosphamide enhances glioma virotherapy by inhibiting innate immune responses. Proc Natl Acad Sci USA. 2006;103:12873–12878. doi: 10.1073/pnas.0605496103. [DOI] [PMC free article] [PubMed] [Google Scholar]
- 9.Noonan DM, De Lerma Barbaro A, Vannini N, Mortara L, Albini A. Inflammation, inflammatory cells and angiogenesis: decisions and indecisions. Cancer Metastasis Rev. 2007;27:31–40. doi: 10.1007/s10555-007-9108-5. [DOI] [PubMed] [Google Scholar]
- 10.Mineta T, Rabkin SD, Martuza RL. Treatment of malignant gliomas using ganciclovir-hypersensitive, ribonucleotide reductase-deficient herpes simplex viral mutant. Cancer Res. 1994;54:3963–3966. [PubMed] [Google Scholar]
- 11.Goldstein DJ, Weller SK. Herpes simplex virus type 1-induced ribonucleotide reductase activity is dispensable for virus growth and DNA synthesis: isolation and characterization of an ICP6 lacZ insertion mutant. J Virol. 1988;62:196–205. doi: 10.1128/jvi.62.1.196-205.1988. [DOI] [PMC free article] [PubMed] [Google Scholar]
- 12.Davis JJ, Fang B. Oncolytic virotherapy for cancer treatment: challenges and solutions. J Gene Med. 2005;7:1380–1389. doi: 10.1002/jgm.800. [DOI] [PubMed] [Google Scholar]
- 13.Ikeda K, Ichikawa T, Wakimoto H, Silver JS, Deisboeck TS, Finkelstein D, et al. Oncolytic virus therapy of multiple tumors in the brain requires suppression of innate and elicited antiviral responses. Nat Med. 1999;5:881–887. doi: 10.1038/11320. [DOI] [PubMed] [Google Scholar]
- 14.Di Paolo NC, Tuve S, Ni S, Hellstrom KE, Hellstrom I, Lieber A. Effect of adenovirus-mediated heat shock protein expression and oncolysis in combination with low-dose cyclophosphamide treatment on antitumor immune responses. Cancer Res. 2006;66:960–969. doi: 10.1158/0008-5472.CAN-05-2388. [DOI] [PMC free article] [PubMed] [Google Scholar]
- 15.Myers RM, Greiner SM, Harvey ME, Griesmann G, Kuffel MJ, Buhrow SA, et al. Preclinical pharmacology and toxicology of intravenous MV-NIS, an oncolytic measles virus administered with or without cyclophosphamide. Clin Pharmacol Ther. 2007;82:700–710. doi: 10.1038/sj.clpt.6100409. [DOI] [PMC free article] [PubMed] [Google Scholar]
- 16.Kambara H, Okano H, Chiocca EA, Saeki Y. An oncolytic HSV-1 mutant expressing ICP34.5 under control of a nestin promoter increases survival of animals even when symptomatic from a brain tumor. Cancer Res. 2005;65:2832–2839. doi: 10.1158/0008-5472.CAN-04-3227. [DOI] [PubMed] [Google Scholar]
- 17.Lee J, Kotliarova S, Kotliarov Y, Li A, Su Q, Donin NM, et al. Tumor stem cells derived from glioblastomas cultured in bFGF and EGF more closely mirror the phenotype and genotype of primary tumors than do serum-cultured cell lines. Cancer Cell. 2006;9:391–403. doi: 10.1016/j.ccr.2006.03.030. [DOI] [PubMed] [Google Scholar]
- 18.Folkins C, Man S, Xu P, Shaked Y, Hicklin DJ, Kerbel RS. Anticancer therapies combining antiangiogenic and tumor cell cytotoxic effects reduce the tumor stem-like cell fraction in glioma xenograft tumors. Cancer Res. 2007;67:3560–3564. doi: 10.1158/0008-5472.CAN-06-4238. [DOI] [PubMed] [Google Scholar]
- 19.Singh SK, Hawkins C, Clarke ID, Squire JA, Bayani J, Hide T, et al. Identification of human brain tumour initiating cells. Nature. 2004;432:396–401. doi: 10.1038/nature03128. [DOI] [PubMed] [Google Scholar]
- 20.Pendurthi UR, Tran TT, Post M, Rao LV. Proteolysis of CCN1 by plasmin: functional implications. Cancer Res. 2005;65:9705–9711. doi: 10.1158/0008-5472.CAN-05-0982. [DOI] [PMC free article] [PubMed] [Google Scholar]
- 21.Babic AM, Kireeva ML, Kolesnikova TV, Lau LF. CYR61, a product of a growth factor-inducible immediate early gene, promotes angiogenesis and tumor growth. Proc Natl Acad Sci USA. 1998;95:6355–6360. doi: 10.1073/pnas.95.11.6355. [DOI] [PMC free article] [PubMed] [Google Scholar]
- 22.Kireeva ML, Mo FE, Yang GP, Lau LF. Cyr61, a product of a growth factor-inducible immediate-early gene, promotes cell proliferation, migration, and adhesion. Mol Cell Biol. 1996;16:1326–1334. doi: 10.1128/mcb.16.4.1326. [DOI] [PMC free article] [PubMed] [Google Scholar]
- 23.Xie D, Yin D, Wang HJ, Liu GT, Elashoff R, Black K, et al. Levels of expression of CYR61 and CTGF are prognostic for tumor progression and survival of individuals with gliomas. Clin Cancer Res. 2004;10:2072–2081. doi: 10.1158/1078-0432.ccr-0659-03. [DOI] [PubMed] [Google Scholar]
- 24.Young N, Van Brocklyn JR. Roles of sphingosine-1-phosphate (S1P) receptors in malignant behavior of glioma cells. Differential effects of S1P2 on cell migration and invasiveness. Exp Cell Res. 2007;313:1615–1627. doi: 10.1016/j.yexcr.2007.02.009. [DOI] [PMC free article] [PubMed] [Google Scholar]
- 25.Xie D, Yin D, Tong X, O'Kelly J, Mori A, Miller C, et al. Cyr61 is overexpressed in gliomas and involved in integrin-linked kinase-mediated Akt and beta-catenin-TCF/Lef signaling pathways. Cancer Res. 2004;64:1987–1996. doi: 10.1158/0008-5472.can-03-0666. [DOI] [PubMed] [Google Scholar]
- 26.Kireeva ML, Lam SC, Lau LF. Adhesion of human umbilical vein endothelial cells to the immediate-early gene product Cyr61 is mediated through integrin alphavbeta3. J Biol Chem. 1998;273:3090–3096. doi: 10.1074/jbc.273.5.3090. [DOI] [PubMed] [Google Scholar]
- 27.Leask A, Abraham DJ. All in the CCN family: essential matricellular signaling modulators emerge from the bunker. J Cell Sci. 2006;119:4803–4810. doi: 10.1242/jcs.03270. [DOI] [PubMed] [Google Scholar]
- 28.Aghi M, Rabkin SD, Martuza RL. Angiogenic response caused by oncolytic herpes simplex virus-induced reduced thrombospondin expression can be prevented by specific viral mutations or by administering a thrombospondin-derived peptide. Cancer Res. 2007;67:440–444. doi: 10.1158/0008-5472.CAN-06-3145. [DOI] [PubMed] [Google Scholar]
- 29.Mahller YY, Vaikunth SS, Currier MA, Miller SJ, Ripberger MC, Hsu YH, et al. Oncolytic HSV and erlotinib inhibit tumor growth and angiogenesis in a novel malignant peripheral nerve sheath tumor xenograft model. Mol Ther. 2007;15:279–286. doi: 10.1038/sj.mt.6300038. [DOI] [PubMed] [Google Scholar]
- 30.Cinatl J, Jr, Michaelis M, Driever PH, Cinatl J, Hrabeta J, Suhan T, et al. Multimutated herpes simplex virus g207 is a potent inhibitor of angiogenesis. Neoplasia. 2004;6:725–735. doi: 10.1593/neo.04265. [DOI] [PMC free article] [PubMed] [Google Scholar]
- 31.Benencia F, Courreges MC, Conejo-Garcia JR, Buckanovich RJ, Zhang L, Carroll RH, et al. Oncolytic HSV exerts direct antiangiogenic activity in ovarian carcinoma. Hum Gene Ther. 2005;16:765–778. doi: 10.1089/hum.2005.16.765. [DOI] [PubMed] [Google Scholar]
- 32.Choudhary A, Hiscott P, Hart CA, Kaye SB, Batterbury M, Grierson I. Suppression of thrombospondin 1 and 2 production by herpes simplex virus 1 infection in cultured keratocytes. Mol Vis. 2005;11:163–168. [PubMed] [Google Scholar]
- 33.Lee S, Zheng M, Kim B, Rouse BT. Role of matrix metalloproteinase-9 in angiogenesis caused by ocular infection with herpes simplex virus. J Clin Invest. 2002;110:1105–1111. doi: 10.1172/JCI15755. [DOI] [PMC free article] [PubMed] [Google Scholar]
- 34.Zheng M, Deshpande S, Lee S, Ferrara N, Rouse BT. Contribution of vascular endothelial growth factor in the neovascularization process during the pathogenesis of herpetic stromal keratitis. J Virol. 2001;75:9828–9835. doi: 10.1128/JVI.75.20.9828-9835.2001. [DOI] [PMC free article] [PubMed] [Google Scholar]
- 35.Rege TA, Fears CY, Gladson CL. Endogenous inhibitors of angiogenesis in malignant gliomas: nature's antiangiogenic therapy. Neuro Oncol. 2005;7:106–121. doi: 10.1215/S115285170400119X. [DOI] [PMC free article] [PubMed] [Google Scholar]
- 36.Shim WS, Ho IA, Wong PE. Angiopoietin: a TIE(d) balance in tumor angiogenesis. Mol Cancer Res. 2007;5:655–665. doi: 10.1158/1541-7786.MCR-07-0072. [DOI] [PubMed] [Google Scholar]
- 37.Holash J, Maisonpierre PC, Compton D, Boland P, Alexander CR, Zagzag D, et al. Vessel cooption, regression, and growth in tumors mediated by angiopoietins and VEGF. Science. 1999;284:1994–1998. doi: 10.1126/science.284.5422.1994. [DOI] [PubMed] [Google Scholar]
- 38.Kim SM, Park JH, Chung SK, Kim JY, Hwang HY, Chung KC, et al. Coxsackievirus B3 infection induces cyr61 activation via JNK to mediate cell death. J Virol. 2004;78:13479–13488. doi: 10.1128/JVI.78.24.13479-13488.2004. [DOI] [PMC free article] [PubMed] [Google Scholar]
- 39.Dorn A, Zhao H, Granberg F, Hosel M, Webb D, Svensson C, et al. Identification of specific cellular genes up-regulated late in adenovirus type 12 infection. J Virol. 2005;79:2404–2412. doi: 10.1128/JVI.79.4.2404-2412.2005. [DOI] [PMC free article] [PubMed] [Google Scholar]
- 40.Terada K, Wakimoto H, Tyminski E, Chiocca EA, Saeki Y. Development of a rapid method to generate multiple oncolytic HSV vectors and their in vivo evaluation using syngeneic mouse tumor models. Gene Ther. 2006;13:705–714. doi: 10.1038/sj.gt.3302717. [DOI] [PubMed] [Google Scholar]
- 41.Bouman HJ, Van Wimersma Greidanus TB. A rapid and simple cannulation technique for repeated sampling of cerebrospinal fluid in freely moving rats. Brain Res Bull. 1979;4:575–577. doi: 10.1016/0361-9230(79)90045-5. [DOI] [PubMed] [Google Scholar]
- 42.Zagzag D, Lukyanov Y, Lan L, Ali MA, Esencay M, Mendez O, et al. Hypoxia-inducible factor 1 and VEGF upregulate CXCR4 in glioblastoma: implications for angiogenesis and glioma cell invasion. Lab Invest. 2006;86:1221–1232. doi: 10.1038/labinvest.3700482. [DOI] [PubMed] [Google Scholar]
- 43.Lakka SS, Gondi CS, Rao JS. Proteases and glioma angiogenesis. Brain Pathol. 2005;15:327–341. doi: 10.1111/j.1750-3639.2005.tb00118.x. [DOI] [PMC free article] [PubMed] [Google Scholar]
- 44.Rege TA, Fears CY, Gladson CL. Endogenous inhibitors of angiogenesis in malignant gliomas: nature's antiangiogenic therapy. Neuro Oncol. 2005;7:106–121. doi: 10.1215/S115285170400119X. [DOI] [PMC free article] [PubMed] [Google Scholar]
- 45.Stiver SI. Angiogenesis and its role in the behavior of astrocytic brain tumors. Front Biosci. 2004;9:3105–3123. doi: 10.2741/1463. [DOI] [PubMed] [Google Scholar]
- 46.Dunlap SM, Celestino J, Wang H, Jiang R, Holland EC, Fuller GN, et al. Insulin-like growth factor binding protein 2 promotes glioma development and progression. Proc Natl Acad Sci USA. 2007;104:11736–11741. doi: 10.1073/pnas.0703145104. [DOI] [PMC free article] [PubMed] [Google Scholar]
- 47.Abounader R, Laterra J. Scatter factor/hepatocyte growth factor in brain tumor growth and angiogenesis. Neuro Oncol. 2005;7:436–451. doi: 10.1215/S1152851705000050. [DOI] [PMC free article] [PubMed] [Google Scholar]
- 48.Kaur B, Brat DJ, Devi NS, Van Meir EG. Vasculostatin, a proteolytic fragment of brain angiogenesis inhibitor 1, is an antiangiogenic and antitumorigenic factor. Oncogene. 2005;24:3632–3642. doi: 10.1038/sj.onc.1208317. [DOI] [PubMed] [Google Scholar]
- 49.Kaur B, Brat DJ, Calkins CC, Van Meir EG. Brain angiogenesis inhibitor 1 is differentially expressed in normal brain and glioblastoma independently of p53 expression. Am J Pathol. 2003;162:19–27. doi: 10.1016/S0002-9440(10)63794-7. [DOI] [PMC free article] [PubMed] [Google Scholar]
Associated Data
This section collects any data citations, data availability statements, or supplementary materials included in this article.
Supplementary Materials
Supplementary Figure S1. Effect of CPA treatment on OV propagation in rats with brain tumors.
Supplementary Table S1. Sources of patient-derived primary tumor cell lines.
Supplementary Table S2. Primers used for quantitative real-time polymerase chain reaction in this study.