

Abstract
An inverse relationship between workplace status and morbidity is well established; higher job status has been associated with reduced risks of heart disease, hypertension, and injury. Most research on job status, however, has focused on salaried populations, and it remains unclear whether job status operates similarly among hourly workers. Our objectives were to examine whether hourly status itself influences risk of hypertension after adjustment for socioeconomic confounders, and to explore the role of fine-scale job grade on hypertension incidence within hourly and salaried groups. We examined data for 14,999 aluminum manufacturing employees in 11 plants across the U.S., using logistic regression with adjustment for age, sex, race/ ethnicity and other individual characteristics. Propensity score restriction was used to identify comparable groups of hourly and salaried employees, reducing confounding by socio-demographic characteristics. Job grade (coded 1 through 30, within hourly and salaried groups) was examined as a more refined measure of job status. Hourly status was associated with an increased risk of hypertension, after propensity restriction and adjustment for confounders. The observed effect of hourly status was stronger among women, although the propensity-restricted cohort was disproportionately male (96 %). Among salaried workers, higher job grade was not consistently associated with decreased risk; among hourly employees, however, there was a significant trend, with higher job grades more protective against hypertension. Increasing the stringency of hypertension case criteria also increased the risk of severe or persistent hypertension for hourly employees.
Keywords: hypertension, manufacturing employment, occupational status, job grade, propensity scores, salaried vs hourly workers, USA
Introduction
An inverse relationship between job status and cardiovascular health is well established, with higher status conferring reduced risks of heart disease (Marmot et al., 1997; Kivimaki et al., 2007), hypertension (Calhoun et al., 1998), and myocardial infarction (Moller et al., 2005). Most prior research on job status, however, has focused on administrative (i.e., “white-collar”) populations (Marmot et al., 1991), and it remains unclear whether job status operates comparably among blue-collar workers. In addition, occupational classifications used in most epidemiological studies (i.e. manual/ non-manual distinctions (Macleod 2005), professional grade (Marmot et al., 1984; Schaufelberger & Rosengren 2007), and census job classifications (Stevens and Cho 1985)) have proven too coarse to capture fine-scale status differences most relevant to employee experiences within an occupational setting. Refined explorations of job status within occupational classes may reveal important nuances in the association between job status and health.
There is broad evidence linking psychosocial work characteristics to cardiovascular risk (Chandola et al., 2006; Barbini et al., 2005; Kuper et al., 2003). Increased risks of hypertension and elevated ambulatory blood pressure have been observed with chronic job strain (Markovitz et al., 2004; Landsbergis et al., 2003), low job control (Steptoe 2001), and stressful work conditions including low promotion potential, low participation in decision-making, communication difficulties, unsupportive co-workers and supervisors, and overall job dissatisfaction (Matthews et al., 1987). Several biological and psychological pathways linking psychosocial work conditions and hypertension have been proposed (Chandola et al., 2008), including chronic stress, irritation (Folkow 1981), suppression of anger and ignoring problems (Cottington et al., 1986), and selection by personality type (Esler et al., 1977). More generally, chronic stress can produce cumulative wear and tear (allostatic load) and suppress immune function over time, increasing general susceptibility, reducing systemic regulation, and increasing broad disease risk (McEwen and Seeman, 1999).
Low job status has been linked with hypertension and cardiovascular disease risk (Barbini et al., 2005; Aboa-Eboule et al., 2007), though this association can be difficult to interpret, as job status can represent many physical and psychosocial aspects of work, as well as socioeconomic risk factors and health behaviors outside of work (Erikson 2006; Kaplan & Keil 1993; Warren et al., 2004). Studies have attempted to disaggregate job grade into physical and psychosocial components (MacDonald et al., 2001), including income (Lecluyse 2007), effort-reward imbalance (Merritt et al., 2004), perceived fairness (De Vogli et al., 2007), knowledge of job-related risks and behaviors (Nourjah et el., 1994; Niknian et al., 1991) and job strain (decision latitude vs. demands) (Blumenthal, Thyrum & Siegel 1995; Kivimaki et al., 2006a; Steptoe & Willemsen, 2004). Due to this complex exposure mix, many successful studies have focused on few industries with fairly comparable employees, wherein working conditions can be measured and isolated (Matthews et al., 1987; Kasl 1981).
Job grade has been examined as a marker of socioeconomic status (SES) (Marmot & Smith 1991; Singh-Manoux, Marmot & Adler 2005), particularly in studies of white-collar workers. Across more diverse cohorts, job grade may reflect a host of social, economic and psychosocial risk factors varying with social class (Erikson 2006; Kaplan & Keil 1993; Warren et al., 2004), and the effect of job grade on health can vary by occupational class and setting (Sparacino et al., 1982). Among white-collar workers, job grade may be mediated through status and decision-making authority; among blue-collar workers, job grade may capture differences in status and decision-making authority as well, but also chemical exposures, physical demands, and workpace. Some factors, such as income and job security, mediate effects of job grade in both groups.
A persistent challenge to research on job status and health, and a controversial issue in the literature, is potential reverse causation (Bartley 1988). Job status may act to improve health through multiple pathways, including psychosocial factors (e.g., perceived status) and tangible assets (e.g., income) – this perspective is referred to “social causation.” Alternatively, poor health may lead to lower job status; in competitive economies, sicker individuals may be “selected into” lower-status jobs or unemployment – this is the “selection” hypothesis, or downward social mobility. Studies have attempted to apportion the job status-health association into causative and selective components using longitudinal data (Heponiemi et al., 2007; Chandola et al., 2003; Claussen et al., 2005), with limited success.
Causative and selective components of job status are difficult to disentangle, in part, due to persistent confounding by social class. Blue-collar workers in competitive economies tend to have lower SES, with lesser education and job options. In the U.S., blue-collar jobs are disproportionately performed by males and minorities, and may include a higher prevalence of smokers (Kivimaki et al., 2006b). Comparing blue-and-white collar groups thus raises the inherent challenge of confounding by a host of working and non-working factors.
In comparisons across very different occupational groups (e.g., blue- and white-collar workers), there is a risk of off-support inference if there is little overlap on key covariates, such as income or education between groups, i.e, strong confounding. Such comparisons between noncomparable groups can lead to biased effect estimates. We have used propensity score (PS) methods to reduce off-support inference by comparing only those individuals with similar probabilities of exposure, given measured pre-exposure characteristics (Kurth et al., 2006).
Here, we compare incident hypertension risks among full-time hourly (mainly production, or “blue-collar”) and salaried (production supervisors and administrative, largely “white-collar”) personnel in a large aluminum manufacturing company. Incident hypertension is examined as a broad indicator of systemic illness, as an important risk factor for stroke and ischemic heart disease (Brown et al., 2007), which affects nearly 65 million Americans (Fields et al., 2004). Hypertension shows consistent inverse associations with SES in developed countries (Calhoun et al., 1998), and has been associated with social status in humans and primates (Kaplan and Manuck 1999).
Examining hypertension offers several practical advantages. First, it displays adequate prevalence for epidemiological study, allowing comparison across small population subgroups. Second, as an early marker of cardiovascular risk, hypertension should minimally influence an individual's current ability to work, thus reducing reverse causation relative to more progressed disease (e.g., myocardial infarction), where sub-clinical measures (e.g., carotid intima media thickness) are not available. Third, effects on hypertension are meaningful for clinical practice, as comparable results have been shown using hypertension, heart rate, or other markers of systemic illness (Zivkovic et al. 2003).
We considered, first, whether hourly (blue-collar) workers display higher risks of hypertension compared to salaried (white-collar) employees, after correction for sociodemographic confounders and individual risk factors. To account for strong sociodemographic biases in job placement, we explored and applied propensity score analyses. Propensity stratification distinguished between selection and exposure effects by identifying comparable sub-groups of hourly and salaried employees with respect to pre-hire characteristics, minimizing off-support inference (i.e. inferences based on non-comparable groups), and reducing confounding. Finally, we explored within-class effects of refined job grade scales, to examine whether relative grade may influence hypertension risk differently within hourly and salaried classes.
Methods
Data collection
We examined health and employment records for 14,950 full-time hourly (mainly production) and salaried (production supervisors and administrative personnel) working in 11 U.S. Alcoa aluminum manufacturing plants. All available data was obtained for all full-time active employees as of January 1, 2000. Health outcomes data were drawn from company medical insurance claims files for the seven-year period January 1, 1996 to December 31, 2002. To ensure completeness in case ascertainment, we excluded employees using other primary health insurance; we restricted eligibility to workers with at least one medical claim during follow-up, which retained over 98% of employees.
Subjects with pre-existing hypertension or ischemic heart disease were excluded; eligible subjects were further required two hypertension-free years to establish incident illness. The follow-up period thus begins on the latter of January 1, 1998, or two years after hire date, and ends on the earliest of: December 31, 2002, date of termination, or the employee's 65th birthday (when Medicare coverage begins). New onset cases required two or more diagnoses, as recommended by prior verification health claims data against medical record review (Solberg et al., 2006). Hypertension diagnoses were face-to-face medical encounters classified as ICD-9 codes 401-405. Eighty-one cases diagnosed with heart disease (ICD-9 codes 410-414) prior to hypertension diagnosis were eliminated. Medical insurance claims data use for this cohort is detailed in Cullen et al., 2006.
Smoking, height, and weight were identified from on-site annual health examination records, using the last record available upon review in 2002; in most cases, the record used is from the 2001 or 2002 medical exam. W-2 income data, which are employer's records of all wages dispersed to each employee per calendar year, provided to the federal government for taxation purposes, was available only for 2002-2004; mean income was calculated excluding income-years below $20,000, indicating non-full-time employment, and divided into tertiles. Income for persons leaving full-time work before 2002 is classified as unknown.
Demographic characteristics (sex, age, date of birth, race/ ethnicity, education) and employment characteristics (hourly/ salaried status, job grade, dates of hire and job termination, plant location) were obtained from employment files (PeopleSoft). As these characteristics changed little over follow-up, employees were assigned characteristics of the job held on January 1, 2000, at center of follow-up. Age on this date was centered and transformed to reduce collinearity between higher-order terms (age2, age3), to adjust for non-linear age effects in all models.
Job grade on January 1, 2000 was extracted from standard codes in personnel (PeopleSoft) files. Job grades, ranging from 2 to 36 on separate hourly and salaried scales, are uniformly used across company locations. We collapsed sparsely populated grades above 30 into groups of 30 or higher. Categorical job grade analyses use a concatenated 2 through 60 scale, wherein hourly jobs populate values 2 through 30, and salaried jobs the values 32 through 60.
Job grade discriminates jobs by experience, skill level, seniority, and prestige (i.e., hourly jobs above 23 require a technical skill, such as electrician or maintenance mechanic). The per-hour pay rate for hourly workers is fixed to job grade by union contract, but total income may include overtime pay. For salaried workers, job grade determines base salary, although bonuses and other benefits vary within grades. Thus, the job grade-income association was weaker than expected, and was stronger among salaried (r = 0.57; p < .0001) than hourly employees (r = 0.15; p < .0001). Importantly, job grade and income data allow distinguishing between health effects of status and those of income.
Analytic approach
To estimate effects of hourly status on hypertension, we fit time-weighted logistic regressions (Hsu et al., 2006) rather than Cox models, which was appropriate given our relatively short follow-up (maximum of 5.0 years), relatively little variation in follow-up (70% of eligible employees contributed five years), and few time-varying covariates. Cumulative incidence of hypertension was calculated as the proportion of newly diagnosed cases during follow-up, following a 2-year wash-out. We reported odds ratios (ORs) from logistic regression models predicting the effects of job status on hypertension, adjusted for age and other confounders (Adj OR).
Propensity score analyses
Propensity scores (PS) were created to reduce confounding by factors associated with selection into hourly (vs. salaried) jobs, and off-support inference in comparing across very different occupational classes. The propensity score is the probability of an individual being exposed (i.e., holding an hourly job), given their observed pre-exposure characteristics (Kurth et al., 2006). Propensity-adjustment methods available include restriction to subjects with similar PS, matching on PS, stratifying by PS, weighting by PS, or include PS as covariates in the final health outcomes model (Kurth et al., 2006). Because we wish to reduce confounding by socioeconomic characteristics predicting likelihood of hourly status, we opted to compare hourly and salaried workers with similar PS. The distinct bi-modal PS distribution in our salaried population (Figure 1b) suggested propensity restriction, examining only hourly and salaried persons likely to be assigned hourly jobs (Pr > 0.5). The PS was created using logistic regression models estimating each individual's probability of being hourly as a function of age, sex, education, race/ ethnicity, smoking, and BMI. Selected covariates were relatively stable over time, and display significantly predict hourly status. Job grade and income were omitted as outcomes, rather than predictors, of job assignment.
Figure 1.
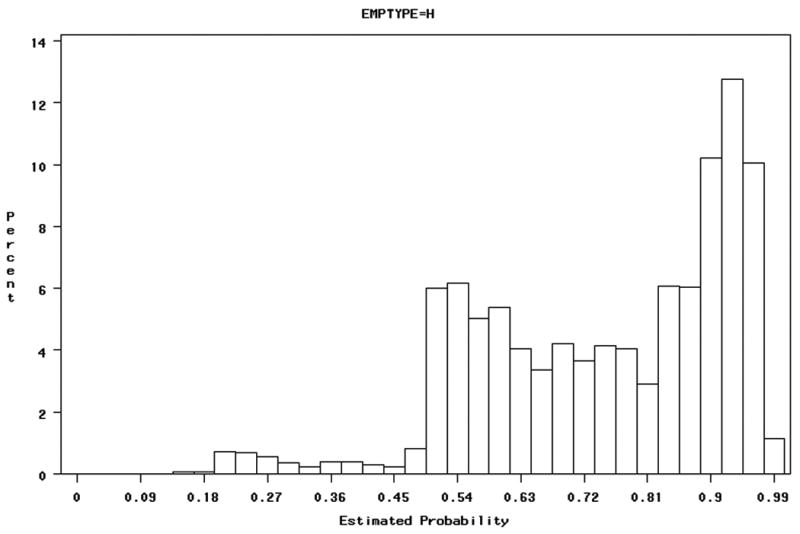
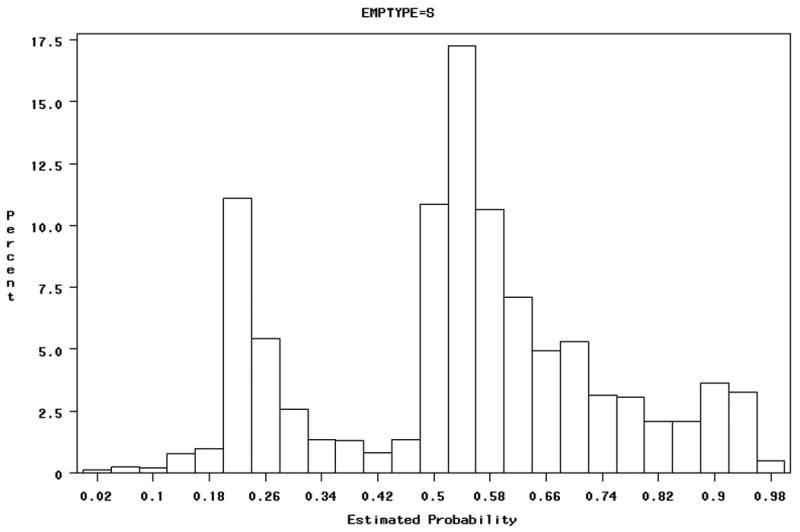
Propensity score distributions for all employees
Figure 1a: Propensity scores for hourly employees:
Figure 1b: Propensity scores for salaried employees:
We applied both propensity stratification (Pr > 0.5) and multivariate adjustment in our final models, to produce a conservative estimate of the effect of hourly status on hypertension.
Job grade analyses
We examined effects of job grade on hypertension within propensity-restricted hourly and salaried classes. First, we examined job grade as a continuous variable. Because job grade effects may differ by job class, we allowed an interaction between job grade and class. Because the marginal effect of job grade unit may differ over the range, we then concatenated the hourly and salaried job grades into 20 distinct categories for our main analysis. Finally, we explored this nonlinearity in job grade effects in both groups, using natural splines in Proc GLM (Ruppert et al., 2003).
Sensitivity analyses
We tested the sensitivity of our results to perturbations in the analytic methods and modeling approach. First, internal cross-validation, testing model sensitivity to influential observations, was performed by dropping each observation consecutively and comparing resultant model fits. We examined odds ratios for alternative disease classifications using number of visits as a surrogate for illness severity, varying the case criteria from one to five hypertension-related visits. Because some confounders were measured after health outcomes, we examined the effect of excluding these confounders (income, BMI, smoking). We tested sensitivity of our non-linear age adjustment using fine-scale age categories, and also tested our adjustment for BMI in tertiles by comparing to U.S. National Heart, Lung, and Blood Institute criteria (NHLBI, 1998).
Sensitivity analyses for propensity score models and application
The propensity score model was validated by comparison to a more parsimonious model including only stable pre-hire characteristics (age at hire, sex, race/ ethnicity, education). We tested the model's sensitivity to correction for region (plant location), and to excluding two plants which only offer salaried positions (as some employees would likely hold hourly jobs elsewhere, and thus are mis-classified).
We compared alternative propensity score applications, including other restriction criteria, stratification, and propensity-weighting. Because our cohort contains many more exposed (hourly) than unexposed (salaried) workers, and propensity distributions were highly unbalanced, we opted not to perform 1:1 propensity matching, which would leave many hourly persons unmatched, and efficiency reduced (Kurth et al., 2006).
Our PS-restricted cohort included all persons theoretically likely to hold an hourly job (0.50 < Pr). An alternative restriction method may include only persons with mid-range scores, who theoretically could hold either job type. Thus, we compared our final results to those including only persons with scores between (0.30 to 0.70), and (0.40 to 0.60).
All statistical analyses were performed using SAS Version 9.1 (SAS Institute, Cary NC). Propensity models and models predicting hypertension were fit using Proc Logistic. Exploration of nonlinear effects for job grade was performed using natural splines in the logistic model with Proc GAM, allowing two to seven degrees of freedom.
Results
We examined job characteristics and hypertension onset among 14,799 employees in 11 plants across eight U.S. states (Indiana, Iowa, New York, North Carolina, Ohio, Pennsylvania, Tennessee, Texas). The cohort is mostly male (86 %), Caucasian (86 %), and hourly (69 %). Employees averaged 46 years old (SD = 9.1 years), and have worked for the company for 17.7 years (SD = 11 years). Women comprised 8.4 % of hourly workers and 36 % of salaried workers. 1,587 incident cases of hypertension occurred (10.7 %) during the follow-up period, with higher cumulative incidence among hourly (11.8 %) than salaried employees (8.4 %) (Table 1).
Table 1.
Characteristics for full and propensity-score restricted cohorts
| Full cohort (0 < Pr* < 100) (n = 14,799) | PS-restricted cohort (0.50 < Pr < 0.98) (n = 12,489) | |
|---|---|---|
| Mean (SD) | Mean (SD) | |
| Age (years) | 46.2 (9.1) | 46.5 (8.9) |
| Tenure (years) | 17.7 (11.1) | 18.3 (11.2) |
| Income (U.S dollars) | 61, 571 (68,571) | 61,738 (72,927) |
| BMI | 29.7 (5.3) | 29.9 (5.2) |
| Unknown BMI: | 7,065 (48 %) | 5,375 (43 %) |
| N (%) | N (%) | |
| Hourly status | 10,200 (68.9 %) | 9,249 (74.1 %) |
| Sex (Male) | 12,709 (86.2) | 11,964 (95.8 %) |
| Education: | ||
| High school grad or less | 4,981 (33.7 %) | 4,894 (39.2 %) |
| More than high school | 2,382 (16.1 %) | 1,845 (14.8 %) |
| Unknown | 7,436 (50 %) | 5,750 (46 %) |
| Race/ ethnicity: | ||
| Caucasian | 12,707 (85.9 %) | 10,801 (86.5 %) |
| African-American | 1,355 (9.2 %) | 1,103 (8.8 %) |
| Hispanic | 579 (3.9 %) | 528 (4.2 %) |
| Smoking | ||
| Current | 2,045 (13.8 %) | 1,960 (15.7 %) |
| Ever | 1,840 (12.4 %) | 1,748 (14.0 %) |
| Never | 3,028 (20.5 %) | 2,597 (20.8 %) |
| Unknown | 7,886 (53.3 %) | 6,184 (49.5 %) |
| Hypertension Cases (2+ diagnoses after run-in) | 1,587 (10.7 %) | 1,428 (11.4 %) |
Pr = propensity score
Overall effect of hourly status on hypertension
In bivariate models adjusted only for age (age, age2, age3), hourly status was significantly associated with hypertension (OR = 1.30 (95% CI = 1.23 - 1.38) (Table 2). Hypertension risks were increased with tenure, age, BMI, male sex, former smoking, African-American race, and lower income. Hispanic workers showed lower hypertension risk relative to Caucasians (OR = 0.82 (95% CI = 0.71 - 0.95)), while low education (high school or less) conferred no significant effect.
Table 2.
Odds Ratios from bivariate logistic regression models for hypertension risk in the full cohort (n = 14,799). ORs are adjusted for a quadratic function of age, and weighted by person-time.
| OR (95 % CI) | ||
|---|---|---|
| Employment status | Hourly | 1.30 (1.23 - 1.38) |
| Salaried | 1.00 | |
| Age (years) | 1.044 (1.04 - 1.05) | |
| Tenure (per year) | 1.009 (1.006 – 1.01) | |
| Job grade | 0.992 (0.989 - 0.996) | |
| BMI | Above-median | 2.34 (2.19 – 2.51) |
| Below-median | 1.00 | |
| Income | Lowest tertile (below $44,464) | 1.28 (1.20 - 1.37) |
| Medium ($44,464 - $65,943) | 1.11 (1.04 - 1.18) | |
| Highest tertile (above $65,943) | 1.00 | |
| Sex | Male | 1.22 (1.13-1.32) |
| Female | 1.00 | |
| Education | ||
| High school grad or less | 0.99 (0.92 – 1.06) | |
| More than high school | 1.00 | |
| Race/ ethnicity | ||
| African-American | 1.50 (1.40-1.62) | |
| Hispanic | 0.82 (0.71-0.95) | |
| Caucasian | 1.00 | |
| Smoking | ||
| Current | 0.988 (0.91 – 1.07) | |
| Ever | 1.17 (1.08 – 1.27) | |
| Never | 1.00 |
In multivariable logistic regression for the full cohort (Table 3), including all predictors except job grade, the effect of hourly status was attenuated but retained significance (OR = 1.12 (95 % CI = 1.05 – 1.20). Most other significant risk factors from bivariate models retained significance, with only slightly attenuated estimates, except for low education, which confers a protective effect in multivariate models.
Table 3.
Results from multivariate models for effect of hourly status on incident hypertension. ORs adjusted for all covariates and non-linear age effects (squared, cubed terms).
| Full cohort (n = 14,303 of 14,798) (1,568 cases) | PS restricted (n = 12,489 of 14, 798) (1,428 cases) | ||
|---|---|---|---|
| OR (95% CI) | OR (95% CI) | ||
| Employment status: | |||
| Hourly | 1.12 (1.05-1.20) | 1.09 (1.01 - 1.18) | |
| Salaried | 1.00 | 1.00 | |
| Age (year) | 1.03 (1.02-1.04) | 1.03 (1.02 - 1.04) | |
| Tenure (per year) | 1.009 (1.006-1.01) | 1.009 (1.005 - 1.01) | |
| BMI | Above-median | 2.32 (2.16-2.48) | 2.29 (2.13 - 2.46) |
| Below-median | 1.00 | 1.00 | |
| Income | Lowest tertile | 1.20 (1.11-1.29) | 1.19 (1.10 - 1.28) |
| Medium tertile | 1.04 (0.96-1.20) | 1.03 (0.96 - 1.12) | |
| Highest tertile | 1.00 | 1.00 | |
| Sex | Male | 1.17 (1.07-1.27) | 0.93 (0.82 – 1.06) |
| Female | 1.00 | 1.00 | |
| Education | |||
| High school grad or less | 0.88 (0.81-0.94) | 0.90 (0.83 - 0.98) | |
| More than high school | 1.00 | 1.00 | |
| Race/ ethnicity | |||
| African-American | 1.41 (1.31 - 1.53) | 1.31 (1.20 - 1.42) | |
| Hispanic | 0.75 (0.65 - 0.87) | 0.74 (0.64 - 0.86) | |
| Caucasian | 1.00 | 1.00 | |
| Smoking | |||
| Current vs. Never | 1.05 (0.97 - 1.14) | 1.03 (0.95 - 1.13) | |
| Ever vs. Never | 1.17 (1.08 - 1.27) | 1.15 (1.06 - 1.25) | |
| Never | 1.00 | 1.00 | |
| Model fit: | c = 0.681 | c = 0.670 | |
| AIC = 44,239 | AIC = 39,991 | ||
| (vs. 47,005) | (vs. 42,187) |
Propensity restriction
We develop a logistic model to predict each worker's probability of holding an hourly job (the propensity score), based upon age, sex, education, race/ ethnicity, smoking, and BMI (Table 4); the c-statistic was 0.78, indicating strong model fit. It should be noted that the PS is based on measured pre-hire characteristics; as in all epidemiologic analyses, we must assume there is no residual bias due to unmeasured confounders. The propensity distribution is presented in Figure 1, by hourly/ salaried status. Higher probabilities indicate greater likelihood of hourly status. Note that propensity scores for hourly employees are skewed to the right, as expected (Figure 1a); propensity scores for salaried employees are bi-modal, with modes at 0.25 and 0.55 (Figure 1b).
Table 4.
Propensity score model: Odd Ratios predicting likelihood of hourly status (n = 14,304 of 14,799 retained)
| OR (95% CI) | ||
|---|---|---|
| Age | (centered) | 1.015 (1.005-1.03) |
| (squared) | 1.004 (1.003-1.004) | |
| (cubed) | 1.000 (1.000-1.000) | |
| Education | High school or less | 5.33 (4.67-6.08) |
| More than high school | 1.00 | |
| Unknown | 1.67 (1.35-2.08) | |
| BMI | Above-median | 1.55 (1.37-1.76) |
| Below-median | 1.00 | |
| Unknown | 0.38 (0.31-0.48) | |
| Male | 3.95 (3.53-4.42) | |
| Race/ ethnicity | ||
| African-American | 2.02 (1.73-2.36) | |
| Hispanic | 1.28 (1.03-1.60) | |
| Caucasian | 1.00 | |
| Smoking | Current | 2.35 (1.99-2.78) |
| Ever | 1.16 (0.99-1.36) | |
| Never | 1.00 | |
| Unknown | 1.80 (1.47-2.20) |
Model fit: c=0.777; AIC = 14,679.6 (vs. 17,819.4 intercept only)
Most overlap in propensity scores between hourly (Fig 1a) and salaried workers (Fig 1b) was in the range of 0.50 to 0.98. For comparability between groups, we thus restricted our main analysis to workers with Pr > 0.50, indicating greater likelihood of hourly than salaried status. The resultant restricted cohort thus contains higher percentages of hourly workers, men, and less-educated individuals than does the full cohort (Table 1). Refitting the multivariable hypertension model using this propensity-restricted cohort (Table 4), hourly status remained a significant predictor of hypertension (Adj OR = 1.09 (95 % CI = 1.01 – 1.18). All other risk factors retained significance except male sex. A sex-stratified analysis suggested that the hourly status effect was stronger among women than men (data not shown), although the results is under-powered; women make up only 4.2 % of the PS-restricted cohort.
Effect of job grade on hypertension
While men were more likely to hold hourly jobs, women in both classes were more likely to hold low-grade jobs. Before adjustment for tenure (years on the job), education, age, or income, the mean job grade for hourly women was 7.3 (SD = 5.7), versus 12.4 (SD = 8.3) for men. For salaried women, job grade averaged 10.9 (SD = 4.6) versus 14.8 (SD = 5.7) for men.
In the PS-restricted cohort, we job grade was inversely associated hypertension risk, after adjustment for confounders including tenure. Similar linear trends were observed for hourly and salary workers (Adj OR = 0.99), but reached statistical significance only among hourly workers (Adj OR = 0.995 (95 % CI = 0.992 – 0.999). Examining job grade as a categorical scale (Figure 2), we see that, relative to the lowest grade, almost all other hourly grades had lower adjusted odds of hypertension.
Figure 2.
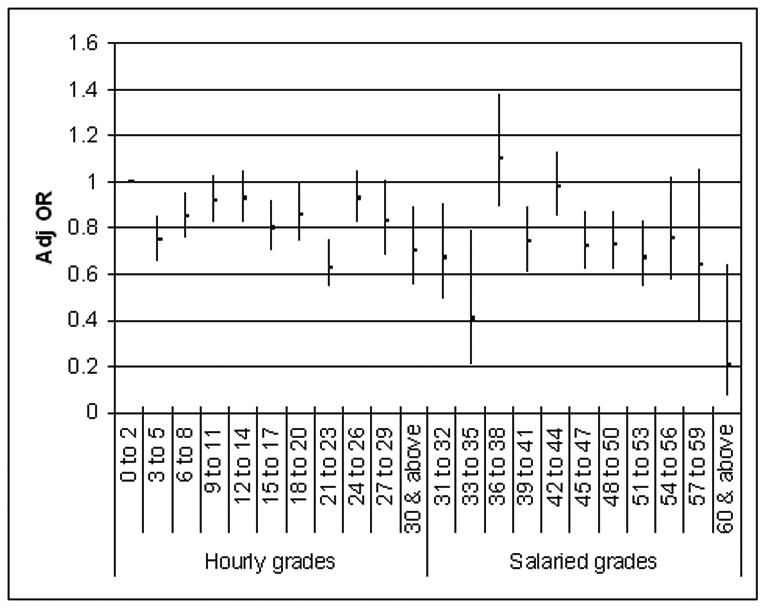
Adjusted ORs for effect of job grade (by groups of 3 grades) on hypertension within the PS-restricted cohort. Reference is hourly grades 0-2.
We incorporated categorical job grade into multivariate hypertension models including hourly and salaried employees, each compared to their lowest-grade reference group (Table 5). All hourly grades show lower adjusted odds relative to their lowest grade, and in most cases the effect is significant, despite small within-grade samples sizes. Among the salaried workers, job grade effects are less clear; persons in job grades 6-to-8 and 12-to-14 have higher adjusted odds of hypertension relative to the lowest-grade, but only the highest-grade employees show a significantly protective effect.
Table 5.
Results from multivariate models of job grade on hypertension, for hourly and salaried employees in the PS-restricted cohort, corrected for non-linear age effects.
| PS restricted cohort (n = 9,232 of 9,249) (1,113 cases; 12.1 %) | ||
|---|---|---|
| Adj OR (95% CI) | ||
| Hourly Job grades | <= 2 | 1.00 |
| 3 to 5 | 0.75 (0.66 – 0.85) | |
| 6 to 8 | 0.85 (0.76 – 0.95) | |
| 9 to 11 | 0.92 (0.82 – 1.03) | |
| 12 to 14 | 0.93 (0.82 – 1.05) | |
| 15 to 17 | 0.80 (0.70 – 0.92) | |
| 18 to 20 | 0.86 (0.74 – 0.99) | |
| 21 to 23 | 0.63 (0.54 – 0.75) | |
| 24 to 26 | 0.93 (0.82 – 1.05) | |
| 27 to 29 | 0.83 (0.68 – 1.01) | |
| 30 + | 0.70 (0.55 – 0.89) | |
| Salaried Job grades | <= 2 | 1.00 |
| 3 to 5 | 0.62 (0.30 – 1.26) | |
| 6 to 8 | 1.66 (1.16 – 2.38) | |
| 9 to 11 | 1.11 (0.79 – 1.56) | |
| 12 to 14 | 1.47 (1.07 – 2.02) | |
| 15 to 17 | 1.08 (0.78 – 1.49) | |
| 18 to 20 | 1.10 (0.79 – 1.53) | |
| 21 to 23 | 1.01 (0.71 – 1.43) | |
| 24 to 26 | 1.14 (0.76 – 1.72) | |
| 27 to 29 | 0.96 (0.54 – 1.71) | |
| 30 + | 0.31 (0.10 – 0.99) | |
| Age (years) | 1.033 (1.03 - 1.04) | |
| Tenure (year) | 1.007 (1.004 - 1.011) | |
| BMI | Above-median | 2.31 (2.15 - 2.48) |
| Below-median | 1.00 | |
| Income | Lowest tertile | 1.16 (1.07 - 1.26) |
| Medium tertile | 1.006 (0.93 - 1.09) | |
| Highest tertile | 1.00 | |
| Sex | Male | 0.96 (0.85 – 1.10) |
| Female | 1.00 | |
| Education | High school grad or less | 0.90 (0.83 - 0.98) |
| More than high school | 1.00 | |
| Race/ ethnicity | African-American | 1.32 (1.21 - 1.43) |
| Hispanic | 0.74 (0.64 - 0.86) | |
| Caucasian | 1.00 | |
| Smoking | Current vs. Never | 1.01 (0.93 - 1.11) |
| Ever vs. Never | 1.16 (1.06 - 1.26) | |
| Never | 1.00 | |
| Model fit: c = 0.672 | ||
| AIC = 39,778 | ||
| (vs. 42,003.6) |
Results indicate non-linearity in the effect of job grade for both groups, which we explored using natural splines in Proc GAM, allowing up to seven degrees of freedom. After adjusting for age, however, there was no significant departure from linearity, although the negative linear trend persisted.
Sensitivity analyses
Regression diagnostics did not indicate any influential observations, based on one-at-a-time exclusion in the logistic model. Varying the case criteria, we observed elevated risks associated with hourly status, an effect which was magnified with increasing stringency of disease criteria (Table 7), for both the full and PS-restricted cohorts. Using the least stringent criteria of one hypertension-related medical claim (16.4 % incidence), we observed effects comparable to our final model (Adj OR = 1.09 (95 % CI = 1.02-1.16)). For the most stringent criteria, five or more visit claims (7.2 % incidence), the adjusted OR is 1.23 (1.13-1.35) in the full, and 1.19 (1.09 - 1.31) in the PS-restricted cohort. If a greater number of medical visits indicates more progressed or severe illness, then we may infer that hourly status is associated with greater illness severity, as well as cumulative incidence.
Table 7.
Sensitivity analyses for relative risks of hourly versus salaried status on hypertension in propensity-restricted cohort, by increasing the specificity of case criteria
| Criteria (diagnoses) | PS-restricted cohort: | Full cohort: | ||
|---|---|---|---|---|
| Cases | Adj OR (95% CI) | Cases | Adj OR (95% CI) | |
| One or more | 2,042 | 1.09 (1.02-1.16) | 2,255 | 1.11 (1.05-1.18) |
| Two or more | 1,428 | 1.09 (1.01-1.18) | 1,568 | 1.12 (1.05-1.20) |
| Three or more | 1,288 | 1.12 (1.03-1.21) | 1,417 | 1.15 (1.07-1.24) |
| Four or more | 1,088 | 1.14 (1.05-1.24) | 1,187 | 1.20 (1.10-1.30) |
| Five or more | 894 | 1.19 (1.09-1.31) | 973 | 1.23 (1.13-1.35) |
| P-value for trend = | 0.01 | 0.004 | ||
Correcting for age using five-year categories, rather than continuous non-linear terms, increased the observed effect of hourly status on hypertension (Adj OR = 1.11 (95% CI = 1.03 – 1.20)). The 5-year categories may not adequately account for sharply increasing risks among older workers, and we opted to retain our original model, producing a more conservative estimate of the hourly status effect.
Due to temporality concerns, we removed confounders measured after some hypertension diagnoses (e.g., BMI, smoking, income), which increased the observed effect of hourly status on hypertension in our propensity-restricted cohort (Adj OR = 1.18 (95% CI = 1.10 – 1.26)). Removing any of these confounders singly produced Adj OR's of 1.13 to 1.14. As such, these factors did correct for some confounding, in the direction hypothesized, and may over-adjust if, for example, hypertension leads to increased BMI. We opted to retain our final result of Adj OR = 1.09 as a conservative estimate.
Adjusting for BMI in our final model for hypertension using NHLBI criteria for men and women (NHLBI 1998) did not alter our effects of interest, but did indicate higher risks for obese persons of both sexes, after multivariate correction.
Sensitivity analyses for propensity score models and score application
We tested a more parsimonious propensity model, excluding covariates which may have changed since hire (e.g., BMI, smoking), producing precisely the same division of individuals into high- and low-propensity groups (using Pr > 0.50), and accordingly the same PS-restricted hypertension model. Propensity model fit was only marginally reduced (from c = 0.78 to 0.73), and sex and education remained the strongest predictors of hourly status. Both propensity models were tested for robustness to plant location (region) and exclusion of two plants hiring only salaried employees; none of the original predictors were reduced by more than 10%, all retained significance, and a consistent propensity distribution was again produced.
Propensity score application
Exploring alternative cohort restriction methods, we find that in multivariate models restricted to mid-range propensity scores (0.30 < Pr < 0.70) (n = 6,210), hourly status remains a strong predictor of hypertension (Adj OR = 1.32; 95 % CI = 1.19 – 1.45). All other predictors, except for sex, remain significant. Further restricting our cohort to those with 0.40 < Pr < 0.60 (n = 3,946), the hourly status effect is slightly attenuated but remains significant (Adj OR = 1.22; 95 % CI = 1.07 – 1.38).
Propensity stratification
Stratifying the original cohort into evenly-numbered propensity score quintiles and deciles, as described in (Kurth et al., 2006), we found that hourly status significantly increased hypertension risk in most strata, despite significant imbalance in the number of salaried and hourly persons in each (data not shown).
Discussion
Our results indicate elevated hypertension risks among hourly employees, which persist after correction for confounding using propensity scores and multivariate adjustment. Similarly, tenure (years on the job) increased risks, particularly among hourly (“blue-collar”) workers, after age-correction. The hourly effect was significant using multiple disease severity classifications, and increased with more stringent criteria, suggesting greater illness severity or chronicity among hourly workers. Higher job grades were generally protective against hypertension, an effect that was slightly more pronounced among hourly employees.
In general, we found a significant impact of hourly status on hypertension, risks associated with job tenure and low job grade, and evidence of the importance of sociodemographic variables (e.g., education) in predicting hourly status. Together, these results raise doubt about generalizing studies on job status and health, to date based largely on white-collar cohorts, to blue-collar workers in manufacturing or service sectors. For example, why duration of employment should increase risk of hypertension, beyond confounding by age, is unclear; this effect, stronger among hourly workers, may point to unmeasured physical, chemical or psychosocial exposures. Without assessment of chemical, heat, noise, and job strain exposures, however, we can not attribute risks to more specific factors.
The bi-model propensity distribution in our salaried cohort allowed comparisons among relatively comparable hourly and salaried persons, those likely to hold hourly jobs. Thus, although residual confounding remains possible after PS-restriction and covariate adjustment, we have reduced biases associated with socioeconomic selection into hourly jobs. Stronger associations between hourly status and hypertension with increasing outcome specificity further corroborate this trend.
Exploring multiple propensity score applications produced relatively consistent results, and we do not advocate for a specific approach, beyond the apparent appropriateness of PS-restriction for our bimodal cohort. Each method produced a significant effect of hourly status, beyond correction for sociodemographic confounders, which was slightly attenuated from the unrestricted multivariate model. Our selected method, propensity restriction with multivariate adjustment, produced the most conservative estimate of the hourly effect.
Examining refined job grade within hourly and salaried classes, we found that higher job grades were generally protective, particularly among hourly employees when compared to their lowest-grade group. Substantive differences in chemical or physical exposures (e.g. closer proximity to smelting fumes among laborers than manufacturing supervisors) may partly account for this job grade-health association. Alternatively, just as diminishing marginal health returns are known for income (Mackenbach et al., 2004; Kawachi, 2000), persons of very low grades may achieve greater marginal benefit with each grade attained, relative to persons in higher or salaried grades.
The greater effect of hourly status among women than men, although under-powered, may suggest differences in the manufacturing workplace experience by gender; in a predominantly male environment, hourly women may experience more discrimination or harassment, may work with equipment ill-suited to their body size, thus increasing task burden, or may have greater home demands or stressful life conditions not captured here. Other studies have found stronger negative health effects of blue-collar employment among women (Hall et al., 1993; Baigi et al., 2002; LaCroix 1994), as do we (14.7 % hypertension onset in hourly females vs. 7.1 % in salaried females; 14.0 % in hourly males and 11.8 % in salaried males). Our findings by gender, however, are cautiously interpreted here for several reasons. First, male sex was a strong predictor of hourly status, thus women retained in the PS-restricted cohort had very high probabilities of hourly status relative to other women, and thus are highly non-representative. Second, our propensity-restricted cohort excluded most women, producing wide confidence intervals with low statistical power. Third, because our original cohort was predominantly male (85 %), these predictors of hourly status largely reflect characteristics of men's employment placement. For these reasons, a more detailed examination of hourly status by sex will be presented in a future manuscript, using sex-stratified propensity scores incorporating broader personal characteristics (e.g., marital status, parity), which can differently influence men's and women's employment decisions and health (Brisson et al., 1999).
Limitations
Epidemiological analyses of health claims data raises several challenges, detailed elsewhere (Cullen et al., 2006). Here, we believe that most such factors serve to underestimate risks. For example, some illness-related claims may be invisible to us, if some employees use other medical insurance or, as is often the case for hypertension, the condition remains undiagnosed. Both effects would reduce observed cumulative incidence and bias results towards the null. Such under-reporting is unlikely to substantially alter our results, as over 98% of employees show at least one medical visit claim in our database (a selection criteria for this analysis), thus we may reasonably infer that included employees use company benefits as their primary insurance and have received at least one physical exam during follow-up. Also, among blue-collar active workers, we expect some healthy-worker survivor effect (Howe et al., 1988). This bias leads to underestimates of relative risks, as employees affected by chronic disease leave the workforce earlier and shift claims towards Medicare, further reducing observed incidence and biasing effects towards the null.
Because income data was available only for 2002 through 2004, income is measured after disease onset in many cases, posing problems of directionality, if hypertension leads to decreased wages. We also lack information on other household incomes. We considered back-projecting income to 1998, the start of follow-up, though doing so assumes a constant rate of income change from 1998 to 2004, before and after disease diagnosis. Sensitivity tests suggested that correcting for income, albeit imperfectly, helped to refine risk estimates. Future analyses of this prospective cohort may select follow-up and exposure (income) years to observe the prospective effect of income on illness.
Finally, the 11 plants included in this analysis did not provide adequate between-plant or regional variability for formal multi-level modeling to examine disease (and exposure) clustering by region. Future analyses will include a wider variety of plants, with individual-level and plant-level covariates, to explore the interplay among factors at both levels.
Strengths
The above limitations do not detract from our central finding of significantly elevated hypertension risks among hourly employees, which persist after multiple adjustments for sociodemographic factors associated with hourly (blue-collar) work. Further, we found an effect of job grade on health, which was slightly stronger among hourly workers, and increasing risks with tenure (years on the job) after age-correction. More broadly, the effects of job grade and other covariates differed between blue-collar and white-collar workers, raising doubt about extending previous estimates of job status and health risks derived from white-collar cohorts to blue-collar populations.
Though some data is sparse (e.g. education) and some variables were treated as fixed rather than time-varying (e.g. income) due to data limitations, our main exposure and outcome data are valid. Job status and grade were obtained directly from employment records, limiting misclassification. Medical claims and W-2 income data likewise avoid reporting biases. Moreover, our dataset allows for examination of multiple sociodemographic factors (e.g., job status, income) within both hourly and salaried (blue- and white-collar) classes in the same regions and institution, wherein all workers have identical medical benefits and provider networks. Finally, job grade and hourly/ salaried categories allowed comparisons of hypertension risks across finer-scale status gradients, within and between job classes, than have been previously reported.
Conclusions
Among a large cohort of aluminum manufacturing employees, after adjustment for socioeconomic confounding using propensity scores and time-weighted multivariate logistic regression, we found that hourly (blue-collar) status was associated with elevated hypertension risk. The observed effect of hourly status was stronger among women, although this effect was under-powered. Among hourly but not salaried employees, higher job grades were consistently associated with lower hypertension risk. Finally, increased stringency of case criteria indicated higher risks to hourly employees, associating blue-collar status with more severe or persistent illness.
Our analysis demonstrates the utility of propensity scores to reduce confounding in comparisons between white- and blue-collar manufacturing employees. In addition, we found evidence of elevated cardiovascular disease risks with blue-collar status and low job grade, after adjustment for SES. Stronger effects of hourly status in women, though under-powered in this analysis, should be examined in more detail.
Table 6.
Sensitivity analyses for relative risks of hourly and salaried status on hypertension, by propensity-adjustment method
| Number of Subjects | OR 95% CI | |
|---|---|---|
| Crude | 14,798 | 1.44 (1.36-1.52) |
| Multivariate model | 14,303 | 1.12 (1.05-1.20) |
| Regression adjusted only by PS | 14,303 | 1.15 (1.08-1.22) |
| Multivariate regression including PS | 14,303 | 1.11 (1.04-1.19) |
| PS restriction, with multivariate adjustment: | ||
| Pr > 0.50 (persons likely to be hourly) | 12,489 | 1.09 (1.01-1.18) |
| 0.30 < Pr < 0.70 (persons who could be either) | 6,210 | 1.32 (1.19-1.45) |
| 0.40 < Pr < 0.60 (persons who could be either) | 3,945 | 1.22 (1.07-1.38) |
| IPTW-weighted multivariate models: | ||
| Weighted by IPTW only** | 14,303 | 1.17 (1.04-1.31) |
| Weighted by (IPTW × Follow-up time) | 14,303 | 1.16 (1.10-1.22) |
| SMR-weighted multivariate | ||
| Weighted by SMR only** | 14,303 | 1.11 (0.96-1.28) |
| Weighted by (SMR × Follow-up time) | 14,303 | 1.10 (1.03-1.18) |
Reported main result in bold.
All models weighted by follow-up time, except for IPTW-only and SMR-only weighted models
Acknowledgments
The authors gratefully acknowledge support for this research from NIH (1RO1AG026291), Alcoa, Inc, and from the John D and Catherine T MacArthur Foundation Network on SES and Health.
Footnotes
Publisher's Disclaimer: This is a PDF file of an unedited manuscript that has been accepted for publication. As a service to our customers we are providing this early version of the manuscript. The manuscript will undergo copyediting, typesetting, and review of the resulting proof before it is published in its final citable form. Please note that during the production process errors may be discovered which could affect the content, and all legal disclaimers that apply to the journal pertain.
Contributor Information
Jane Ellen Clougherty, Email: jcloughe@hsph.harvard.edu, Harvard School of Public Health.
Ellen A Eisen, Email: eeisen@hsph.harvard.edu, University of California at Berkeley.
Martin D Slade, Email: martin.slade@yale.edu, Yale University School of Medicine.
Ichiro Kawachi, Email: ckawach@aol.com, Harvard School of Public Health.
Mark R Cullen, Email: mark.cullen@yale.edu, Yale University School of Medicine.
References
- Aboa-Eboule C, Brisson C, Maunsell E, Masse B, Bourbonnais R, Vezina M, et al. Job strain and risk of acute recurrent coronary heart disease events. Journal of the American Medical Association. 2007;298(14):1652–1660. doi: 10.1001/jama.298.14.1652. [DOI] [PubMed] [Google Scholar]
- Baigi A, Fridlund B, Marklund B, Oden A. Cardiovascular mortality focusing on socio-economic influence: the low-risk population of Halland compared to the population of Sweden as a whole. Public Health. 2002;116(5):285–288. doi: 10.1038/sj.ph.1900877. [DOI] [PubMed] [Google Scholar]
- Barbini N, Gorini G, Ferrucci L, Biggeri A. Analysis of arterial hypertension and work in the epidemiologic study “Aging, Health, and Work”. Epidemiologia E Prevenzione. 2005;29(34):160–165. [PubMed] [Google Scholar]
- Bartley M. Unemployment and health: selection or causation – a false antithesis? Sociology of Health and Illness. 1988;10(1):41–67. [Google Scholar]
- Blumenthal JA, Thyrum ET, Siegel WC. Contribution of job strain, job status, and marital status to laboratory and ambulatory blood pressure in patients with mild hypertension. Journal of Psychosomatic Research. 1995;39(2):133–144. doi: 10.1016/0022-3999(94)00087-l. [DOI] [PubMed] [Google Scholar]
- Brisson C, Laflamme N, Moisan J, Milot A, Mâsse B, Vézina M. Effect of family responsibilities and job strain on ambulatory blood pressure among white-collar women. Psychosomatic Medicine. 1999;61:205–213. doi: 10.1097/00006842-199903000-00013. [DOI] [PubMed] [Google Scholar]
- Brown DW, Giles W, Greenlund K. Blood pressure parameters and risk of fatal stroke, NHANES II Mortality Study. American Journal of Hypertension. 2007;20:338–341. doi: 10.1016/j.amjhyper.2006.08.004. [DOI] [PubMed] [Google Scholar]
- Calhoun HM, Hemingway H, Poulter NR. Socio-economic status and blood pressure: an overview analysis. Journal of Human Hypertension. 1998;12:91–110. doi: 10.1038/sj.jhh.1000558. [DOI] [PubMed] [Google Scholar]
- Chandola T, Bartley M, Sacker A, Jenkinson C, Marmot M. Health selection in the Whitehall II study, UK. Social Science & Medicine. 2003;56:2059–72. doi: 10.1016/s0277-9536(02)00201-0. [DOI] [PubMed] [Google Scholar]
- Chandola T, Brunner E, Marmot M. Chronic stress at work and the metabolic syndrome: prospective study. BMJ. 2006 doi: 10.1136/bmj.38693.435301.80. published January 2006. [DOI] [PMC free article] [PubMed] [Google Scholar]
- Chandola T, Britton A, Brunner E, Hemingway H, Malik M, Kumari M, et al. Work and coronary heart disease: what are the mechanisms? Eur Heart J. 2008 doi: 10.1093/eurheart/ehm584. published January 23, 2008. [DOI] [PubMed] [Google Scholar]
- Claussen B, Smits J, Naess O, Davey Smith G. Intragenerational mobility and mortality in Oslo: Social selection versus social causation. Social Science & Medicine. 2005;61:2513–2520. doi: 10.1016/j.socscimed.2005.04.045. [DOI] [PubMed] [Google Scholar]
- Cottington EM, Matthews KA, Talbott E, Kuller LH. Occupational stress, suppressed anger, and hypertension. Psychosomatic Medicine. 1986;48:249–260. doi: 10.1097/00006842-198603000-00010. [DOI] [PubMed] [Google Scholar]
- Cullen MR, Vegso S, Cantley L, Galusha D, Rabinowitz P, Taiwo O, et al. Use of Medical Insurance Claims Data for Occupational Health Research. Journal of Occupational and Environmental Medicine. 2006;48(10):1054–1061. doi: 10.1097/01.jom.0000241049.23093.a4. [DOI] [PubMed] [Google Scholar]
- De Vogli R, Ferrie JE, Chandola T, Kivimaki M, Marmot MG. Unfairness and health: Evidence from the Whitehall II study. Journal of Epidemiology and Community Health. 2007;61(6):513–518. doi: 10.1136/jech.2006.052563. [DOI] [PMC free article] [PubMed] [Google Scholar]
- Erikson R. Social class assignment and mortality in Sweden. Social Science & Medicine. 2006;62:2151–2160. doi: 10.1016/j.socscimed.2005.09.009. [DOI] [PubMed] [Google Scholar]
- Esler M, Julius S, Zweifler A, et al. Mild high-renin essential hypertension: neurogenic human hypertension? New England Journal of Medicine. 1977;296:405–411. doi: 10.1056/NEJM197702242960801. [DOI] [PubMed] [Google Scholar]
- Fields LE, Burt VL, Cutler JA, Hughes J, Roccella EJ, Sorlie P. The burden of adult hypertension in the United States 1999 to 2000: A rising tide. Hypertension. 2004;44:398–404. doi: 10.1161/01.HYP.0000142248.54761.56. [DOI] [PubMed] [Google Scholar]
- Folkow B. Physiological aspects of primary hypertension. Physiology Review. 1981;62:347–504. doi: 10.1152/physrev.1982.62.2.347. [DOI] [PubMed] [Google Scholar]
- Hall EM, Johnson JV, Tsou TS. Women, occupation, and risk of cardiovascular morbidity and mortality. Occupational Medicine. 1993;8(4):709–719. [PubMed] [Google Scholar]
- Heponiemi T, Elovainio M, Manderbacka K, Aalto AM, Kivimaki M, Keskimaki I. Relationship between unemployment and health among health care professionals: Health selection of health effect? Journal of Psychosomatic Research. 2007;63:425–431. doi: 10.1016/j.jpsychores.2007.04.005. [DOI] [PubMed] [Google Scholar]
- Howe GR, Chiarelli AM, Lindsay JP. Components and modifiers of the healthy worker effect: Evidence from three occupational cohorts and implications for industrial compensation. American Journal of Epidemiology. 1988;128(6):1364–1375. doi: 10.1093/oxfordjournals.aje.a115089. [DOI] [PubMed] [Google Scholar]
- Hsu CH, Green SB, He Y. A weighted logistic regression model for estimation of recurrence of adenomas. Statistics in Medicine. 2006;26(7):1567–1578. doi: 10.1002/sim.2648. [DOI] [PubMed] [Google Scholar]
- Kaplan GA, Keil JE. Socioeconomic factors and cardiovascular disease: a review of the literature. Circulation. 1993;88(4 Pt 1):1973–1998. doi: 10.1161/01.cir.88.4.1973. [DOI] [PubMed] [Google Scholar]
- Kaplan JR, Manuck SB. Status, stress, and atherosclerosis: The role of environment and individual behavior. Annals of the New York Academy of Sciences. 1999;896:145–161. doi: 10.1111/j.1749-6632.1999.tb08112.x. [DOI] [PubMed] [Google Scholar]
- Kasl SV. The challenge of studying the disease effects of stressful work conditions. American Journal of Public Health. 1981;71:682–684. doi: 10.2105/ajph.71.7.682. [DOI] [PMC free article] [PubMed] [Google Scholar]
- Kawachi I. Income inequality and health. In: Berkman L, Kawachi I, editors. Social Epidemiology. Oxford University Press; New York: 2000. [Google Scholar]
- Kivimaki M, Head J, Ferrie JE, Brunner E, Marmot M, Vahtera J, et al. Why is evidence on job strain and coronary heart disease mixed? An illustration of measurement challenges in the Whitehall II Study. Psychosomatic Medicine. 2006a;68:398–401. doi: 10.1097/01.psy.0000221252.84351.e2. [DOI] [PubMed] [Google Scholar]
- Kivimaki M, Head J, Ferrie JE, Shipley MJ, Brunner E, Vahtera J, et al. Work stress, weight gain and weight loss: evidence for bidirectional effects of job strain on body mass index in the Whitehall II study. International Journal of Obesity. 2006b;30:982–987. doi: 10.1038/sj.ijo.0803229. [DOI] [PubMed] [Google Scholar]
- Kivimaki M, Head J, Ferrie JE, Shipley MJ, Steptoe A, Vahtera J, et al. Hypertension is not the link between job strain and coronary heart disease in the Whitehall II study. American Journal of Hypertension. 2007;20(11):1146–1153. doi: 10.1016/j.amjhyper.2007.06.006. [DOI] [PubMed] [Google Scholar]
- Kuper H, Marmot M. Job strain, job demands, decision latitude, and risk of coronary heart disease within the Whitehall II study. Journal of Environment and Community Health. 2003;57:147–153. doi: 10.1136/jech.57.2.147. [DOI] [PMC free article] [PubMed] [Google Scholar]
- Kurth T, Walker AM, Glynn RJ, Chan KA, Gaziano JM, Berger K, et al. Results of multivariable logistic regression, propensity matching, propensity adjustment, and propensity-based weighting under conditions of non-uniform effect. American Journal of Epidemiology. 2006;163(3):262–270. doi: 10.1093/aje/kwj047. [DOI] [PubMed] [Google Scholar]
- LaCroix AZ. Psychosocial factors and risk of coronary heart disease in women: an epidemiologic perspective. Fertility and Sterility. 1994;62(6 Suppl 2):133S–139S. [PubMed] [Google Scholar]
- Landsbergis PA, Schnall PL, Pickering TG, Warren K, Schwartz JE. Life-Course exposure to job strain and ambulatory blood pressure in Men. American Journal of Epidemiology. 2003;157(11):998–1006. doi: 10.1093/aje/kwg095. [DOI] [PubMed] [Google Scholar]
- Lecluyse A. Income-related health inequality in Belgium: a longitudinal perspective. European Journal of Health Economics. 2007;8(3):237–243. doi: 10.1007/s10198-006-0024-3. [DOI] [PubMed] [Google Scholar]
- MacDonald LA, Karasek RA, Punnett L, Scharf T. Covariation between workplace physical and psychosocial stressors: evidence and implications for occupational health research and prevention. Ergonomics. 2001;44(7):696–718. doi: 10.1080/00140130119943. [DOI] [PubMed] [Google Scholar]
- Mackenbach JP, Martikainen P, Looman CWN, Dalstra JAA, Kunst AE, Lahelma E, et al. The shape of the relationship between income and self-assessed health: an international study. International Journal of Epidemiology. 2004 doi: 10.1093/ije/dyh338. [DOI] [PubMed] [Google Scholar]
- Macleod J, Davey Smith G, Metcalfe C, Hart C. Is subjective social status a more important determinant of health than objective social status? Evidence from a prospective observational study of Scottish men. Social Science & Medicine. 2005;61:1916–1929. doi: 10.1016/j.socscimed.2005.04.009. [DOI] [PubMed] [Google Scholar]
- Markovitz JH, Matthews KA, Whooley M, Lewis CE, Greenlund KJ. Increases in job strain are associated with incident hypertension in the CARDIA study. Annals of Behavioral Medicine. 2004;28:4–9. doi: 10.1207/s15324796abm2801_2. [DOI] [PubMed] [Google Scholar]
- Marmot MG, Smith GD. Health inequalities among British civil servants: The Whitehall II study. Lancet. 1991;337(8754):1387–1394. doi: 10.1016/0140-6736(91)93068-k. [DOI] [PubMed] [Google Scholar]
- Marmot MG. Status syndrome. How your social standing directly affects your health and life expectancy. London: Bloomsbury Publishing; 2004. [Google Scholar]
- Marmot MG, Bosma H, Hemingway H, Brunner E, Stansfeld S. Contribution of job control and other risk factors to social variations in coronary heart disease incidence. Lancet. 1997;350:235–239. doi: 10.1016/s0140-6736(97)04244-x. [DOI] [PubMed] [Google Scholar]
- Matthews KA, Cottington EM, Talbott E, Kuller LH, Siegel JM. Stressful work conditions and diastolic blood pressure among blue collar factory workers. American Journal of Epidemiology. 1987;126(2):280–290. doi: 10.1093/aje/126.2.280. [DOI] [PubMed] [Google Scholar]
- McEwen BS, Seeman TE. Protective and damaging effects of mediators of stress. Elaborating and testing the concepts of allostasis and allostatic load. Annals of the New York Academy of Sciences. 1999;896:30–47. doi: 10.1111/j.1749-6632.1999.tb08103.x. [DOI] [PubMed] [Google Scholar]
- Merritt MM, Bennett GG, Williams RB, Sollers JJ, Thayer JF. Low educational attainment, John Henryism, and cardiovascular reactivity to and recovery from personally relevant stress. Psychosomatic Medicine. 2004;66(1):49–55. doi: 10.1097/01.psy.0000107909.74904.3d. [DOI] [PubMed] [Google Scholar]
- Moller J, Theorell T, de Faire U, Ahlbom A, Hallqvist J. Work related stressful life events and the risk of myocardial infarction. Case-control and case-crossover analyses within the Stockholm heart epidemiology program (SHEEP) Journal of Environment and Community Health. 2005;59:23–30. doi: 10.1136/jech.2003.019349. [DOI] [PMC free article] [PubMed] [Google Scholar]
- National Heart, Lung and Blood Institute (NHLBI) Clinical Guidelines on the Identification, Evaluation, and Treatment of Overweight and Obesity in Adults. [July 1, 2008];1998 June 17; http://www.halls.md/body-mass-index/bmirefs.htm.
- Niknian M, Linnan LA, Lasater TM, Carleton RA. Use of population-based data to assess risk factor profiles of blue and white collar workers. Journal of Occupational Medicine. 1991;33(1):29–36. doi: 10.1097/00043764-199101000-00010. [DOI] [PubMed] [Google Scholar]
- Nourjah P, Wagener DK, Eberhardt M, Horowitz AM. Knowledge of risk factors and risk behaviors related to coronary heart disease among blue and white collar males. Journal of Public Health Policy. 1994;15(4):443–459. [PubMed] [Google Scholar]
- Pieper C, LaCroix AZ, Karasek RA. The relation of psychosocial dimensions of work with coronary heart disease risk factors: a meta-analysis of five United States data bases. American Journal of Epidemiology. 1989;129:483–494. doi: 10.1093/oxfordjournals.aje.a115159. [DOI] [PubMed] [Google Scholar]
- Ruppert D, Wand MP, Carroll R. Semiparametric Regression. Cambridge University Press; New York: 2003. [Google Scholar]
- Schaufelberger M, Rosengren A. Heart failure in different occupational classes in Sweden. Eur Heart J. 2007;28:212–218. doi: 10.1093/eurheartj/ehl435. [DOI] [PubMed] [Google Scholar]
- Singh-Manoux A, Marmot MG, Adler NE. Does subjective social status predict health and change in health status better than objective status? Psychosomatic Medicine. 2005;67:855–861. doi: 10.1097/01.psy.0000188434.52941.a0. [DOI] [PubMed] [Google Scholar]
- Solberg LI, Engebretson KI, Sperl-Hillen JM, Hroscikoski MC, O'Connor PJ. Are claims data accurate enough to measure patients for performance measures or quality improvement? The case of diabetes, heart disease, and depression. American Journal of Medical Quality. 2006;21(4):238–245. doi: 10.1177/1062860606288243. [DOI] [PubMed] [Google Scholar]
- Sparacino J, Ronchi D, Bigley TK, Flesh AL, Kuhn JW. Blood pressure of municipal employees: effects of job status and worksite. Perception and Motor Skills. 1982;55(2):563–578. doi: 10.2466/pms.1982.55.2.563. [DOI] [PubMed] [Google Scholar]
- Steptoe A, Willemsen G. The influence of low job control on ambulatory blood pressure and perceived stress over the working day in man and women from the Whitehall II cohort. Journal of Hypertension. 2004;22(5):915–20. doi: 10.1097/00004872-200405000-00012. [DOI] [PubMed] [Google Scholar]
- Stevens G, Cho JH. Socioeconomic indexes and the new 1980 census occupational classification scheme. Social Science Research. 1985;14:142–68. [Google Scholar]
- Warren JR, Hoonaker P, Carayon P, Brand J. Job characteristics as mediators in SES-health relationships. Social Science & Medicine. 2004;59:1367–1378. doi: 10.1016/j.socscimed.2004.01.035. [DOI] [PubMed] [Google Scholar]
- Zivcovic R. The relationship between heart rate and some cardiovascular risk factors. American Journal of Hypertension. 2003;16(5):A250–251. [Google Scholar]