

Abstract
Loss of β-cell function in type 1 and type 2 diabetes leads to metabolic dysregulation and inability to maintain normoglycemia. Noninvasive imaging of β-cell function in vivo would therefore provide a valuable diagnostic and research tool for quantifying progression to diabetes and response to therapeutic intervention. Because manganese (Mn2+) is a longitudinal relaxation time (T1)-shortening magnetic resonance imaging (MRI) contrast agent that enters cells such as pancreatic β-cells through voltage-gated calcium channels, we hypothesized that Mn2+-enhanced MRI of the pancreas after glucose infusion would allow for noninvasive detection of β-cell function in vivo. To test this hypothesis, we administered glucose and saline challenges intravenously to normal mice and mice given high or low doses of streptozotocin (STZ) to induce diabetes. Serial inversion recovery MRI was subsequently performed after Mn2+ injection to probe Mn2+ accumulation in the pancreas. Time-intensity curves of the pancreas (normalized to the liver) fit to a sigmoid function showed a 51% increase in signal plateau height after glucose stimulation relative to saline (P < 0.01) in normal mice. In diabetic mice given a high dose of STZ, only a 9% increase in plateau signal intensity was observed after glucose challenge (P = not significant); in mice given a low dose of STZ, a 20% increase in plateau signal intensity was seen after glucose challenge (P = 0.02). Consistent with these imaging findings, the pancreatic insulin content of high- and low-dose STZ diabetic mice was reduced about 20-fold and 10-fold, respectively, compared with normal mice. We conclude that Mn2+-enhanced MRI demonstrates excellent potential as a means for noninvasively monitoring β-cell function in vivo and may have the sensitivity to detect progressive decreases in function that occur in the diabetic disease process.
Keywords: diabetes, islet
the β-cells of the pancreatic islets of Langerhans are exclusively responsible for the synthesis and secretion of physiologically relevant amounts of insulin in response to a glucose load. It is now well recognized that loss of functional β-cell mass underlies the pathogenesis of not only type 1, but also type 2, diabetes mellitus (14). The β-cell glucose-sensing apparatus is unique and involves several key proteins, including the Glut2 glucose transporter and glucokinase, which respectively regulate glucose entry into the cell and its flux through the glycolytic pathway (11, 20). The subsequent increase in the ATP-to-ADP ratio is closely coupled to a cytosolic increase in calcium (Ca2+) concentration from both extracellular and intracellular stores, and to the ultimate release of insulin from preformed secretory granules (2).
Estimation of β-cell mass and function in vivo is necessary for the evaluation of new and emerging diabetes therapies that target β-cell neogenesis, regeneration, and functional restoration. Whereas development of technologies that permit visualization of intracellular Ca2+ accumulation and granule exocytosis in islets in vitro has been a longstanding area of intense research, the noninvasive visualization and estimation of β-cell function in vivo represent research areas that have been made possible by recent remarkable advances in the field of molecular and cellular imaging. Recent successes in noninvasive imaging of β-cell mass include targeted positron emission tomography (PET) (18, 19), bioluminescence imaging (5, 16), and iron nanoparticle-based magnetic resonance imaging (MRI) for labeling transplanted islets (3, 4, 12). Manganese (Mn2+)-enhanced MRI represents an emerging modality that has been used to visualize cellular function in heart and brain in vivo (10, 17); however, its use in assessing β-cell function is limited to studies in vitro (6). Mn2+ is a longitudinal relaxation time (T1)-shortening MRI contrast agent that enters cells such as cardiomyocytes and pancreatic β-cells through voltage-gated Ca2+ channels (6). To assess the feasibility of Mn2+-enhanced MRI for estimating β-cell function in vivo, we studied glucose-stimulated Mn2+ enhancement within the pancreas of normal and streptozotocin (STZ)-induced diabetic C57BL/6J mice. We report here for the first time the successful application of Mn2+-enhanced MRI for the noninvasive assessment of pancreatic β-cell function in vivo.
RESEARCH DESIGN AND METHODS
Animals.
Age-matched male C57BL/6J mice were obtained from Jackson Laboratory and maintained under protocols approved by the University of Virginia and Indiana University Institutional Animal Care and Use Committees under American Association for Accreditation of Laboratory Animal Care guidelines. All mice were kept under a standard light-dark cycle and were fed a regular chow diet and water ad libitum. For the studies reported here, five normal nondiabetic mice were studied as controls and compared with nine diabetic mice (5 of which received high-dose STZ and 4 of which received low-dose STZ).
MRI protocol and image analysis.
Six- to eight-month-old C57BL/6J mice were fasted >2 h and anesthetized with 1.25% isoflurane before imaging. All magnetic resonance imaging was performed on a 7.0-T Clinscan system (Bruker, Etlingen, Germany) using a mouse whole body birdcage radio frequency coil. Scout and anatomic reference images were acquired before administration of MnCl2, as were baseline inversion recovery (IR) images with inversion time (TI) adjusted to null the pancreas. Either 100 μl of saline or 100 μl of glucose (1.56 mg/g) was injected intravenously (IV) via an indwelling tail vein catheter 2 min before an intraperitoneal (IP) injection of 50 μl of MnCl2 (0.1 μmol/g). Ideally, both glucose and Mn2+ would be injected IV; however, this is technically challenging inside a small-bore MRI scanner. Instead, it was more practical to place one indwelling IV line and one indwelling IP line. Serial IR imaging was performed immediately after injection of MnCl2 at 3-min intervals for 45 min. Each mouse was imaged on separate occasions at least 3 days apart to allow for Mn2+ elimination from the pancreas, with glucose injections performed on one day and saline injections performed on the other.
The pancreas was localized with coronal images as prescribed by Grimm et al. (7). Specifically, we first acquired axial images of the mouse abdomen. Subsequently, these images were used to acquire high-resolution coronal images of the pancreas. The specific region of the pancreas that was imaged before and after injection of MnCl2 was the tail region, adjacent to the spleen, below the liver and underneath the stomach. The IR imaging sequence used a nonselective inversion pulse followed by an inversion delay time (TI) and a segmented gradient-echo readout, with 9 lines of raw data acquired per inversion. Additional MRI parameters included TI = 580 ms, time between inversion pulses = 3,000 ms, echo time (TE) = 3.05 ms, slice thickness = 0.5 mm, number of slices = 1, imaging flip angle = 20°, field of view = 35 mm, matrix = 192 × 153, receiver bandwidth = 260 Hz/pixel, and number of averages = 3. Respiratory and cardiac gating were not performed during IR imaging in order to maintain a constant TI and time between inversion pulses. In addition to improving signal-to-noise ratio, signal averaging helped to reduce artifact from physiological motion. These parameters were chosen to achieve sufficient spatial resolution to support accurate delineation of regions of interest (ROIs) in the pancreas, while also achieving high signal-to-noise ratio and adequate temporal resolution to resolve Mn2+ uptake kinetics.
Time-signal intensity curves (TICs) were generated by drawing ROIs in the pancreas, liver, and a background region with Mean Curve (Siemens Medical Solutions). The pancreas ROI included the entire contiguous tail region of the pancreas seen in the slice that was imaged, while excluding any obvious blood vessels. Baseline-subtracted TICs from the pancreas were normalized to the liver and fit to a scaled sigmoid function of the form
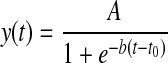 |
where A represents the function's plateau height, b is the slope, and t0 is a variable delay time. Statistical comparison was performed on the sigmoid function parameters with two-way ANOVA and pairwise Tukey tests.
Induction of diabetes with STZ and intraperitoneal glucose tolerance tests.
Diabetes mellitus was induced in 6- to 8-mo-old male C57BL/6J mice by a single IP injection of 180 mg/kg STZ (Sigma-Aldrich, St. Louis, MO) for the high-dose group and by five consecutive daily IP injections of 50 mg/kg STZ for the low-dose group. The STZ solution was prepared fresh by dissolution in 0.1 M citrate buffer. Blood glucose measurements were performed with a OneTouch Ultra 2 glucometer (LifeScan, Milpitas, CA), and blood samples were taken from cut tail tips. Mice were considered to have diabetes after three consecutive blood glucose values above 250 mg/dl.
Intraperitoneal glucose tolerance tests (IPGTTs) were performed after an overnight fast in normal and low- and high-dose STZ mice. Glucose (1 g/kg body wt) was injected IP. Blood was sampled from the tail vein at various time points, glucose was measured with a glucometer, and insulin levels were measured with an ELISA kit (Crystal Chem, Downers Grove, IL). Data between groups were compared by area under the curve (AUC) analysis and one-way ANOVA followed by the Tukey-Kramer posttest.
Pancreatic insulin content.
After in vivo experiments were complete, mice were euthanized after overnight fasting. The pancreas was removed and weighed, and pancreatic insulin was extracted in ethanol-acid as previously described (1). Pancreatic insulin concentrations were determined with a mouse insulin ELISA (Mercodia, Winston Salem, NC) and quantitated against a standard curve.
RESULTS
We used contrast-enhanced MRI to probe β-cell function in vivo in populations of normal and diabetic C57BL/6J mice after IP MnCl2 injections. In a serial collection of images (Fig. 1), enhancement of the pancreas, kidneys, and liver can be seen after an IP injection of MnCl2 in a normal mouse. Enhancement in these tissues was likely secondary to both interstitial accumulation of Mn2+ as well as specific intracellular uptake by plasma membrane Ca2+ channels. Because acute elevations in glucose lead to specific activation of voltage-gated Ca2+ channels in pancreatic β-cells, we hypothesized that administering a dose of glucose before injecting Mn2+ should cause the pancreas (but not liver) to enhance both more quickly and to a greater degree than if Mn2+ were injected after a dose of saline. To test this, we repeated MRI after intravenous glucose infusion (1.5 mg/g body wt) and compared these data to MR signal intensity after saline infusion.
Fig. 1.

Mn2+-enhanced magnetic resonance (MR) images of mouse pancreas. A: gradient-echo anatomic reference image. B: precontrast inversion recovery image with the pancreas nulled. C and D: inversion recovery images acquired 5 min (C) and 45 min (D) after injection of MnCl2. Signal intensity in the pancreas initially increased rapidly and reached plateau ∼15 min after injection of MnCl2. Arrows indicate location of the pancreas.
The signal intensity from the pancreas was normalized to the signal intensity of the liver to account for variations in the delivery of Mn2+ to the pancreas that arise from factors such as cardiac output. Subsequently, the normalized TICs were mathematically fitted to a sigmoid function to allow for direct comparison of treatment groups (saline vs. glucose infusions) based on the sigmoid plateau parameter A (i.e., the plateau enhancement intensity) and the slope parameter b. TICs of the normalized pancreas signal demonstrated a statistically significant 51% signal plateau increase and a 101% increase in slope after glucose infusion in normal mice (Fig. 2), suggesting possible enhancement by Mn2+ influx through voltage-gated Ca2+ channels in islet β-cells.
Fig. 2.

Normalized time-signal intensity curves (TICs) for the pancreas after saline and glucose infusions in normal mice. Mn2+-enhanced MR signal in the pancreas (normalized to liver signal) after saline and glucose infusions is plotted vs. time after MnCl2 injection. Arrow denotes time of injection for saline/glucose, and MnCl2 was injected at time = 0 min. Data were fit to a sigmoid function, and 2-way ANOVA was performed on the parameters corresponding to sigmoid function plateau height and slope (see research design and methods). Data points represent means ± SE from 5 mice.
To test whether the relative increase in the pancreatic TIC after glucose infusion is secondary to β-cell Ca2+ channel activation, we treated age-matched C57BL/6J mice with a single dose of 180 mg/kg STZ (high-dose group) or with five daily doses of 50 mg/kg STZ (low-dose group) to destroy β-cells. We used two different doses of STZ because the mechanism, and possibly extent, of β-cell killing between the two doses are considerably different: high-dose STZ results primarily in rapid β-cell necrosis and development of diabetes within days, whereas low-dose STZ results in T cell-mediated β-cell dysfunction and the development of diabetes over several days to weeks (21). Figure 3A shows results of IPGTTs from untreated and low- and high-dose STZ-treated animals. Data indicate progressively worsening glucose tolerance in low-dose and high-dose STZ-treated animals compared with normal control animals, a trend that was statistically significant as assessed by AUC analysis (Fig. 3B). Insulin measurements during the IPGTT demonstrated that normal mice exhibited robust insulin release, whereas the high-dose STZ animals showed no detectable insulin levels and low-dose STZ animals showed intermediate insulin values (Fig. 3C). These data are consistent with the expectation that progressively higher doses of STZ lead to worsening glycemic control as a result of greater β-cell killing.
Fig. 3.

Intraperitoneal glucose tolerance tests (IPGTTs) after streptozotocin (STZ) injection. C57BL/6J mice were treated with high- or low-dose STZ and then subjected to IPGTTs, as detailed in research design and methods. A: blood glucose levels in normal and high- and low-dose STZ mice after intraperitoneal glucose injection at time = 0 min. B: results of area under the curve analysis of data in A. C: serum insulin levels at 0, 10, and 30 min after intraperitoneal glucose injection in the IPGTT in A. *Statistically different (P < 0.002) compared with normal animals; #statistically different (P < 0.002) compared with high-dose STZ animals. Data represent means ± SE of 4 animals per treatment group. ND, not detectable.
Figure 4A shows that mice treated with the high-dose STZ protocol had no significant Mn2+-specific MR enhancement in the pancreatic TIC after glucose infusion, consistent with the finding that β-cell function was dramatically reduced in these animals compared with normal animals. Figure 4B shows that mice treated with the low-dose STZ protocol had a detectable difference in the pancreatic TIC (20% plateau increase). Plateau heights of sigmoid fits to pancreatic TICs are shown in Fig. 5, revealing that the differences between saline and glucose infusions were statistically significantly different for the nondiabetic mice (P < 0.01) and the low-dose STZ-treated mice (P = 0.02). For the slope parameter b, a statistically significant difference was found between nondiabetic mice given glucose and any other group of mice (P = 0.001) by pairwise Tukey tests. These results are consistent with measurements of pancreatic insulin content in Table 1, with only 41 pmol insulin/mg pancreas in high-dose STZ animals and 72 pmol insulin/mg pancreas in low-dose STZ animals; these values contrasted sharply with the 942 pmol insulin/mg pancreas measured in nondiabetic mice.
Fig. 4.

Normalized TICs for the pancreas after saline and glucose infusions in STZ-diabetic mice. Mn2+-enhanced MR signal in the pancreas (normalized to liver signal) after saline and glucose infusions is plotted vs. time after MnCl2 injection. Arrows denote time of injection for saline/glucose, and MnCl2 was injected at time = 0 min. Data were fit to a sigmoid function, and 2-way ANOVA was performed on the parameters corresponding to sigmoid function plateau height and slope (see research design and methods). A: high-dose STZ mice. B: low-dose STZ mice. Data points represent means ± SE of 5 high-dose STZ mice and 4 low-dose STZ mice.
Fig. 5.

Plateau heights of normalized pancreatic TICs. Plateau heights for normalized pancreatic TICs are shown after glucose and saline infusions for untreated normal mice, mice given a high dose of STZ, and mice given a low dose of STZ. Two-way ANOVA revealed significant differences between saline and glucose responses in nondiabetic animals (P < 0.01) and between the nondiabetic glucose response and the glucose response in either diabetic group (P < 0.006). Pairwise Tukey tests showed that the glucose response in low-dose STZ mice was significantly different (P = 0.02) from the saline response in the same mice. No statistical difference was observable when comparing the glucose response between diabetic groups. Values are shown as means ± SE.
Table 1.
Body weight and pancreatic insulin content of study animals
| Mouse Group | Body Weight, g | Insulin Content, pmol/mg pancreas |
|---|---|---|
| Nondiabetic | 29.0±0.4 | 942±393 |
| High-dose STZ | 24.6±1.1 | 41±11 |
| Low-dose STZ | 26.0±1.9 | 72±5 |
Values are means ± SE. STZ, streptozotocin.
DISCUSSION
Traditional measures of β-cell function in diabetic animals and humans rely on metabolic testing that incorporates measurements of insulin secretion (see Ref. 15 for review). However, these studies require careful protocol adherence and sufficient blood volumes for hormone measurements and are at best indirect measurements of β-cell function and mass. Recently, the use of PET has provided promise for the direct assessment of functional β-cell mass in mice and humans (18, 19); however, this technology is limited by the need for sensitive PET scanning equipment and for appropriate radiotracer procurement. By contrast, MRI scanners are more common in clinical environments, and their contrast agents do not require generation of radiolabels. Here we present what we believe to be the first study using Mn2+-enhanced MRI to directly probe β-cell function in vivo. Studies of islets in vitro demonstrate a close correlation between the kinetics of glucose-stimulated intracellular Ca2+ mobilization and glucose-stimulated insulin secretion (8). Thus the capacity of the β-cell to mobilize intracellular divalent cations in response to glucose may be considered a reflection of β-cell functional capacity. In this regard, prior studies of Gimi et al. (6) demonstrated the feasibility of using Mn2+-enhanced imaging on isolated rat islets in vitro, showing that stimulating primary β-cells with glucose in the presence of Mn2+ causes an increase in signal-to-noise ratio relative to nonstimulated β-cells. Additionally, they reported that low doses of MnCl2 do not impair the physiological insulin secretory mechanism of β-cells in vitro, a necessary prerequisite if any longitudinal studies of Mn2+-enhanced MRI of β-cell function are to be attempted in vivo.
Strikingly, although β-cells constitute only 1–2% of the total pancreatic mass (9), we observed a 50% increase in the normalized pancreas signal after glucose stimulation in nondiabetic mice. An important factor explaining the high sensitivity of heavily T1-weighted MRI to Mn2+-enhanced β-cell activation may be water exchange between the extracellular space and the intracellular space. Specifically, we speculate that water is in intermediate exchange between these compartments relative to the T1s of the system. Thus intracellular Mn2+ likely decreases the T1 not only of intracellular water but also of extracellular water, and therefore a volume of water that is much larger than that contained within the β-cells contributes to the increased signal intensity. Another factor that improves sensitivity to relatively small decreases in T1 is the use of IR imaging with TI chosen to null the pancreas signal before the injection of MnCl2.
Imaging β-cell function in vivo presents difficulties not observed in in vitro imaging. First, it was necessary to select a ROI for imaging that could be identified by clear landmarks in order to maintain comparability across animals. The specific region of the pancreas that was imaged was the tail region, adjacent to the spleen, below the liver and underneath the stomach. The ROIs drawn in the pancreas had a mean area of 10.4 ± 3.0 mm2, which corresponds roughly to 30–40 islets. Interrogating a subset of islets is a limitation of this imaging technique, but this problem may be reduced in future studies by performing multislice imaging and covering a greater extent of the pancreas. In addition, we performed the IR imaging without cardiac and respiratory gating to ensure that repetition time and TI were held constant for all animals in order to maintain consistent image contrast for TIC quantification. As a consequence, some respiratory motion artifacts were noticeable during the time course of the experiment. Respiratory artifacts primarily occurred outside of the pancreas, although some were observed in the liver, but were minimized by using multiple averages during imaging. The use of pulse sequences with better motion compensation methods, such as spiral MRI (13), could be beneficial for future studies.
The TICs for saline studies in normal mice and diabetic mice were virtually identical, suggesting that STZ treatment did not significantly alter relative Mn2+ sequestration in liver and pancreas. Because the majority of β-cells in both groups of diabetic mice were destroyed as verified by serum insulin levels in an IPGTT and pancreatic insulin content measurements, we believe that these TICs represent the extravasation of Mn2+ ions into the pancreatic interstitial space. The loss of glucose-stimulated Mn2+ enhancement in STZ-treated animals strongly suggests that this enhancement is secondary to islet β-cell mass. We note that our findings presented here represent only a first step toward the use of Mn2+-enhanced MRI for estimation of β-cell function and mass. For example, it is unclear whether our technique provides the sensitivity necessary for assessing the increases in β-cell mass and function that might occur in diabetic individuals after therapy with β-cell-enhancing drugs (dipeptidyl-peptidase IV inhibitors or glucagon-like peptide 1 analogs) or after intrahepatic islet transplantation. Moreover, our technique as presented here is correlated only to β-cell function and not mass, per se; assessment of the latter may be important in conditions in which function is impaired before actual loss of β-cells (as in type 2 diabetes or early type 1 diabetes). Nonetheless, our study suggests a potential utility of Mn2+-enhanced MRI in both preclinical and clinical diabetes research. With regard to the former, Mn2+-enhanced MRI may be useful in monitoring β-cell function in mouse models of type 1 and type 2 diabetes, or in subcapsular renal islet transplant studies. Our studies addressed the sensitivity of this technique in assessing gradations in functional β-cell mass by treating mice with either high-dose or low-dose STZ. Significant differences in glucose response were observable, in agreement with pancreatic β-cell insulin content measurements. With regard to clinical applications, the availability of FDA-approved Mn2+-based MRI contrast agents such as Teslascan (GE Healthcare) leaves open the possibility of using Mn2+-enhanced MRI for directly assessing human β-cell function.
GRANTS
This work was supported in part by an Innovative Grant from the Juvenile Diabetes Research Foundation (to F. H. Epstein) and by gifts from Partnerships for Cures and the Meade Family (both to R. G. Mirmira).
Acknowledgments
We acknowledge the assistance of R. Wu in the University of Virginia Diabetes and Endocrine Research Center (National Institute of Diabetes and Digestive and Kidney Diseases DK-063609) and Dr. G. Vandenhoff in performing the insulin ELISAs.
The costs of publication of this article were defrayed in part by the payment of page charges. The article must therefore be hereby marked “advertisement” in accordance with 18 U.S.C. Section 1734 solely to indicate this fact.
REFERENCES
- 1.Amrani A, Durant S, Throsby M, Coulaud J, Dardenne M, Homo-Delarche F. Glucose homeostasis in the nonobese diabetic mouse at the prediabetic stage. Endocrinology 139: 1115–1124, 1998. [DOI] [PubMed] [Google Scholar]
- 2.Bell GI, Polonsky KS. Diabetes mellitus and genetically programmed defects in beta-cell function. Nature 414: 788–791, 2001. [DOI] [PubMed] [Google Scholar]
- 3.Evgenov NV, Medarova Z, Dai G, Bonner-Weir S, Moore A. In vivo imaging of islet transplantation. Nat Med 12: 144–148, 2006. [DOI] [PubMed] [Google Scholar]
- 4.Evgenov NV, Medarova Z, Pratt J, Pantazopoulos P, Leyting S, Bonner-Weir S, Moore A. In vivo imaging of immune rejection in transplanted pancreatic islets. Diabetes 55: 2419–2428, 2006. [DOI] [PubMed] [Google Scholar]
- 5.Fowler M, Virostko J, Chen Z, Poffenberger G, Radhika A, Brissova M, Shiota M, Nicholson WE, Shi Y, Hirshberg B, Harlan DM, Jansen ED, Powers AC. Assessment of pancreatic islet mass after islet transplantation using in vivo bioluminescence imaging. Transplantation 79: 768–776, 2005. [DOI] [PubMed] [Google Scholar]
- 6.Gimi B, Leoni L, Oberholzer J, Braun M, Avila J, Wang Y, Desai T, Philipson LH, Magin RL, Roman BB. Functional MR microimaging of pancreatic beta-cell activation. Cell Transplant 15: 195–203, 2006. [DOI] [PubMed] [Google Scholar]
- 7.Grimm J, Potthast A, Wunder A, Moore A. Magnetic resonance imaging of the pancreas and pancreatic tumors in a mouse orthotopic model of human cancer. Int J Cancer 106: 806–811, 2003. [DOI] [PubMed] [Google Scholar]
- 8.Henquin JC, Nenquin M, Stiernet P, Ahren B. In vivo and in vitro glucose-induced biphasic insulin secretion in the mouse: pattern and role of cytoplasmic Ca2+ and amplification signals in beta-cells. Diabetes 55: 441–451, 2006. [DOI] [PubMed] [Google Scholar]
- 9.Kim SK, Hebrok M. Intercellular signals regulating pancreas development and function. Genes Dev 15: 111–127, 2001. [DOI] [PubMed] [Google Scholar]
- 10.Koretsky AP, Silva AC. Manganese-enhanced magnetic resonance imaging (MEMRI). NMR Biomed 17: 527–531, 2004. [DOI] [PubMed] [Google Scholar]
- 11.Matschinsky FM, Magnuson MA, Zelent D, Jetton TL, Doliba N, Han Y, Taub R, Grimsby J. The network of glucokinase-expressing cells in glucose homeostasis and the potential of glucokinase activators for diabetes therapy. Diabetes 55: 1–12, 2006. [PubMed] [Google Scholar]
- 12.Medarova Z, Evgenov NV, Dai G, Bonner-Weir S, Moore A. In vivo multimodal imaging of transplanted pancreatic islets. Nat Protoc 1: 429–435, 2006. [DOI] [PubMed] [Google Scholar]
- 13.Meyer CH, Hu BS, Nishimura DG, Macovski A. Fast spiral coronary artery imaging. Magn Reson Med 28: 202–213, 1992. [DOI] [PubMed] [Google Scholar]
- 14.Prentki M, Nolan CJ. Islet beta cell failure in type 2 diabetes. J Clin Invest 116: 1802–1812, 2006. [DOI] [PMC free article] [PubMed] [Google Scholar]
- 15.Robertson RP Estimation of beta-cell mass by metabolic tests: necessary, but how sufficient? Diabetes 56: 2420–2424, 2007. [DOI] [PubMed] [Google Scholar]
- 16.Roth DJ, Jansen ED, Powers AC, Wang TG. A novel method of monitoring response to islet transplantation: bioluminescent imaging of an NF-kappaB transgenic mouse model. Transplantation 81: 1185–1190, 2006. [DOI] [PubMed] [Google Scholar]
- 17.Silva AC, Lee JH, Aoki I, Koretsky AP. Manganese-enhanced magnetic resonance imaging (MEMRI): methodological and practical considerations. NMR Biomed 17: 532–543, 2004. [DOI] [PubMed] [Google Scholar]
- 18.Simpson NR, Souza F, Witkowski P, Maffei A, Raffo A, Herron A, Kilbourn M, Jurewicz A, Herold K, Liu E, Hardy MA, Van Heertum R, Harris PE. Visualizing pancreatic beta-cell mass with [11C]DTBZ. Nucl Med Biol 33: 855–864, 2006. [DOI] [PMC free article] [PubMed] [Google Scholar]
- 19.Souza F, Simpson N, Raffo A, Saxena C, Maffei A, Hardy M, Kilbourn M, Goland R, Leibel R, Mann JJ, Van Heertum R, Harris PE. Longitudinal noninvasive PET-based beta cell mass estimates in a spontaneous diabetes rat model. J Clin Invest 116: 1506–1513, 2006. [DOI] [PMC free article] [PubMed] [Google Scholar]
- 20.Thorens B GLUT2 in pancreatic and extra-pancreatic gluco-detection. Mol Membr Biol 18: 265–273, 2001. [DOI] [PubMed] [Google Scholar]
- 21.Wang Z, Gleichmann H. GLUT2 in pancreatic islets: crucial target molecule in diabetes induced with multiple low doses of streptozotocin in mice. Diabetes 47: 50–56, 1998. [DOI] [PubMed] [Google Scholar]