Abstract
Plasma homocysteine (Hcy) is an independent risk factor for cardiovascular disease. Hcy is a nonprotein amino acid derivative that is generated from the methionine cycle, which provides the methyl group for essentially all biological methylation reactions. Although plasma Hcy levels are elevated in patients with cardiovascular disease, the mechanisms that regulate Hcy homeostasis remain poorly defined. In this study, we found that the expression of key enzymes involved in Hcy metabolism is induced in the liver in response to fasting. This induction coincides with increased expression of peroxisome proliferator-activated receptor-γ coactivator (PGC)-1α, a transcriptional coactivator that regulates hepatic gluconeogenesis and mitochondrial function. PGC-1α stimulates the expression of genes involved in Hcy metabolism in cultured primary hepatocytes as well as in the liver. Adenoviral-mediated expression of PGC-1α in vivo leads to elevated plasma Hcy levels. In contrast, mice deficient in PGC-1α have lower plasma Hcy concentrations. These results define a novel role for the PGC-1α coactivator pathway in the regulation of Hcy homeostasis and suggest a potential pathogenic mechanism that contributes to hyperhomocysteinemia.
Keywords: transcriptional coactivator, peroxisome proliferator-activated receptor-γ coactivator 1α, homocysteine, liver metabolism, cardiovascular disease
plasma homocysteine (Hcy) level is a strong and independent risk factor for cardiovascular disease and stroke (4, 27). Substantial epidemiological evidence suggests a potentially causal role of Hcy in coronary heart disease and stroke, likely through oxidative stress, endothelial damage, and thrombogenesis. Although plasma Hcy concentrations are consistently elevated in patients with cardiovascular disease, very little is known about the underlying mechanisms that lead to these pathogenic changes. Hcy is a nonprotein amino acid derivative of methionine that is generated from S-adenosylhomocysteine (AdoHcy), the product of S-adenosylmethionine (AdeMet)-dependent methylation reactions (19). Hydrolysis of AdoHcy by S-adenosylhomocysteine hydrolase (Ahcy) leads to Hcy, which can be remethylated to form methionine by methionine synthase (Mtr) or by betaine-Hcy methyltransferase (Bhmt). These enzymatic reactions collectively constitute the methionine cycle, which provides methyl groups for essentially all biological methylation reactions in the cell. Hcy can exit this cycle through the trans-sulfuration pathway, in which the committing step is catalyzed by cystathionine β-synthase (Cbs). Genetic mutations or polymorphisms of genes in this pathway have been found to influence plasma Hcy levels (9); however, the molecular pathways that regulate hepatic Hcy metabolism and plasma Hcy homeostasis remain poorly defined.
Peroxisome proliferator-activated receptor-γ coactivator (PGC)-1α is a transcriptional coactivator that regulates mitochondrial biogenesis, hepatic gluconeogenesis, fatty acid β-oxidation, as well as other biological processes, such as slow-twitch muscle fiber formation and circadian clock function (5, 14, 22). Mice deficient in PGC-1α fail to activate adaptive responses following various environmental and physiological stresses (12, 16). In particular, hepatic fasting response is impaired in PGC-1α null mice and in hepatocytes isolated from these mice, suggesting that this factor serves as a nodal point in the regulation of energy metabolism in the liver. In this study, we found that PGC-1α regulates the expression of key enzymes involved in Hcy metabolism and hypothesized that PGC-1α may modulate plasma Hcy levels through this transcriptional regulation. Our results demonstrate that PGC-1α is a novel regulator of the methionine cycle and implicate this factor as a potentially important modulator of plasma Hcy concentrations.
EXPERIMENTAL PROCEDURES
Adenoviral transduction of primary hepatocytes.
Primary hepatocytes were isolated following perfusion of whole liver first with perfusion buffer and then with collagenase solution. Hepatocyte culture and adenoviral transduction were performed as previously described (15). Transduced cells were incubated in the maintenance medium for a total of 40 h before mRNA isolation and protein lysate preparation. Immunoblotting analyses were performed using antibodies against BHMT (ab52144; Abcam), MAT1a (sc-28029; Santa Cruz Biotech), and AHCY (10757-2-AP; ProteinTech).
Gene expression analyses.
C57/BL6J male mice (8 wk old) were kept ad libitum, fasted for 20 h, or fasted for 20 h and then refed for 24 h before death. Livers were dissected and immediately frozen for RNA isolation and preparation of protein lysates. For tail vein injection of recombinant adenoviruses, ∼0.1–0.2 OD of purified viral particles was used for each mouse. Total liver RNA was isolated using Trizol reagents (Invitrogen, CA), reverse transcribed, and analyzed by quantitative PCR (qPCR), as previously described (17). All procedures involving animals have been approved by the University Committee on Use and Care of Animals at the University of Michigan.
Metabolite measurements.
Total plasma Hcy (tHcy) was determined by high-performance liquid chromatography (HPLC) with fluorescence detection (25). Briefly, the method consists of reduction of the sample with tri-n-butylphosphine, precipitation of proteins with perchloric acid, and derivitization with 7-fluorobenzo-2-oxa-1,3-diazole-4-sulfonate (SBDF). The Hcy-SBDF derivative was separated on a reverse-phase C18 column (Synergy Hydro150 × 3 mm; Phenomenex, Torrence, CA) by isocratic elution and detected by fluorescence (excitation 390 nm and emission 515 nm). N-acetylcysteine and Hcy were included as the internal calibrator and external calibration standards, respectively.
Hepatic AdoMet and AdoHcy concentrations were determined by HPLC coupled to ultraviolet (UV) detection as previously described (2). Separation of AdoMet and AdoHcy was performed on a Gemini C18 column (150 × 3 mm, 3 μm particle size; Phenomenex) at a flow rate of 0.3 ml/min. UV detection was at 260 nm using a Linear model 305 UV detector (ESA, Chelmsford, MA). Cysteine and glutathione concentrations were determined in liver samples as described previously (26). Methionine concentrations were measured in liver samples by HPLC analysis of the o-phthaldialdehyde derivatives (3).
RESULTS AND DISCUSSION
Nutritional regulation of the methionine cycle in the liver.
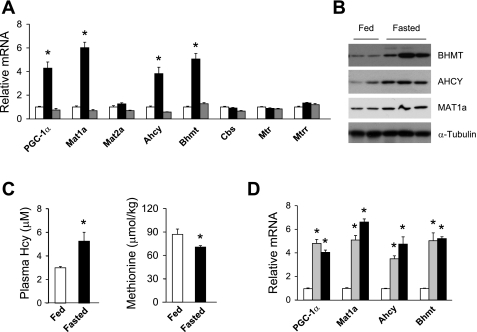
The liver is a major site of methionine metabolism that provides AdoMet for the biosynthesis of phospholipids, creatine, and polyamines as well as other methylation reactions (8, 20). Consistent with its prominent role in Hcy homeostasis, several genes involved in Hcy production and remethylation are abundantly expressed in the liver, including Mat1a, Ahcy, Bhmt, Mtr, and methionine synthase reductase (Mtrr). To determine whether hepatic methionine metabolism is regulated by nutritional status, we analyzed gene expression in mouse livers using qPCR. As expected, PGC-1α mRNA expression is increased by approximately fourfold in the liver after overnight fasting (29), and it returns to the fed levels following refeeding (Fig. 1A). The mRNA levels of Mat1a, Ahcy, and Bhmt are also significantly elevated in response to starvation. In contrast, the expression of Mat2a, Cbs, Mtr, and Mtrr remains unchanged under these conditions. Consistent with mRNA induction, immunoblotting studies indicate that BHMT, AHCY, and MAT1a protein levels in the liver are also increased in the fasted state (Fig. 1B). As expected, the concentration of methionine is lower in the liver in response to fasting (Fig. 1C). On the contrary, plasma total Hcy level is significantly increased by starvation. We have previously demonstrated that PGC-1α expression is induced in neonatal livers along with target genes involved in gluconeogenesis and fatty acid β-oxidation (15). Similar to the induction in response to fasting, mRNA expression of Mat1a, Ahcy, and Bhmt is robustly increased in the neonatal liver (Fig. 1D). These results suggest that PGC-1α may play a role in the transcriptional activation of genes involved in Hcy metabolism by fasting and in the neonatal liver. The activation of the methionine cycle during starvation may serve as a mechanism to preserve the AdoMet pool for methylation reactions and to conserve methionine during nutrient deprivation.
Fig. 1.
Nutritional regulation of genes involved in hepatic homocysteine (Hcy) metabolism. A: quantitative PCR (qPCR) analysis of gene expression in the liver. Total RNA from the livers of fed (open bars), fasted (black bars), and fasted/refed (gray bars) mice was analyzed (n = 4). B: immunoblots of total liver lysates from mice under fed conditions and following overnight fasting. C: concentrations of plasma total Hcy (tHcy) and hepatic methionine in fed (open bars) and fasted (filled bars) mice. Data in A and C represent means ± SE. *P < 0.001, fed vs. fasted. D: qPCR analysis of gene expression. Pooled livers from day 19 embryos (E19, open bars), postnatal day 1 (gray bars), and day 3 (black bars) pups were analyzed. Data represent means ± SD. *P < 0.001, days 1 and 3 vs. E19 Ahcy, S-adenosylhomocysteine hydrolase; Bhmt, betaine-Hcy methyltransferase; Cbs, cystathionine β-synthase; Mtr, remethylated to form methionine by methionine synthase; Mtrr, methionine synthase reductase.
Regulation of Hcy metabolism by PGC-1α.
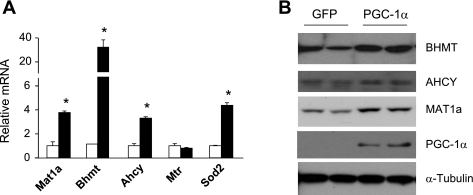
To examine whether PGC-1α regulates the expression of genes involved in Hcy metabolism, we transduced primary hepatocytes with green fluorescent protein (GFP) or PGC-1α adenoviruses and performed qPCR analyses. Adenoviral-mediated expression of PGC-1α in hepatocytes leads to a significant increase in the mRNA levels of Mat1a, Bhmt, and Ahcy, but not Mtr and Mtrr (Fig. 2A and data not shown). The induction of BHMT, AHCY, and MAT1a proteins was also observed in hepatocytes transduced with PGC-1α adenovirus (Fig. 2B). PGC-1α has been demonstrated to stimulate the expression of genes involved in hepatic gluconeogenesis (29), fatty acid oxidation (11), and heme biosynthesis (6). Together, our results illustrate that PGC-1α regulates a broader set of hepatic genes that contribute to the starvation response in the liver.
Fig. 2.
Regulation of genes involved in hepatic Hcy metabolism by peroxisome proliferator-activated receptor-γ coactivator (PGC)-1α. A: qPCR analysis of gene expression in hepatocytes transduced with green fluorescent protein (GFP; open bars) or PGC-1α (filled bars) adenoviruses. Data represent means ± SD. *P < 0.001, GFP vs. PGC-1α. B: immunoblots of total lysates from hepatocytes transduced with GFP or PGC-1α adenoviruses.
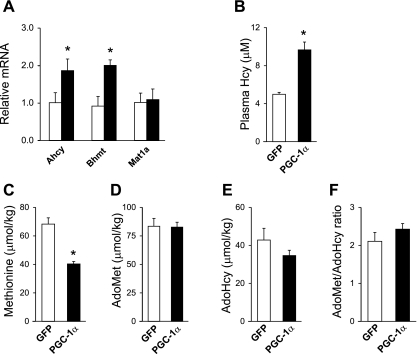
The stimulation of genes in the methionine cycle by PGC-1α raises the possibility that it may enhance the metabolic flux through this pathway. Because the liver secretes Hcy and is a major source of Hcy in circulation (8, 20, 24), we next examined the effects of PGC-1α on plasma tHcy levels. We transduced mice with control GFP or PGC-1α adenoviruses through tail vein injection. Adenoviral-mediated PGC-1α expression induces the expression of Ahcy and Bhmt, but not Mat1a, in transduced livers (Fig. 3A ). The lack of Mat1a induction may be because of the presence of negative regulatory mechanisms in vivo. Alternatively, proper posttranslational modification of PGC-1α, such as deacetylation (23), may be necessary for its function in the context of Mat1a gene expression. Measurements of plasma metabolites indicate that PGC-1α significantly increases total plasma Hcy levels (Fig. 3B). Whereas AdoMet and AdoHcy levels remain similar in transduced livers, hepatic methionine concentrations are decreased by ∼41% in response to PGC-1α (Fig. 3, C–E). In contrast, PGC-1α appears to have modest effects on the AdoMet-to-AdoHcy ratio, which reflects intracellular methylation charge, as well as the concentrations of cysteine, the product of the trans-sulfuration pathway, and glutathione in the liver (Fig. 3F and data not shown). These results demonstrate that PGC-1α activation in the liver elevates plasma Hcy levels through its regulation of genes involved in methionine metabolism.
Fig. 3.
Effects of PGC-1α on plasma tHcy levels and the methionine cycle. A: qPCR analysis of gene expression in livers transduced with GFP (open bars) or PGC-1α (filled bars) adenoviruses. Data represent means ± SD. *P < 0.001, GFP vs. PGC-1α. B: plasma total Hcy levels in mice transduced with GFP (open bras) or PGC-1α (filled bars) adenoviruses. C–F: concentrations of methionine (C), S-adenosylmethionine (AdoMet, D), S-adenosylhomocysteine (AdoHcy, E), and the AdoMet-to-AdoHcy ratio (F) in transduced mouse livers. Data in C-F represent means ± SE. *P < 0.001, GFP vs. PGC-1α.
The increase of plasma tHcy levels in the presence of elevated Bhmt gene expression during fasting and in response to PGC-1α is somewhat paradoxical. Interestingly, adenoviral-mediated expression of PGC-1α decreases CBS activity in the liver (data not shown), which may reduce Hcy catabolism and contribute to higher plasma tHcy levels. Because BHMT requires betaine for the remethylation reaction, it is also possible that this cofactor is limiting in the liver. As a result, Hcy accumulates when there is a relative deficiency of betaine during fasting. Alternatively, BHMT induction may reflect an overall attempt to augment the methionine cycle, in particular in response to sulfur amino acid starvation. As such, plasma tHcy levels may be elevated because of enhanced metabolite flux through this pathway. PGC-1α expression in the liver is elevated in the rodent models of diabetes (29). However, previous studies in streptozotocin (STZ)-treated (type 1 diabetes) and Zucker diabetic fatty (type 2 diabetes) rats have demonstrated that plasma tHcy levels are reduced in the diabetic states (7, 28). Consistent with these observations, we found that plasma tHcy levels are lower in STZ-treated and high-fat-fed mice [Fig. S1 (Supplemental data for this article may be found at the American Journal of Physiology: Endocrinology and Metabolism web site.)]. Although mRNA levels of Mat1a, Ahcy, and BHMT are elevated in STZ-treated mouse livers, hepatic expression of CBS and cystathionase, key enzymes of the trans-sulfuration pathway, is also significantly increased in the diabetic state (data not shown). The induction of the trans-sulfuration pathway likely contributes to lower plasma tHcy levels in STZ-treated mice. Because PGC-1α does not increase the expression of these two genes in vivo, their induction in the diabetic state is potentially the result of additional perturbations of hepatic metabolism when insulin is deficient. These results suggest that the rodent models of diabetes are not appropriate models for hyperhomocysteinemia in humans. In fact, hyperhomocysteinemia and diabetes are independent risk factors for cardiovascular disease in humans, potentially as a result of distinct pathogenic mechanisms and downstream target tissues.
PGC-1α deficiency and plasma Hcy homeostasis.
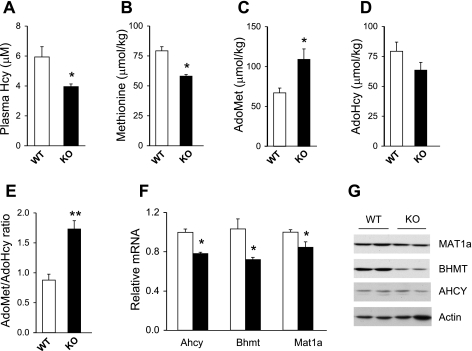
We have previously demonstrated that mice deficient in PGC-1α have impaired mitochondrial function in multiple tissues and are defective in adaptive response following metabolic stresses (16). To determine whether PGC-1α is required for Hcy homeostasis, we measured plasma total Hcy concentrations in wild-type control and PGC-1α null mice. Plasma tHcy concentration is significantly lower (34%) in mice lacking PGC- 1α (Fig. 4A). Methionine concentration in the liver is also reduced in PGC-1α null mice (Fig. 4B), suggesting that PGC-1α deficiency may reduce the pool of metabolites in the methionine cycle. Although the concentrations of AdoHcy in wild-type and PGC-1α null livers are similar, AdoMet levels are ∼62% higher when PGC-1α is absent (Fig. 4, C and D). Compared with wild-type controls, the AdoMet-to-AdoHcy ratio is significantly increased in PGC-1α null livers (Fig. 4E), suggesting that PGC-1α-deficient mice are capable of maintaining methylation charge despite the reduced pool of methionine and Hcy. The mRNA levels of Mat1a, Ahcy, and Bhmt are also significantly decreased in PGC-1α null livers (Fig. 4F). MAT1a and BHMT protein levels are lower in PGC-1α-deficient livers (Fig. 4G). Unexpectedly, AHCY protein levels remain similar in both groups, suggesting that additional mechanisms may regulate AHCY protein expression.
Fig. 4.
Effects of PGC-1α deficiency on plasma tHcy levels and the methionine cycle. A: concentrations of plasma tHcy in wild-type (WT; open bars) and PGC-1α null (KO; filled bars) mice. B–E: concentrations of methionine (B), AdoMet (C), AdoHcy (D), and the AdoMet-to-AdoHcy ratio (E) in-wild type and PGC-1α null mouse livers. Data in A–E represent means ± SE. *P < 0.03 and **P < 0.001, wild type vs. null. F: qPCR analysis of gene expression in pooled RNA from wild-type (open bars) and PGC-1α null (filled bars) mouse livers. Data in F represent means ± SD. *P < 0.03, wild type vs. null. G: immunoblots of total liver lysates from wild-type and PGC-1α null mice.
Because PGC-1α null mice have metabolic defects in multiple tissues, we also examined whether PGC-1α is required for the expression of genes involved in Hcy metabolism in a cell-autonomous manner. Adenoviral-mediated RNAi knockdown of PGC-1α has been shown to effectively suppress PGC-1α protein expression and function in the liver (10). We therefore investigated the nutritional regulation of Mat1a, Ahcy, and Bhmt in mice transduced with recombinant adenoviruses expressing control short-hairpin RNA (shRNA) or shRNA directed toward PGC-1α. While the expression of Mat1a, Ahcy, and Bhmt is increased following overnight fasting in the control livers, their expression levels are significantly lower in the knockdown livers under both fed and fasted conditions (Fig. 5). These results indicate that PGC-1α is necessary for the normal expression of genes involved in hepatic methionine and Hcy metabolism under both feeding conditions.
Fig. 5.
Effects of in vivo RNAi knockdown of PGC-1α on hepatic gene expression. Mice were transduced with control [scramble (Scrb)] or PGC-1α RNAi (RNAi) adenoviruses and kept ad libitum (open bars) or fasted for 20 h (filled bars). Pooled liver RNA was used for qPCR analysis. Data represent means ± SD. *P < 0.03, Scrb vs. RNAi.
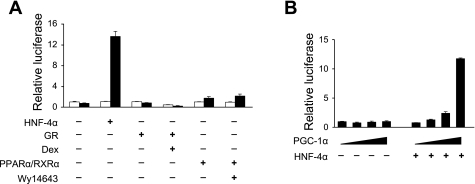
PGC-1α regulates hepatic metabolism through its coactivation of several transcription factors, including peroxisome proliferator-activated receptor (PPAR) α, hepatic nuclear factor (HNF)-4α, Forkhead transcription factor (FOX) O1, and glucocorticoid receptor (GR) (14). Among these, PPARα participates in the induction of genes involved in fatty acid β-oxidation, whereas HNF4α, FOXO1, and GR mediate its stimulation of gluconeogenic genes by PGC-1α during starvation. To examine whether these transcription factors serve as a coactivation target for PGC-1α in the induction of Bhmt gene expression, we constructed a luciferase reporter plasmid containing 1.5 kb of upstream Bhmt promoter. Transient transfection experiments in McA-RH7777 rat hepatoma cells indicate that PGC-1α has modest effects on PPARα and GR on the Bhmt reporter (Fig. 6A). In contrast, PGC-1α strongly activates Bhmt promoter activity when HNF4α is included in the transfection assays. Moreover, PGC-1α coactivates HNF4α on the Bhmt promoter in a dose-dependent manner (Fig. 6B). These results suggest that HNF4α may serve as a key factor that mediates the effects of PGC-1α on the methionine cycle. Interestingly, previous studies have demonstrated that Bhmt expression is induced by glucocorticoids in H4IIE hepatoma cells (21). It is possible that GR-responsive elements may reside in regulatory regions beyond the promoter construct in this study. The transcription factors that mediate the induction of Mat1a and Ahcy by PGC-1α remain unknown. However, it is possible that a distinct set of transcription factors may be involved. Recent genome-wide coactivation studies have revealed a comprehensive list of transcriptional partners for PGC-1α (13). The role of these novel transcription factors and cofactors in the regulation of hepatic Hcy metabolism warrants additional future studies.
Fig. 6.
Coactivation of HNF4α by PGC-1α on the Bhmt promoter. A: relative luciferase activity in McA-RH7777 hepatoma cells transiently transfected with vector, HNF4α, GR, or peroxisome proliferator-activated receptor (PPAR) α/retinoid X receptor (RXR) α in the absence (open bars) or presence (filled bars) of PGC-1α. B: relative luciferase activity in cells transfected with different amounts of PGC-1α without or with HNF4α, as indicated. Data represent means ± SD of representative experiments.
Elevated plasma Hcy levels are a risk factor for cardiovascular diseases independent of other risk factors. The pathogenic mechanisms that lead to elevated Hcy concentrations remain obscure. Although folic acid and vitamins B6 and B12 are able to lower plasma Hcy concentrations, recent interventional clinical trials indicate that this dietary supplement approach is insufficient for reducing the risk of major cardiovascular events in patients (1, 18). A plausible explanation for the apparent lack of clinical benefits has been suggested to be the deleterious effects of these vitamins, when administered at high doses, on vascular function and plaque formation. Despite this, alternative approaches to lowering plasma Hcy are limited because of the poor understanding of the regulatory pathways that impinge on Hcy homeostasis. In this study, we have identified the transcriptional coactivator PGC-1α as a novel regulator of hepatic Hcy metabolism. Adenoviral-mediated expression of PGC-1α in the liver elevates, while PGC-1α deficiency lowers, plasma Hcy levels in mice. At the molecular level, PGC-1α stimulates the expression of key genes involved in the synthesis and remethylation of Hcy. Because elevated PGC-1α expression has been implicated in increased hepatic glucose output in the insulin-resistant states (29), it has been proposed that suppression of hepatic PGC-1α may be beneficial for the treatment of hyperglycemia. Our studies suggest that this strategy may also reduce plasma Hcy levels and potentially serve as an alternative to vitamins B6 and B12 for the treatment of hyperhomocysteinemia.
GRANTS
This work was supported by National Institute of Diabetes and Digestive and Kidney Diseases Grants DK-077086 (to J. D. Lin) and DK-065959 (to R. Banerjee), the American Diabetes Association, and the Juvenile Diabetes Research Foundation (J. D. Lin).
Supplementary Material
Acknowledgments
We thank S. Gu and A. Baker for technical assistance and Drs. C. L. Elmore and R. G. Matthews for suggestions.
The costs of publication of this article were defrayed in part by the payment of page charges. The article must therefore be hereby marked “advertisement” in accordance with 18 U.S.C. Section 1734 solely to indicate this fact.
REFERENCES
- 1.Bonaa KH, Njolstad I, Ueland PM, Schirmer H, Tverdal A, Steigen T, Wang H, Nordrehaug JE, Arnesen E, Rasmussen K. Homocysteine lowering and cardiovascular events after acute myocardial infarction. N Engl J Med 354: 1578–1588, 2006. [DOI] [PubMed] [Google Scholar]
- 2.Bottiglieri T Isocratic high performance liquid chromatographic analysis of S-adenosylmethionine and S-adenosylhomocysteine in animal tissues: the effect of exposure to nitrous oxide. Biomed Chromatogr 4: 239–241, 1990. [DOI] [PubMed] [Google Scholar]
- 3.Canevari L, Vieira R, Aldegunde M, Dagani F. High-performance liquid chromatographic separation with electrochemical detection of amino acids focusing on neurochemical application. Anal Biochem 205: 137–142, 1992. [DOI] [PubMed] [Google Scholar]
- 4.Eikelboom JW, Lonn E, Genest J Jr, Hankey G, Yusuf S. Homocyst(e)ine and cardiovascular disease: a critical review of the epidemiologic evidence. Ann Intern Med 131: 363–375, 1999. [DOI] [PubMed] [Google Scholar]
- 5.Finck BN, Kelly DP. PGC-1 coactivators: inducible regulators of energy metabolism in health and disease. J Clin Invest 116: 615–622, 2006. [DOI] [PMC free article] [PubMed] [Google Scholar]
- 6.Handschin C, Lin J, Rhee J, Peyer AK, Chin S, Wu PH, Meyer UA, Spiegelman BM. Nutritional regulation of hepatic heme biosynthesis and porphyria through PGC-1alpha. Cell 122: 505–515, 2005. [DOI] [PubMed] [Google Scholar]
- 7.Jacobs RL, House JD, Brosnan ME, Brosnan JT. Effects of streptozotocin-induced diabetes and of insulin treatment on homocysteine metabolism in the rat. Diabetes 47: 1967–1970, 1998. [DOI] [PubMed] [Google Scholar]
- 8.Jacobs RL, Stead LM, Devlin C, Tabas I, Brosnan ME, Brosnan JT, Vance DE. Physiological regulation of phospholipid methylation alters plasma homocysteine in mice. J Biol Chem 280: 28299–28305, 2005. [DOI] [PubMed] [Google Scholar]
- 9.Klerk M, Verhoef P, Clarke R, Blom HJ, Kok FJ, Schouten EG. MTHFR 677C–>T polymorphism and risk of coronary heart disease: a meta-analysis. J Am Med Assoc 288: 2023–2031, 2002. [DOI] [PubMed] [Google Scholar]
- 10.Koo SH, Satoh H, Herzig S, Lee CH, Hedrick S, Kulkarni R, Evans RM, Olefsky J, Montminy M. PGC-1 promotes insulin resistance in liver through PPAR-alpha-dependent induction of TRB-3. Nat Med 10: 530–534, 2004. [DOI] [PubMed] [Google Scholar]
- 11.Lehman JJ, Barger PM, Kovacs A, Saffitz JE, Medeiros DM, Kelly DP. Peroxisome proliferator-activated receptor gamma coactivator-1 promotes cardiac mitochondrial biogenesis. J Clin Invest 106: 847–856, 2000. [DOI] [PMC free article] [PubMed] [Google Scholar]
- 12.Leone TC, Lehman JJ, Finck BN, Schaeffer PJ, Wende AR, Boudina S, Courtois M, Wozniak DF, Sambandam N, Bernal-Mizrachi C, Chen Z, Holloszy JO, Medeiros DM, Schmidt RE, Saffitz JE, Abel ED, Semenkovich CF, Kelly DP. PGC-1alpha deficiency causes multi-system energy metabolic derangements: muscle dysfunction, abnormal weight control and hepatic steatosis (Abstract). PLoS Biol 3: e101, 2005. [DOI] [PMC free article] [PubMed] [Google Scholar]
- 13.Li S, Liu C, Li N, Hao T, Han T, Hill DE, Vidal M, Lin JD. Genome-wide coactivation analysis of PGC-1alpha identifies BAF60a as a regulator of hepatic lipid metabolism. Cell Metab 8: 105–117, 2008. [DOI] [PMC free article] [PubMed] [Google Scholar]
- 14.Lin J, Handschin C, Spiegelman BM. Metabolic control through the PGC-1 family of transcription coactivators. Cell Metab 1: 361–370, 2005. [DOI] [PubMed] [Google Scholar]
- 15.Lin J, Tarr PT, Yang R, Rhee J, Puigserver P, Newgard CB, Spiegelman BM. PGC-1beta in the regulation of hepatic glucose and energy metabolism. J Biol Chem 278: 30843–30848, 2003. [DOI] [PubMed] [Google Scholar]
- 16.Lin J, Wu PH, Tarr PT, Lindenberg KS, St-Pierre J, Zhang CY, Mootha VK, Jager S, Vianna CR, Reznick RM, Cui L, Manieri M, Donovan MX, Wu Z, Cooper MP, Fan MC, Rohas LM, Zavacki AM, Cinti S, Shulman GI, Lowell BB, Krainc D, Spiegelman BM. Defects in adaptive energy metabolism with CNS-linked hyperactivity in PGC-1alpha null mice. Cell 119: 121–135, 2004. [DOI] [PubMed] [Google Scholar]
- 17.Liu C, Li S, Liu T, Borjigin J, Lin JD. Transcriptional coactivator PGC-1alpha integrates the mammalian clock and energy metabolism. Nature 447: 477–481, 2007. [DOI] [PubMed] [Google Scholar]
- 18.Lonn E, Yusuf S, Arnold MJ, Sheridan P, Pogue J, Micks M, McQueen MJ, Probstfield J, Fodor G, Held C, Genest J Jr. Homocysteine lowering with folic acid and B vitamins in vascular disease. N Engl J Med 354: 1567–1577, 2006. [DOI] [PubMed] [Google Scholar]
- 19.Mato JM, Martinez-Chantar ML, Lu SC. Methionine metabolism and liver disease. Annu Rev Nutr 28: 273–293, 2008. [DOI] [PubMed] [Google Scholar]
- 20.Mudd SH, Brosnan JT, Brosnan ME, Jacobs RL, Stabler SP, Allen RH, Vance DE, Wagner C. Methyl balance and transmethylation fluxes in humans. Am J Clin Nutr 85: 19–25, 2007. [DOI] [PubMed] [Google Scholar]
- 21.Ratnam S, Wijekoon EP, Hall B, Garrow TA, Brosnan ME, Brosnan JT. Effects of diabetes and insulin on betaine-homocysteine S-methyltransferase expression in rat liver. Am J Physiol Endocrinol Metab 290: E933–E939, 2006. [DOI] [PubMed] [Google Scholar]
- 22.Rodgers JT, Lerin C, Gerhart-Hines Z, Puigserver P. Metabolic adaptations through the PGC-1 alpha and SIRT1 pathways. FEBS Lett 582: 46–53, 2008. [DOI] [PMC free article] [PubMed] [Google Scholar]
- 23.Rodgers JT, Lerin C, Haas W, Gygi SP, Spiegelman BM, Puigserver P. Nutrient control of glucose homeostasis through a complex of PGC-1alpha and SIRT1. Nature 434: 113–118, 2005. [DOI] [PubMed] [Google Scholar]
- 24.Stead LM, Brosnan ME, Brosnan JT. Characterization of homocysteine metabolism in the rat liver. Biochem J 350: 685–692, 2000. [PMC free article] [PubMed] [Google Scholar]
- 25.Ubbink JB, Hayward Vermaak WJ, Bissbort S. Rapid high-performance liquid chromatographic assay for total homocysteine levels in human serum. J Chromatogr 565: 441–446, 1991. [DOI] [PubMed] [Google Scholar]
- 26.Vitvitsky V, Dayal S, Stabler S, Zhou Y, Wang H, Lentz SR, Banerjee R. Perturbations in homocysteine-linked redox homeostasis in a murine model for hyperhomocysteinemia. Am J Physiol Regul Integr Comp Physiol 287: R39–R46, 2004. [DOI] [PubMed] [Google Scholar]
- 27.Wald DS, Law M, Morris JK. Homocysteine and cardiovascular disease: evidence on causality from a meta-analysis (Abstract). Br Med J 325: 1202, 2002. [DOI] [PMC free article] [PubMed] [Google Scholar]
- 28.Wijekoon EP, Hall B, Ratnam S, Brosnan ME, Zeisel SH, Brosnan JT. Homocysteine metabolism in ZDF (type 2) diabetic rats. Diabetes 54: 3245–3251, 2005. [DOI] [PMC free article] [PubMed] [Google Scholar]
- 29.Yoon JC, Puigserver P, Chen G, Donovan J, Wu Z, Rhee J, Adelmant G, Stafford J, Kahn CR, Granner DK, Newgard CB, Spiegelman BM. Control of hepatic gluconeogenesis through the transcriptional coactivator PGC-1. Nature 413: 131–138, 2001. [DOI] [PubMed] [Google Scholar]
Associated Data
This section collects any data citations, data availability statements, or supplementary materials included in this article.


