Abstract
Ammonia metabolism and transport are critical for acid-base homeostasis. The ammonia transporter family member Rh C glycoprotein (Rhcg) is expressed in distal renal tubular segments, and its expression is regulated in parallel with renal ammonia metabolism. However, there are inconsistencies in its reported subcellular distribution, with both apical and basolateral Rhcg reported in rat and human kidney and only apical expression in mouse kidney. Because the membrane location of Rhcg is critical for understanding its physiological role, we reassessed mouse Rhcg localization using refined immunolocalization methods. Two antibodies directed against different Rhcg-specific epitopes identified both apical and basolateral Rhcg immunolabel in mouse kidney. Immunogold electron microscopy both confirmed basolateral plasma membrane Rhcg expression and showed that apical immunolabel represented expression in both the apical plasma membrane and in subapical cytoplasmic vesicles. Immunoblots and Northern blots identified similar bands in Balb/c and C57BL/6 kidneys, suggesting basolateral Rhcg may result from alternative trafficking. Basolateral Rhcg intensity was strain dependent, with less basolateral Rhcg expression in the Balb/c mouse compared with the C57BL/6 mouse. In mice with collecting duct-specific Rhcg gene deletion, generated using Cre-loxP techniques, neither apical nor basolateral Rhcg immunolabel was identified in the collecting duct, confirming that basolateral Rhcg was the product of the same gene product as apical Rhcg. Although basolateral Rhcg expression differed between C57BL/6 and Balb/c mice, Rh B glycoprotein, which is exclusively basolateral, was expressed at similar levels in the two strains. We conclude that Rhcg is present in both the apical and basolateral plasma membrane in the mouse kidney, where it is likely to contribute to renal ammonia metabolism.
Keywords: intercalated cell, principal cell, cortical collecting duct
ammonia1 metabolism is critical for normal renal physiology. Ammonia is the largest component of net acid excretion under basal conditions, and changes in ammonia metabolism account for the largest changes in net acid excretion in most acid-base disturbances (23–25, 29). Renal ammonia handling involves intrarenal ammonia production and transepithelial transport in multiple segments that results in highly regulated renal ammonia metabolism. Although in the past ammonia was believed to move across epithelia entirely by passive diffusion, an increasing number of studies demonstrate that specific proteins contribute to renal ammonia transport (reviewed in Refs. 4, 35, and 41).
The most recent addition to our understanding of the molecular mechanisms of ammonia metabolism is the identification of the ammonia transporter family of proteins (13, 41). Rh A glycoprotein (Rhag) is an erythroid-specific Rh glycoprotein (16) that mediates net NH3 transport (20, 28, 44, 45). Rh B glycoprotein (Rhbg) and Rh C glycoprotein (Rhcg) are nonerythroid Rh glycoproteins expressed in the kidney (5, 8, 18, 27, 30, 34), as well as in a wide variety of extrarenal tissues in which ammonia transport is important (12, 17, 18, 40, 42). In the kidney, both Rhbg and Rhcg are expressed in the renal distal convoluted tubule, connecting segment, and collecting duct, the sites where ∼80% of urinary ammonia is secreted (5, 8, 27, 30, 43). In conditions of increased single-nephron ammonia metabolism, such as metabolic acidosis and reduced renal mass, Rhcg expression increases, suggesting that Rhcg mediates an important role in renal ammonia transport (14, 30, 31).
An important issue regarding the physiological role of Rhcg is that recent studies have yielded conflicting findings regarding the membrane location of Rhcg. Both the rat and the human kidney express both apical and basolateral Rhcg immunolabel (8, 9, 14, 30, 31), although one report identified only apical immunolabeling in the rat kidney (5). Basolateral Rhcg expression increases in parallel with urinary ammonia excretion in both metabolic acidosis and reduced renal mass, suggesting that changes in basolateral Rhcg expression may contribute to renal ammonia metabolism (14, 31). In contrast to the majority of reports in the rat kidney and the only report in the human kidney, initial studies of the mouse kidney identified only apical Rhcg immunoreactivity (34). Because of these apparent species-dependent differences and because the mouse is frequently used as a model system for genetic knockout studies, determining whether mouse Rhcg expression is the same or different as in the human and rat is important.
In the current study, we reexamined Rhcg expression in the mouse kidney, using two separate antibodies to Rhcg, the Balb/c strain used in our original report and three other mouse strains, including two inbred strains, C57BL/6 and C3H, and one outbred strain, Black Swiss 129. We used light microscopic, immunohistochemical, and immunogold electron microscopic techniques to demonstrate basolateral Rhcg expression in the kidney of multiple mouse strains. Specificity of the immunolabel is demonstrated by showing an absence of both apical and basolateral immunolabel in mice with collecting duct-specific Rhcg deletion. Finally, we tested whether the C57BL/6 mouse kidney, which expresses high levels of basolateral Rhcg, exhibits either alternative molecular weight Rhcg proteins or alternative Rhcg transcripts compared with the Balb/c mouse kidney, which exhibits very little basolateral Rhcg.
METHODS
Mice.
Normal Balb/c and C57BL/6 mice were obtained from Harlan Sprague Dawley (Indianapolis, IN) and were maintained on a normal mouse diet and ad libitum water intake until the day of the study. C3H mice were obtained from The Jackson Laboratory (Bar Harbor, ME). Tissues from Black Swiss 129 mice were prepared for a previous study using the same methods described below (46). All animal use protocols were approved by the Institutional Animal Care and Use Committee and in accordance with the animal use guidelines of the American Physiological Society.
Antibodies.
Two different polyclonal antibodies to Rhcg were used in these studies. Antibody A was an affinity-purified rabbit antibody prepared in our laboratory against residues 441-455 and characterized previously (34). Antibody B was rabbit antisera directed against residues 481-498 of mouse Rhcg that also has been used in previous studies (3). Antibodies to aquaporin-2 (AQP2; AB3274) were obtained from Chemicon (Temecula, CA). Rabbit anti-thiazide-sensitive transporter (TSC) antibodies were previously characterized (26) and were supplied by Dr. Stephen Hebert.
Tissue preparation for immunolocalization.
Mice were anesthetized with pentobarbital sodium (10–30 mg/kg ip) or inhalant isoflurane. The kidneys were preserved by in vivo cardiac perfusion with PBS (pH 7.4) followed by periodate-lysine-2% paraformaldehyde (PLP) (30) and then cut transversely into several 2- to 4-mm-thick slices and immersed 24–48 h at 4°C in the same fixative. For light microscopy, samples of the kidney from each animal were embedded in polyester wax (polyethylene glycol 400 distearate, Polysciences, Warrington, PA), and 2- or 3-μm-thick sections were cut and mounted on gelatin-coated glass slides. For electron microscopy, ∼1-mm3 samples were embedded in Lowicryl K4M (Electron Microscopy Sciences, Ft. Washington, PA) and polymerized under UV light. Toluidine-blue stained 0.5-μm sections were previewed by light microscopy, and ultrathin sections of samples containing well-preserved collecting ducts were mounted on Formvar-carbon-coated nickel grids.
Immunohistochemistry.
Immunolocalization of Rhcg was accomplished using immunoperoxidase procedures. The sections were dewaxed in ethanol, rehydrated, and then rinsed in PBS. Tissues were then treated with Trilogy Reagent (Cell Marque, Hot Springs, AR) for 60 min at 96°C. Endogenous peroxidase activity was blocked by incubating the sections in 3% H2O2 for 30 min. The sections were blocked for 30 min with 10% normal goat serum (Vector Laboratories, Burlingame, CA) in PBS, followed by Mouse Detective (Biocare Medical, Concord, CA) for 45 min, then incubated at 4°C overnight with anti-Rhcg antibody. The sections were washed in PBS and incubated for 30 min with polymer-linked, peroxidase-conjugated goat anti-rabbit IgG (MACH2, Biocare Medical), again washed with PBS, and then exposed to diaminobenzidine for 5 min. The sections were washed in distilled water, then dehydrated with xylene, mounted, and observed by light microscopy. Comparisons of labeling were made only between sections of the same thickness. Sections were examined on a Nikon E600 microscope equipped with DIC optics and photographed using a DXM1200F digital camera and ACT-1 software (Nikon). Color correction was performed using Adobe Photoshop CS2 software (Adobe Systems, San Jose, CA).
Double immunolabeling procedure.
Colocalization of Rhcg with AQP2 was accomplished using sequential immunoperoxidase procedures. The first immunoperoxidase procedure used the protocol for single labeling described above with the exception that treatment with Trilogy Reagent was not used. After the diaminobenzidine reaction, the sections were washed in glass-distilled water and then in PBS and incubated in 3% H2O2 for 30 min, and then blocked with 10% NGS and Mouse Detective. The sections were treated for 60 min with the second primary antibody, washed in PBS, incubated with the polymer-linked, peroxidase-conjugated anti-rabbit secondary antibody, then washed with PBS. Vector SG (Vector Laboratories) was used as the chromogen to produce a blue label easily distinguishable from the brown label produced by the diaminobenzidine used for detection of the first protein. The sections were washed with glass-distilled water, dehydrated with xylene, mounted with Permount, and observed by light microscopy.
Immunogold electron microscopy.
Briefly, the immunogold labeling procedure was performed by exposure of the ultrathin tissue sections to the primary antibody and then to a goat anti-rabbit IgG secondary antibody conjugated to 0.8-nm colloidal gold particles (Aurion Ultrasmall EM Grade, Electron Microscopy Sciences, Ft. Washington, PA). Unless noted otherwise, all steps were done by floating the grids on droplets of solution at room temperature. The sections were exposed to 0.1 M NH4Cl for 1 h, rinsed with PBS, treated with incubation buffer [0.2% acetylated BSA (Aurion BSA-c, Electron Microscopy Sciences) and 10 mM NaN3, in PBS, pH 7.4] for 30 min, then incubated in a humidified chamber overnight at 4°C with affinity-purified antibody A diluted in incubation buffer. The sections were washed and exposed for 1.5 h to the secondary antibody diluted in incubation buffer. The sections were washed with the incubation buffer, washed with PBS, postfixed with 1.25% glutaraldehyde in PBS, and washed with PBS and then with distilled water. Silver enhancement of the gold particles was done using Aurion EM SE (Electron Microscopy Sciences) for 45 min, and then the grids were washed again with distilled water, dried overnight, and counterstained with saturated uranyl acetate. Each group of sections subjected to the immunogold procedure included a control section that was exposed to the incubation buffer in place of the primary antibody. Ultrathin sections were examined using a Hitachi 7600 transmission electron microscope (Hitachi High Technologies America, Pleasanton, CA) equipped with a MacroFire slow-scan CCD camera (Optronics, Goleta, CA) and AMT Image Capture software (Advanced Microscopy Techniques, Danvers, MA).
Epithelial cell types in the collecting duct and connecting segment were identified by their distinct structural features, which have been described previously (33, 39).
Membrane protein preparation.
Animals were anesthetized with intraperitoneal pentobarbital sodium (50 mg/kg body wt), and the kidneys were rinsed by in vivo cardiac perfusion with PBS (pH 7.4), rapidly removed, and stored frozen at −70°C until used. Proteins were extracted using a Tissue Tearor homogenizer (BioSpec Products) and T-PER Tissue Protein Extraction Reagent (Pierce Biotechnology, Rockford, IL) according to the manufacturer's recommended procedures. An aliquot was obtained for protein determination by using a BCA assay, and the remainder was stored frozen at −70°C until used.
Immunoblotting procedure.
Twenty micrograms of the renal membrane protein were electrophoresed on 10% PAGE ReadyGel (Bio-Rad, Hercules, CA). Gels were then transferred electrophoretically to nitrocellulose membranes, blocked with 5 g/dl nonfat dry milk, and incubated for 1 h with antibody A diluted in Blotto buffer (50 mM Tris, 150 mM NaCl, 5 mM Na2EDTA, and 0.05% Tween 20, pH 7.5) with 5 g/dl nonfat dry milk. Equivalence of loading and transfer was assessed with Ponceau S staining using standard procedures. After washing, membranes were exposed to secondary antibody (goat anti-rabbit IgG or goat anti-mouse IgG conjugated to horseradish peroxidase; Promega, Madison, WI) at a dilution of 1:5,000. Sites of antibody-antigen reaction were visualized by using enhanced chemiluminescence (SuperSignal West Pico Substrate, Pierce) and a Kodak Image Station 440CF digital imaging system.
Floxed Rhcg mouse generation.
In preliminary work, we generated transgenic mice with germ-line transmission of loxP sites flanking exons 5 and 9 of the mouse Rhcg gene. Briefly, a mouse chromosome 7 sequence from Ensembl database build 30 was used as a reference. Mouse C57BL/6 BAC clone RP23-207N5 was used to generate the homologous arms and the conditional knockout region for the gene-targeting vector and the Southern probes for screening targeted events. The 5′ homologous arm (8.1 kb) and conditional knockout region (2.7 kb) were generated by RED cloning/gap repair. The 3′ homologous arm (1.7 kb) was generated by PCR using proofreading LA Taq DNA polymerase (Takara). These fragments were cloned into the 3loxP3NwCD vector and confirmed by restriction digestion and end-sequencing. The final vector was obtained by standard molecular cloning. Aside from the homologous arms, the final vector also contained loxP sequences flanking the conditional knockout region (2.7 kb), loxP sequences flanking the Neo expression cassette [for positive selection of the embryonic stem (ES) cells], and a DTA expression cassette (for negative expression of the ES cells). The final vector was confirmed by both restriction digestion and end-sequencing analysis. NotI was used for linearizing the final vector before electroporation. External probes (5′ and 3′) were generated by PCR reaction and tested on genomic Southern analysis for ES screening. They were cloned into a pCR2.1 backbone and were confirmed by sequencing. Subsequently, ES cells were transfected with the gene-targeting construct, and homologous recombinant clones were identified. HR ES clones were microinjected into blastocysts and transferred into pseudopregnant females to generate chimeras. Chimeras were bred to generate hemizygous floxed Rhcg mice, and the hemizygous mice were used to generate homozygous floxed Rhcg mice. This work was done by Caliper Life Sciences (formerly Xenogen Biosciences) under contract from the University of Florida.
Genomic evidence of Cre-recombinase-dependent gene recombination.
Primers were designed that flank both loxP sites, thereby enabling identification of genomic recombination. These primers were UF2-KO F: 5′-ATGGGAGCTGCTATGAATGGGTAAGGAC-3′, and UF2-del-3R: 5′-GATGCAGCTAGAGTTGGGGACAGAGAC-3′. These primers will amplify using PCR an ∼700-bp DNA fragment from mice with recombination at the loxP sites, ∼3.4 kb from mice with loxP sites flanking exons 5–9 without recombination, and ∼3.2 kb from wild-type mice genomic DNA. PCR amplification was performed using Go Taq Hot Start Polymerase (Promega), an annealing temperature of 60°C, an extension time of 5 min, and 36 cycles. Amplified products were separated using electrophoresis and detected on a Kodak Image Station 440CF digital imaging system.
Genotyping transgenic mice.
Transgenic mice were genotyped using tail-clip samples obtained at ∼14 days of age. Genomic DNA was isolated using standard techniques. The Ksp-cadherin-Cre gene was identified using previously described primers, 5′-AGGTTCGTGCACTCATGGA-3′ and 5′-TCGACCAGTTTAGTTACCC-3′ (32). To differentiate wild-type from floxed Rhcg alleles, we used primers flanking the 3′ loxP site, 5′-GTAGGGCACGGTGTCACCTGTAAAT-3′ and 5′-GGATTACAAGGTGACACTGATGCAGC-3′. Amplification of a wild-type allele yields a product of ∼230 bp, and amplification of an allele with a loxP site yields a product of ∼400 bp.
Probe preparation for Northern blot analysis.
cDNA encoding mouse Rhcg was cloned from normal mouse kidney and ligated into pcDNA3.1 (Invitrogen). It was then transformed into a competent cell suspension (One Shot TOP10 chemically competent Escherichia coli cells, Invitrogen) following the manufacturer's protocol. Plasmid DNA for Rhcg was purified using Qiagen Plasmid Midi kits. A 392-bp probe and 744-bp probe against nucleotides 371-763 and 763-1507 of mouse Rhcg DNA (NM019799) were generated by digesting Rhcg with Pst1/Sac1 and Kpn1/Sac1, respectively. Gel-extracted DNA fragments (1 μg) were used for digoxigenin (DIG)-labeled DNA probe by random primer method using the DIG High Prime DNA labeling kit (Roche Applied Science, Indianapolis, IN) following the manufacturer's protocol.
RNA extraction and Northern blot analysis.
Total RNA was extracted from whole kidney tissue using RNeasy Mini Kit (Qiagen). Total RNA sample (3 μg) and RNA molecular weight marker (Roche Applied Science) were denaturated with four volumes of formaldehyde loading buffer (formamide, 37% formaldehyde, 10× MOPS, 2.5% bromophenol blue, 50% glycerol, ethidium bromide) at 70°C for 15 min and chilled on ice for 2 min. Total RNA samples were loaded onto a 1.5% agarose/2% formaldehyde gel and separated by gel electrophoresis in 1× MOPS running buffer at 80 V. To remove formaldehyde, the gel was incubated twice in 20× SSC (1× SSC = 150 mM NaCl and 15 mM Na citrate) for 15 min on a shaker. Gels were then imaged using ultraviolet transillumination to ensure the integrity of RNA and the loading of equal amounts of RNA. RNA was then transferred from the agarose gel to positively charged nylon membranes (Hybond-N+, Amersham Biosciences) by vacuum blotter for 1 h with 50 mbar, and the RNA was fixed onto the membrane by UV cross-linking. After rinsing the nylon membrane briefly in DEPC water, the membrane was checked for transfer efficiency using UV transillumination. The nylon membranes were prehybridized in DIG Easy Hyb buffer at 50°C for 30 min. Hybridization was performed at 50°C overnight with DIG-labeled DNA probe that was labeled by High Prime DNA Labeling (Roche Applied Science). A probe for the glyceraldehyde-3-phosphate dehydrogenase (GAPDH) was used to verify uniform RNA loading and integrity. Stringency washes were performed twice at room temperature with 2× SSC in 0.1% SDS for 5 min and were followed by two washes in 0.5× SSC containing 0.1% SDS at 68°C for 15 min. Blots were visualized by chemiluminescence detection with CSPD (Roche Applied Science) following the manufacturer's instructions and a Kodak Image Station 440CF digital imaging system.
RESULTS
Light microscopy.
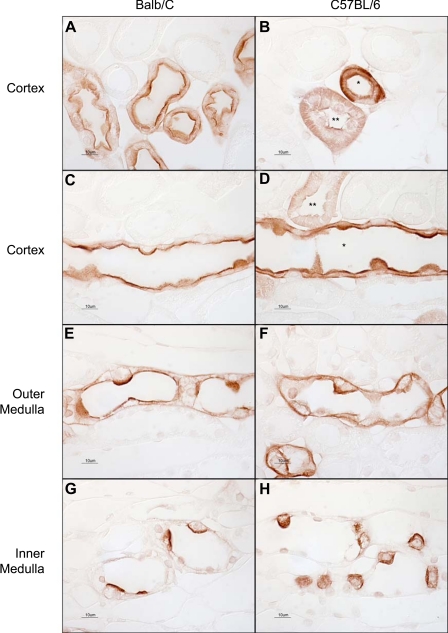
Our initial studies used light microscopic techniques to examine Rhcg immunoreactivity in the mouse kidney. Using antibody A, both apical and basolateral Rhcg immunolabel were present in both C57BL/6 and Balb/c mouse strains, with the only difference that the basolateral immunolabel was substantially more intense in the C57BL/6 mouse kidney (Fig. 1). Kidneys from Black Swiss 129 and C3H mice produced similar findings as present in Balb/c mice (data not shown).
Fig. 1.
Light microscopic examination of Rh C glycoprotein (Rhcg) immunoreactivity using antibody A in Balb/c and C57BL/6 mouse kidney. A: connecting segments in Balb/c mouse kidney. Strong apical and faint basolateral immunolabel are present. B: connecting segment (*) and distal convoluted tubule (DCT; **) in a C57BL/6 mouse kidney. Both apical and basolateral Rhcg immunolabel are easily evident. C: cortical collecting duct (CCD) in a Balb/c mouse kidney. Strong apical and weak basolateral immunolabel are present. D: CCD from a C57BL/6 mouse kidney. Both strong apical and strong basolateral immunolabel are present in the CCD (*). A DCT with lesser intensity apical and basolateral Rhcg immunolabel is also demonstrated (**). E: outer medullary collecting duct (OMCD) from a Balb/c kidney. Apical immunolabel is easily evident; basolateral immunolabel is of lesser intensity. F: OMCD in a C57BL/6 mouse kidney. Both apical and basolateral Rhcg immunolabel are relatively strong. G: inner medullary collecting ducts (IMCD) in the Balb/c kidney. Strong apical and weak basolateral immunolabel are evident. H: IMCD from a C57BL/6 kidney, where both strong apical and basolateral Rhcg immunolabel are present. The same dilution of primary antibody, 1:40,000, was used in all panels. Results are representative of findings in at least 6 mice.
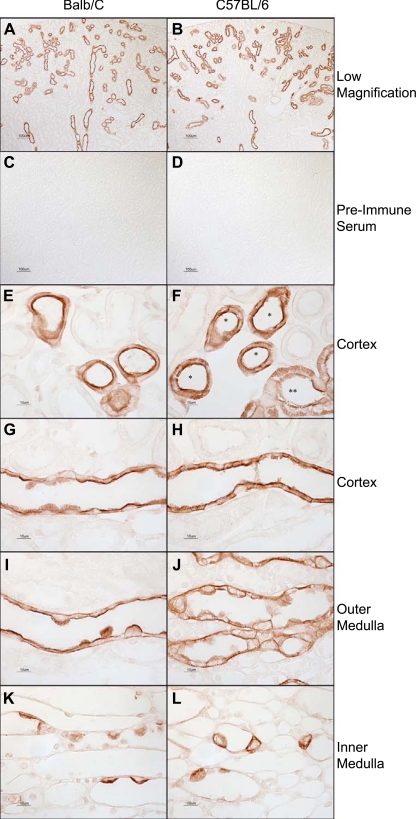
To confirm the presence of basolateral Rhcg further, we utilized a second anti-Rhcg antibody (antibody B) directed against a different Rhcg epitope. By low-power magnification, the tubule distribution of Rhcg using antibody B was similar to that reported previously (5) and to that observed with antibody A (Fig. 2). No immunolabel was detected using preimmune serum at the same dilution. High-power magnification showed that the cellular localization of Rhcg immunolabel using antibody B was similar to that observed with antibody A, with both apical and basolateral Rhcg immunolabel present in both C57BL/6 and in Balb/c mouse kidney, and with basolateral Rhcg immunolabel more intense in the C57BL/6 mouse kidney than in the Balb/c mouse kidney (Fig. 2). Thus two different Rhcg antibodies demonstrate apical and basolateral Rhcg immunoreactivity in the mouse kidney and both demonstrate the same pattern of strain-dependent basolateral immunolabel intensity.
Fig. 2.
Distribution of Rhcg in mouse kidney using Rhcg antibody B. A and B: low-magnification micrographs of Rhcg immunolabel in Balb/c (A) and C57BL/6 (B) kidney using antibody B. Rhcg immunolabel is present in a subpopulation of renal epithelial cells, consistent with previous demonstration in DCT, connecting tubule (CNT), initial collecting tubule (ICT), and CCD. Antibody B was used at a dilution of 1:10,000 in these studies. C and D: substitution of preimmune sera for antibody B. No detectable immunolabel is present in either Balb/c (C) or C57BL/6 (D) kidneys. E: connecting segments in Balb/c mouse kidney. Strong apical and faint basolateral immunolabel are present. F: connecting segment (*) and DCT (**) in a C57BL/6 mouse kidney. Both apical and basolateral Rhcg immunolabel are easily evident. G: CCD in a Balb/c mouse kidney. Strong apical and weak basolateral immunolabel are present. H: CCD from a C57BL/6 mouse kidney. Both strong apical and strong basolateral immunolabel are present. I: OMCD from a Balb/c kidney. Apical immunolabel is easily evident; basolateral immunolabel is of lesser intensity. J: OMCD in a C57BL/6 mouse kidney. Both apical and basolateral Rhcg immunolabel are relatively strong. K: IMCD in the Balb/c kidney. Strong apical and weak basolateral immunolabel are evident. L: IMCD from a C57BL/6 kidney, where both strong apical and basolateral Rhcg immunolabel are present. The same dilution of antisera or preimmune sera, 1:10,000, was used in all experiments. Results are representative of findings in at least 6 mice.
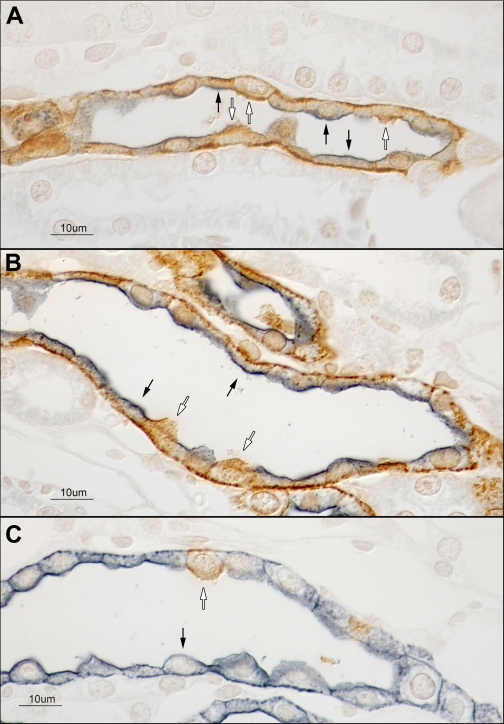
To confirm further that Rhcg expression was present in both intercalated cells and principal cells, we used double immunolabeling of Rhcg with the principal cell-specific marker AQP2. In the C57BL/6 mouse kidney, both intercalated cells and principal cells expressed easily identifiable apical and basolateral Rhcg immunolabel (Fig. 3). Occasional cortical collecting duct (CCD) intercalated cells expressed either very low levels of or no detectable Rhcg immunolabel and most likely represent B-type intercalated cells (data not shown), which we found to have negligible Rhbg immunoreactivity in previous studies (34). Occasional connecting tubule cells expressed abundant apical Rhcg, but low levels of basolateral Rhcg immunolabel (data not shown). The low level of basolateral Rhcg immunolabel in the Balb/c mouse kidney precluded similar observations in this strain. The presence of basolateral AQP2 immunolabel in the IMCD, although not appreciated frequently, has been reported previously (22).
Fig. 3.
Double immunolabeling for Rhcg and aquaporin-2 (AQP2) in the C57BL/6 mouse kidney. Double immunolabeling for Rhcg (brown) and AQP2 (blue) was performed to confirm that both intercalated and principal cells express basolateral Rhcg immunoreactivity. A: CCD demonstrating that both principal cells (black arrows) and intercalated cells (white arrows) express basolateral Rhcg immunolabel. B: OMCD and confirming the presence of basolateral Rhcg immunolabel in both principal cells (black arrows) and intercalated cells (white arrows). C: representative IMCD. Intercalated cells (white arrows), identified by the absence of AQP2 immunoreactivity, express both apical and basolateral Rhcg immunolabel. IMCD cells (black arrows) do not express detectable Rhcg immunolabel. Basolateral AQP2 immunolabel in the IMCD has been demonstrated previously by others (22). Rhcg antibody A was used in these studies. Results are representative of findings in at least 6 mice.
Immunogold electron microscopy.
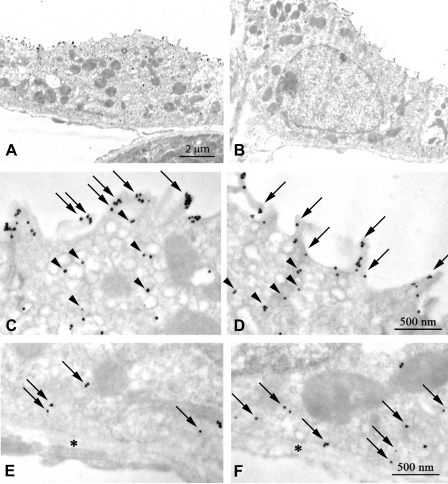
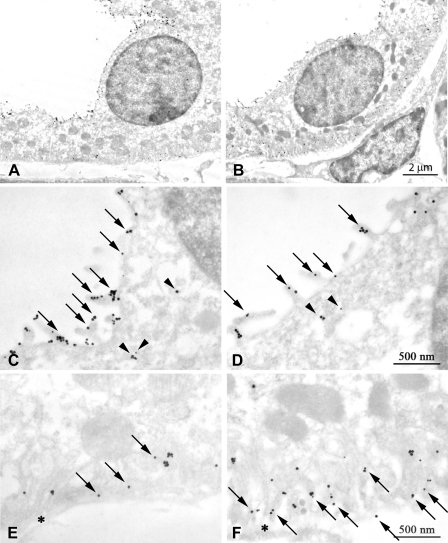
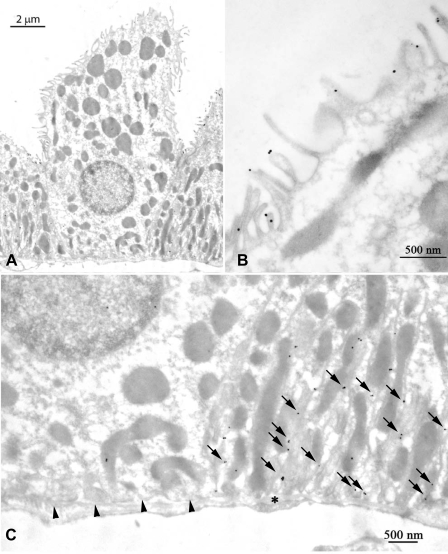
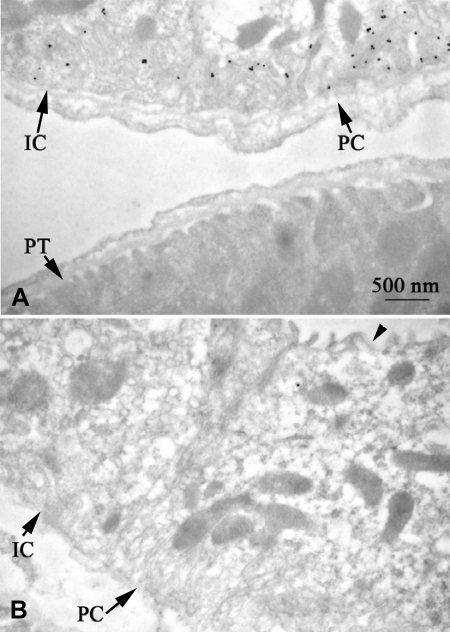
Next, we sought to confirm that the basolateral immunolabel observed by light microscopy represented basolateral plasma membrane expression. To do so, we used immunogold electron microscopy to localize Rhcg expression in the C57BL/6 and Balb/c mouse kidney. In both the C57BL/6 and the Balb/c mouse CCD, basolateral Rhcg immunolabel was present in A-type intercalated cells (Fig. 4) and in principal cells (Fig. 5). Rhcg immunolabel was also present in the apical plasma membrane and in subapical sites in A-type intercalated cells (Fig. 4), principal cells (Fig. 5), connecting tubule cells, and distal convoluted tubule cells in both Balb/c and C57BL/6 kidney. Non-A, non-B type intercalated cells in the connecting tubule expressed apical plasma membrane Rhcg immunolabel with little-to-no basolateral Rhcg immunolabel (Fig. 6). No Rhcg immunolabel was present in the proximal tubule, the thick ascending limb of the loop of Henle, or other cellular elements and or in samples exposed to the immunogold procedure with the primary antibody omitted (Fig. 7). Thus immunogold electron microscopy confirms basolateral Rhcg immunolabel in connecting tubule cells, principal cells, and the A-type intercalated cells in the mouse kidney.
Fig. 4.
Immunogold electron microscopic localization of Rhcg in CCD type A-intercalated cells. A: low-power magnification image of a CCD type A-intercalated cell in a Balb/c mouse. C: high-power micrograph of the apical region of this cell. Abundant apical plasma membrane Rhcg (arrows) and subapical immunolabel associated with cytoplasmic vesicles (arrowheads) are present. E: basolateral region of this intercalated cell demonstrating basolateral plasma membrane Rhcg immunolabel (arrows). B: low-power magnification image of a CCD intercalated cell in a C57BL/6 mouse kidney. D: high-power micrograph of the apical region of this cell. Abundant apical plasma membrane Rhcg (arrows) and subapical immunolabel associated with cytoplasmic vesicles (arrowheads) are present. F: basolateral region of this intercalated cell demonstrating basolateral plasma membrane Rhcg immunolabel (arrows). E and F: *, basement membrane. Rhcg antibody A was used in these studies. Results are typical of findings in at least 5 mice in each strain.
Fig. 5.
Immunogold electron microscopic localization of Rhcg in CCD principal cells. A: low-power magnification image of a CCD principal cell in a Balb/c mouse. C: high-power micrograph of the apical region of this cell. Abundant apical plasma membrane Rhcg (arrows) and occasional subapical (arrowheads) immunolabel are present. E: basolateral region of this principal cell demonstrating basolateral plasma membrane Rhcg immunolabel (arrows). B: low-power magnification image of a CCD principal cell in a C57BL/6 mouse kidney. D: high-power micrograph of the apical region of this cell. Abundant apical plasma membrane Rhcg (arrows) and occasional subapical (arrowheads) immunolabel are present. F: basolateral region of this principal cell demonstrating abundant basolateral plasma membrane Rhcg immunolabel (arrows). E and F: *, basement membrane. Rhcg antibody A was used in these studies. Results are typical of findings in at least 5 mice in each strain.
Fig. 6.
Immunogold electron microscopic localization of Rhcg in C57BL/6 non-A, non-B cell. A: low-power magnification image of a non-A, non-B cell in the CNT. B: high-power image of the apical portion of this cell demonstrating apical plasma membrane Rhcg immunolabel. C: absence of basolateral Rhcg immunolabel in the non-A, non-B cell (arrowheads), whereas abundant basolateral plasma membrane Rhcg immunolabel is present in the adjacent CNT cell (arrows). *, Basement membrane. Rhcg antibody A was used in these studies and results are typical of findings in at least 5 mice.
Fig. 7.
Demonstration of specificity of immunogold electron microscopic localization of Rhcg. A: strong basolateral plasma membrane immunogold labeling in C57BL/6 CCD intercalated cell (IC) and principal cell (PC) whereas the adjacent proximal tubule (PT) is devoid of immunolabel. B: in sections not exposed to the primary antibody, immunogold label is absent. Arrows, basolateral; arrowhead, apical.
Absence of collecting duct Rhcg in transgenic mice with kidney-specific Rhcg deletion.
To confirm further that the basolateral immunolabel identified with these two anti-Rhcg antibodies reflected basolateral Rhcg expression, and not nonspecific immunoreactivity, we examined transgenic mice with kidney-specific Rhcg deletion. Transgenic mice with loxP sites in introns flanking exons 5 and 9 of the Rhcg gene were bred with transgenic mice expressing Cre-recombinase under the control of the 1,329-bp Ksp-cadherin 5′-flanking region (32). Mice homozygous for floxed Rhcg alleles and expressing Ksp-cadherin-Cre were identified. Littermates homozygous for floxed Rhcg alleles but not expressing Ksp-cadherin-Cre were used as control mice.
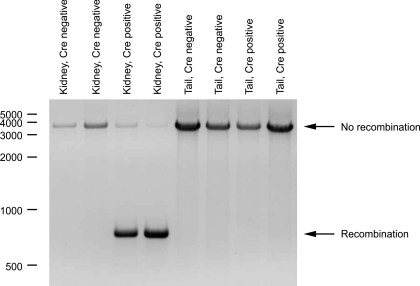
To confirm effective Rhcg gene recombination, we examined DNA obtained from either the kidney or tail of mice expressing Ksp-cadherin-Cre or their Cre-negative littermates. DNA was amplified using primers flanking exons 5 and 9 and the 5′ and 3′ loxP sites. PCR amplification was then used to determine the size of the region between the primers. Figure 8 shows these results. Ksp-cadherin-Cre-positive mice show nearly complete genomic recombination with loss of Rhcg exons 5–9 in their kidneys, but not in their tails. There was no recombination in Ksp-cadherin-Cre-negative mice.
Fig. 8.
Demonstration of kidney-specific genomic recombination of Rhcg gene in Rhcgfl/fl, Ksp-cadherin-Cre positive mice. PCR amplification of genomic DNA from kidneys of Ksp-cadherin-Cre-positive, Rhcgfl/fl mice yields a product of 750 bp, the predicted size of the product following recombination at the loxP sites flanking exons 5–9 of the Rhcg gene. A lesser amount of a 3.6-kb product is present, indicating that recombination was not 100%. PCR amplification of tail DNA from the same animals yields only the 3.6-kb product, the predicted size in the absence of genomic recombination. PCR amplification of kidney and tail-clip DNA from Rhcgfl/fl littermates negative for Ksp-cadherin-Cre yields a product of 3.6 kb, indicating no genomic recombination in the absence of Ksp-cadherin-Cre expression.
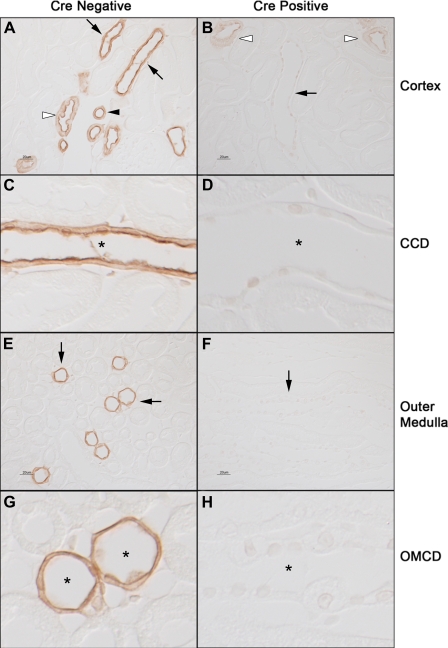
Next, we examined Rhcg immunoreactivity in the kidneys of Cre-positive and Cre-negative mice. In Ksp-cadherin-Cre-positive mice, Rhcg immunoreactivity was not detectable in the collecting duct in the cortex, outer medulla, or inner medulla (Fig. 9). Faint Rhcg immunoreactivity was present in a subset of cortical epithelial cells. Double immunolabeling using antibodies directed against AQP2 and TSC confirmed that these were the connecting segment and distal convoluted tubule, suggesting incomplete Rhcg recombination in these epithelial cells (data not shown). The lack of complete recombination is supported by the presence of a faint 3.6-kb product in the genomic PCR amplification using primers flanking exons 5 and 9 (Fig. 8). In Ksp-cadherin-Cre-negative mice, both apical and basolateral Rhcg immunoreactivity was present in the collecting duct in the cortex, outer medulla, and inner medulla, as well as the connecting segment and distal convoluted tubule, in the same pattern as seen in wild-type C57BL/6 mice, the background strain for these transgenic mice. The absence of both apical and basolateral Rhcg immunoreactivity in mice with kidney-specific Rhcg deletion confirms that that basolateral immunolabel observed in both Ksp-cadherin-Cre-negative mice, as well as in normal mice, is due to basolateral Rhcg expression.
Fig. 9.
Rhcg immunolabel in Rhcgfl/fl, Ksp-cadherin-Cre negative (Cre-negative), and Rhcgfl/fl, Ksp-cadherin-Cre positive (Cre-positive) mice. A and C: show low- and high-power micrographs of Rhcg immunolabel in cortex of Cre-negative mice homozygous for floxed Rhcg alleles. A normal distribution of Rhcg immunolabel in CCD (black arrows), DCT (white arrowhead), and connecting segment (black arrowhead) is present. At high-power magnification (C) apical and basolateral Rhcg immunolabel in a CCD is demonstrated (*). B and D: Rhcg immunolabel in kidneys with kidney-specific Rhcg deletion (Cre-positive). No Rhcg immunolabel is evident in CCD at either low-power magnification (black arrow, C) or high-power magnification (*, D). Rhcg immunoreactivity is present in CNT and DCT segments (white arrowheads). E and G: micrographs of outer medulla from Cre-negative mice. Normal Rhcg immunolabel is present in the OMCD (black arrows, E), and high-power micrographs demonstrate apical and basolateral Rhcg immunolabel in the OMCD (*, G). F and H: micrographs from outer medulla from kidney of animal with kidney-specific Rhcg deletion (Cre-positive). No Rhcg immunolabel is detectable in the OMCD, either at low magnification (black arrows, F) or high magnification (*, H). All experiments used antibody A at a dilution of 1:80,000, all tissues were processed simultaneously, and all micrographs were obtained using identical exposure settings.
Single or multiple Rhcg isoforms.
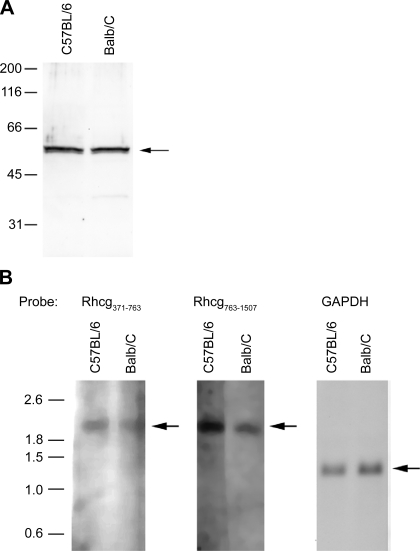
Simultaneous apical and basolateral Rhcg expression could reflect either trafficking of the same protein to both the apical and the basolateral plasma membrane or targeting of different isoforms to different plasma membrane domains. Immunoblot analysis of proteins from C57BL/6 and Balb/c kidneys identified only a single band at ∼57 kDa (Fig. 10A). Thus, if basolateral Rhcg represents a different isoform than apical Rhcg, it appears to have a similar molecular weight, at least by immunoblot analysis.
Fig. 10.
Immunoblot and Northern blot analysis for Rhcg in C57/Bl6 and Balb/c mouse kidneys. A: immunoblot assay for Rhcg in kidney proteins from C57BL/6 and Balb/c mice. There is no detectable difference in Rhcg protein molecular weight between C57BL/6 and Balb/c kidneys, suggesting that the molecular weight of basolateral Rhcg is not detectably different from apical Rhcg. B: Northern blot analysis of total RNA from C57BL/6 and Balb/c mouse kidneys using 2 different probes directed against nucleotides 371–763 and 763-1507 of mouse Rhcg DNA. GAPDH is used as an internal control for loading and transfer efficiency. Single bands for Rhcg mRNA at ∼2.1 kb are present in both mouse strains. Results in each panel are representative of findings from at least 3 animals of each strain.
Northern blot analysis was then performed using two separate probes against mouse Rhcg. Analysis of mRNA from C57BL/6 and Balb/c kidneys with each of the probes identified only a single product of ∼2.1 kb, the reported size of Rhcg mRNA (Fig. 10B). Thus there is no evidence of an alternative-sized Rhcg transcript that might give rise to basolateral Rhcg expression.
Basolateral Rhbg expression.
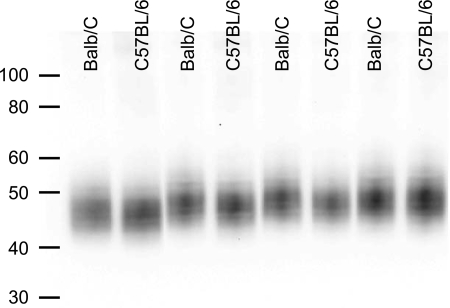
Both Balb/c and C57BL/6 mice express a second ammonia transporter family member, Rhbg, in their basolateral plasma membrane (27, 34, 40). To determine whether altered basolateral Rhbg expression in the Balb/c mouse compensates for differences in basolateral Rhcg expression, we compared Rhbg protein expression in these strains. Rhbg protein expression was not significantly different between C57BL/6 and Balb/c mice (Fig. 11). There was a slight, <1 kDa, difference in the apparent molecular mass of Rhbg between C57BL/6 and Balb/c mice, suggestive of slight differences in glycosylation in different mouse strains. Immunohistochemistry with light microscopy did not detect differences in the cellular distribution of Rhbg between C57BL/6 and Balb/c mice (data not shown).
Fig. 11.
Rh B glycoprotein (Rhbg) expression in Balb/c and C57BL/6 mice. A: representative immunoblot of renal proteins from Balb/c and C57BL/6 mice. This is no apparent difference in Rhbg protein expression between different strains, except for the observation that Rhbg's apparent molecular weight was slightly less in C57BL/6 mice than in Balb/c mice, with an absolute difference was <1 kDa. Equivalence of loading and transfer was confirmed using Ponceau S staining (data not shown).
DISCUSSION
Identifying the specific cellular location of integral membrane proteins is critical for understanding their function. The current study demonstrates that Rhcg is present in both the apical and basolateral plasma membrane in the mouse distal convoluted tubule, connecting tubule, and collecting duct, although there are strain-dependent differences in the amount of basolateral expression. Both C57BL/6 and Balb/c mouse kidneys exhibit the same size Rhcg protein and mRNA by immunoblot and Northern blot analysis, suggesting that basolateral Rhcg may be indistinguishable from apical Rhcg, with the exception that it is trafficked to the basolateral plasma membrane. These observations have important implications for our understanding of renal ammonia handling.
The first major finding in this study is that the mouse kidney expresses basolateral as well as apical Rhcg immunoreactivity. This finding is consistent with previous studies in both human and rat kidneys that identified both apical and basolateral Rhcg expression (8, 30, 31). Our use of antibodies directed against two different epitopes and the finding that both antibodies yielded identical results, both in terms of subcellular distribution and in the strain-dependent variations in basolateral Rhcg immunolabel intensity, strengthens the conclusion that the mouse kidney expresses both apical and basolateral Rhcg. This conclusion is confirmed by immunogold electron microscopy, which clearly shows basolateral plasma membrane Rhcg immunolabel. The absence of immunolabel in mice with collecting duct-specific Rhcg gene deletion demonstrates that the basolateral immunolabel observed is not due to nonspecific binding. Nonspecific binding of antibody A to Rhbg is unlikely since we have shown that antibody A does not label hepatic perivenous hepatocytes, cells which expresses high levels of Rhbg (42).
Basolateral Rhcg appears likely to mediate an important role in renal ammonia metabolism. In metabolic acidosis, outer medullary collecting duct (OMCD) principal cell basolateral Rhcg expression increases in parallel with changes in ammonia excretion, suggesting it contributes to transcellular ammonia transport (31). In reduced renal mass, which is associated with increased single-nephron ammonia metabolism, basolateral Rhcg expression increases in the CCD principal cell, OMCD principal cell, and OMCD intercalated cell (14). Thus basolateral Rhcg may be important in basolateral ammonia uptake.
It is important to recognize that the presence of basolateral Rhcg does not necessitate that all basolateral ammonia transport occurs through this protein. In cultured mouse collecting duct cells expressing Rhcg, ammonia transport occurs through both transporter-facilitated mechanisms and lipid-phase NH3 diffusion (10, 11). In the inner medullary collecting duct (IMCD), where only a small minority of cells, the intercalated cells, express Rhcg (5, 34), the predominant basolateral ammonia transport mechanism involves basolateral Na+-K+-ATPase (36–38). It is possible that basolateral ammonia transport mechanisms may differ in intercalated cell and nonintercalated cells in the IMCD. It is also important to recognize that basolateral ammonia transport mechanisms likely differ in different portions of the collecting duct. In the CCD, where we find abundant basolateral Rhcg, peritubular ouabain does not alter ammonia secretion, suggesting that basolateral Na+-K+-ATPase is not necessary for CCD transepithelial ammonia secretion (15) whereas basolateral Na+-K+-ATPase mediates an important role in the IMCD (36–38). Figure 12 summarizes our current model of collecting duct ammonia secretion.
Fig. 12.
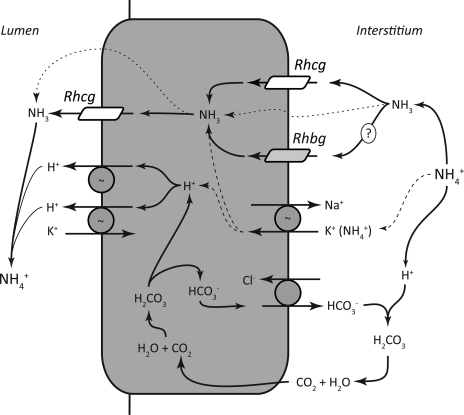
Detailed model of collecting duct ammonia secretion. We propose the following model of collecting duct ammonia secretion. Interstitial NH4+ is in equilibrium with NH3 and H+. NH3 is transported across the basolateral membrane, predominantly by Rhcg, but also by lipid diffusion (dotted line) and possibly by Rhbg. In the IMCD, basolateral Na+-K+-ATPase transports NH4+ (dashed line). Intracellular NH3 is secreted across the apical membrane by apical Rhcg. There is also likely to be a component of diffusive apical NH3 transport (dotted line). H+-ATPase and H+-K+-ATPase secrete H+, which combines with luminal NH3 to form NH4+, which is “trapped” in the lumen. Apical H+-K+-ATPase may also contribute to NH4+ secretion (not shown) (21). Intracellular H+ is generated by carbonic anhydrase II-accelerated CO2 hydration, forming carbonic acid, which dissociates to H+ and HCO3−. Basolateral Cl−/HCO3− exchange transports the HCO3− across the basolateral membrane, where it combines with H+ released from NH4+, forming carbonic acid, which dissociates to CO2 and water. This CO2 can recycle into the cell, supplying the CO2 used for cytosolic H+ production. The net result is NH4+ transport from the interstitium into the luminal fluid.
Different mouse strains exhibit significant differences in the intensity of basolateral Rhcg expression. These differences are unlikely to be due to technical differences because we used identical techniques with the different mouse strains. Instead, they are likely to be due to innate differences between the strains. Different inbred mouse strains are well known to exhibit multiple phenotypic differences, including variations in growth, appearance, injury, tissue repair, immunity, inflammation, and disease presentation (6, 7, 19).
Basolateral Rhcg expression could result either from alternative trafficking or from alternative splicing and/or gene products that transcribe two different proteins detectable by the anti-Rhcg antibodies used in the current study. At present, there are no data to support the latter hypothesis. Antibodies to Rhcg identified only a single molecular weight band in both C57BL/6 and Balb/c mouse kidney. Similarly, although the human kidney expresses a low level of an alternative, 2.7-kb, transcript (20), there was no evidence of an alternative transcript in the mouse kidney in the current study. However, the current studies cannot exclude the possibility that differential apical and basolateral Rhcg expression results from posttranslation modifications, alternative splicing, or alternative gene products that produce protein and/or mRNA products of identical, or at least indistinguishable, sizes.
Subcellular redistribution of transport proteins is a common mechanism regulating transport function in epithelial cells (1, 2). Rhcg is expressed in both the apical plasma membrane and subapical sites in both the rat kidney (31) and the mouse kidney (current study). In the rat kidney, changes in Rhcg's subcellular distribution is an important regulatory mechanism in response to both metabolic acidosis and reduced renal mass (14, 31). The current study extends these previous observations and suggests that subcellular redistribution of Rhcg may be an important mechanism regulating mammalian, not just rat, Rhcg function.
The current study in combination with previous studies examining basolateral Rhbg expression (27, 34, 40) shows that essentially all mouse epithelial cells in the connecting tubule, initial collecting tubule, CCD, and OMCD express both Rhcg and Rhbg in their basolateral plasma membrane. The presence of two nonerythroid Rh glycoproteins, Rhbg and Rhcg, in the basolateral plasma membrane suggests that both may contribute to basolateral ammonia uptake. However, whether Rhbg actually contributes to renal ammonia excretion is unknown. There were no differences in Rhbg protein expression in response to either metabolic acidosis (30) or reduced renal mass in the rat kidney (14), and transgenic animals lacking Rhbg expression have normal acid-base homeostasis both under basal conditions and in response to metabolic acidosis (3), suggesting that Rhbg is not involved in renal ammonia metabolism. However, because virtually all renal epithelial cells that express Rhbg also express basolateral Rhcg, considering the possibility that basolateral Rhcg expression can mediate normal total levels of basolateral ammonia transport in the absence of Rhbg may be important. Why the non-A, non-B cell in the connecting tubule does not exhibit appreciable basolateral Rhcg immunolabel, whereas both the principal cell and the A-type intercalated cell do, is unclear, but suggests that the functional role of the non-A, non-B cell in transepithelial ammonia transport differs from that of the A-type cell.
Identification of basolateral Rhcg expression in the current study, but not in previous studies of the mouse kidney (3, 34), is likely to be due to a combination of several factors. First, our previous study used Balb/c mice, which the current study demonstrates has substantially lower levels of basolateral Rhcg than the C57BL/6 mouse. It is also likely that the immunohistochemical procedures used in the current study are more sensitive than those used in previous reports. First, our initial mouse study using antibody A used antisera (34), whereas the current study used affinity-purified antibody A, which increases the specificity of immunoreactivity and enables more accurate identification of low-abundance proteins. Second, for the present study we used a polymer-linked peroxidase conjugate for detection of the primary antibody, which increases the sensitivity and specificity of detection compared with previous methods, which used a biotinylated secondary antibody with antibody A (34) and indirect immunofluorescence, which was used with antibody B (3). The use of thinner tissue sections, 2 or 3 vs. 5 μm, further serves to enhance the resolution and to decrease nonspecific immunoreactivity and thereby increase the sensitivity to detect low-abundance proteins. Finally, the fixative, embedding, and immunolocalization techniques used in the current study differ from those used previously with antibody B (3).
The current study is the first report of a transgenic mouse with kidney-specific Rhcg deletion. The overall histology of the kidney examined using hematoxylin and eosin and the cellular distribution of Rhbg and H+-ATPase appeared normal (data not shown). There was essentially a complete loss of Rhcg from the entire collecting duct, with an incomplete loss in the connecting segment and distal convoluted tubule. Ksp-cadherin-Cre has been reported to yield high-level recombination in the loop of Henle and the collecting duct, with less efficient recombination in other renal epithelial cells (32). Nevertheless, this mouse will undoubtedly be useful for examining the role of renal Rhcg expression in the renal maintenance of normal acid-base homeostasis, as well as the response to physiological and pathophysiological perturbations.
In summary, the current study demonstrates several important new findings relating to the ammonia transporter family member Rhcg in the mouse kidney. The mouse kidney expresses both apical and basolateral Rhcg, which is similar to findings in both the rat and human kidney, although there are strain-dependent differences in the level of basolateral Rhcg expression in the mouse kidney. These observations suggest that basolateral Rhcg may contribute to facilitated transcellular ammonia movement. Furthermore, basolateral Rhcg is likely to be the same protein as apical Rhcg, but is trafficked to the basolateral plasma membrane. These observations have important implications for our understanding of renal ammonia metabolism.
GRANTS
This study was supported by funds from the National Institute of Diabetes and Digestive and Kidney Diseases (DK-45788), the Department of Veterans Affairs Merit Review Program, the Gatorade Research Foundation, an ISN fellowship award (to H.-Y. Kim), and the Post-Doctoral Fellowship Program of the Korea Science and Engineering Foundation (to H.-Y. Kim).
Acknowledgments
The authors thank Dr. Donald E. Kohan for numerous helpful discussions regarding generation of floxed Rhcg mice, the staff of the University of Florida College of Medicine Electron Microscopy Facility for expert tissue processing and sectioning for the light and electron microscopic studies, and Gina Cowsert for secretarial assistance. The authors also appreciatively thank Drs. Yves Colin, INSERM/Université Paris Diderot, Paris, France, and Dominique Goossens, INSERM U665/INTS, Paris, France, who developed, characterized, and supplied antibody B that was used in these studies.
The costs of publication of this article were defrayed in part by the payment of page charges. The article must therefore be hereby marked “advertisement” in accordance with 18 U.S.C. Section 1734 solely to indicate this fact.
Footnotes
Ammonia consists of two molecular forms, NH3 and NH4+, which are in equilibrium with each other according to the reaction NH3 + H+ ↔ NH4+. We use the term “ammonia” to refer to the sum of these two molecular forms and refer to each molecular form as either “NH3” or “NH4+”.
REFERENCES
- 1.Brown D Membrane recycling and epithelial cell function. Am J Physiol Renal Fluid Electrolyte Physiol 256: F1–F12, 1989. [DOI] [PubMed] [Google Scholar]
- 2.Brown D Targeting of membrane transporters in renal epithelia: when cell biology meets physiology. Am J Physiol Renal Physiol 278: F192–F201, 2000. [DOI] [PubMed] [Google Scholar]
- 3.Chambrey R, Goossens D, Bourgeois S, Picard N, Bloch-Faure M, Leviel F, Geoffroy V, Cambillau M, Colin Y, Paillard M, Houillier P, Cartron JP, Eladari D. Genetic ablation of Rhbg in mouse does not impair renal ammonium excretion. Am J Physiol Renal Physiol 289: F1281–F1290, 2005. [DOI] [PubMed] [Google Scholar]
- 4.DuBose TD, Good DW, Hamm LL, Wall SM. Ammonium transport in the kidney: new physiological concepts and their clinical implications. J Am Soc Nephrol 1: 1193–1203, 1991. [DOI] [PubMed] [Google Scholar]
- 5.Eladari D, Cheval L, Quentin F, Bertrand O, Mouro I, Cherif-Zahar B, Cartron JP, Paillard M, Doucet A, Chambrey R. Expression of RhCG, a new putative NH3/NH4+ transporter, along the rat nephron. J Am Soc Nephrol 13: 1999–2008, 2002. [DOI] [PubMed] [Google Scholar]
- 6.Fresno M, Kopf M, Rivas L. Cytokines and infectious diseases. Immunol Today 18: 56–58, 1997. [DOI] [PubMed] [Google Scholar]
- 7.Hamilton BA, Frankel WN. Of mice and genome sequence. Cell 107: 13–16, 2001. [DOI] [PubMed] [Google Scholar]
- 8.Han KH, Croker BP, Clapp WL, Werner D, Sahni M, Kim J, Kim HY, Handlogten ME, Weiner ID. Expression of the ammonia transporter, Rh C Glycoprotein, in normal and neoplastic human kidney. J Am Soc Nephrol 17: 2670–2679, 2006. [DOI] [PMC free article] [PubMed] [Google Scholar]
- 9.Han KH, Kim HY, Croker BP, Reungjui S, Lee SY, Kim J, Handlogten ME, Adin CA, Weiner ID. Effects of ischemia-reperfusion injury on renal ammonia metabolism and the collecting duct. Am J Physiol Renal Physiol 293: F1342–F1354, 2007. [DOI] [PubMed] [Google Scholar]
- 10.Handlogten ME, Hong SP, Westhoff CM, Weiner ID. Basolateral ammonium transport by the mouse inner medullary collecting duct cell (mIMCD-3). Am J Physiol Renal Physiol 287: F628–F638, 2004. [DOI] [PubMed] [Google Scholar]
- 11.Handlogten ME, Hong SP, Westhoff CM, Weiner ID. Apical ammonia transport by the mouse inner medullary collecting duct cell (mIMCD-3). Am J Physiol Renal Physiol 289: F347–F358, 2005. [DOI] [PubMed] [Google Scholar]
- 12.Handlogten ME, Hong SP, Zhang L, Vander AW, Steinbaum ML, Campbell-Thompson M, Weiner ID. Expression of the ammonia transporter proteins, Rh B glycoprotein and Rh C glycoprotein, in the intestinal tract. Am J Physiol Gastrointest Liver Physiol 288: G1036–G1047, 2005. [DOI] [PubMed] [Google Scholar]
- 13.Heitman J, Agre P. A new face of the Rhesus antigen. Nat Genet 26: 258–259, 2000. [DOI] [PubMed] [Google Scholar]
- 14.Kim HY, Baylis C, Verlander JW, Han KH, Reungjui S, Handlogten ME, Weiner ID. Effect of reduced renal mass on renal ammonia transporter family, Rh C glycoprotein and Rh B glycoprotein, expression. Am J Physiol Renal Physiol 293: F1238–F1247, 2007. [DOI] [PubMed] [Google Scholar]
- 15.Knepper MA, Good DW, Burg MB. Mechanism of ammonia secretion by cortical collecting ducts of rabbits. Am J Physiol Renal Fluid Electrolyte Physiol 247: F729–F738, 1984. [DOI] [PubMed] [Google Scholar]
- 16.Liu Z, Huang CH. The mouse Rhl1 and Rhag genes: sequence, organization, expression, and chromosomal mapping. Biochem Genet 37: 119–138, 1999. [DOI] [PubMed] [Google Scholar]
- 17.Liu Z, Chen Y, Mo R, Cc Hui Cheng JF, Mohandas N, Huang CH. Characterization of human RhCG and mouse Rhcg as novel nonerythroid Rh glycoprotein homologues predominantly expressed in kidney and testis. J Biol Chem 275: 25641–25651, 2000. [DOI] [PubMed] [Google Scholar]
- 18.Liu Z, Peng J, Mo R, Cc Hui, Huang CH. Rh type B glycoprotein is a new member of the Rh superfamily and a putative ammonia transporter in mammals. J Biol Chem 276: 1424–1433, 2001. [DOI] [PubMed] [Google Scholar]
- 19.Ma B, Blackburn MR, Lee CG, Homer RJ, Liu W, Flavell RA, Boyden L, Lifton RP, Sun CX, Young HW, Elias JA. Adenosine metabolism and murine strain-specific IL-4-induced inflammation, emphysema, and fibrosis. J Clin Invest 116: 1274–1283, 2006. [DOI] [PMC free article] [PubMed] [Google Scholar]
- 20.Marini AM, Matassi G, Raynal V, Andre B, Cartron JP, Cherif-Zahar B. The human Rhesus-associated RhAG protein and a kidney homologue promote ammonium transport in yeast. Nat Genet 26: 341–344, 2000. [DOI] [PubMed] [Google Scholar]
- 21.Nakamura S, Amlal H, Galla JH, Soleimani M. NH4+ secretion in inner medullary collecting duct in potassium deprivation: role of colonic H+-K+-ATPase. Kidney Int 56: 2160–2167, 1999. [DOI] [PubMed] [Google Scholar]
- 22.Nielsen S, DiGiovanni SR, Christensen EI, Knepper MA, Harris HW. Cellular and Subcellular Immunolocalization of vasopressin-regulated water channel in rat kidney. Proc Natl Acad Sci USA 90: 11663–11667, 1993. [DOI] [PMC free article] [PubMed] [Google Scholar]
- 23.Pitts RF Renal excretion of acid. Fed Proc 7: 418–426, 1948. [PubMed] [Google Scholar]
- 24.Pitts RF The renal metabolism of ammonia. Physiologist 9: 97–109, 1966. [PubMed] [Google Scholar]
- 25.Pitts RF, Lotspeich WD, Schiess WA, Ayer JL, Miner P. The renal regulation of acid-base balance in man. I. The nature of the mechanism for acidifying the urine. J Clin Invest 27: 48–56, 1948. [DOI] [PMC free article] [PubMed] [Google Scholar]
- 26.Plotkin MD, Kaplan MR, Verlander JW, Lee WS, Brown D, Poch E, Gullans SR, Hebert SC. Localization of the thiazide sensitive Na-Cl cotransporter, rTSC1 in the rat kidney. Kidney Int 50: 174–183, 1996. [DOI] [PubMed] [Google Scholar]
- 27.Quentin F, Eladari D, Cheval L, Lopez C, Goossens D, Colin Y, Cartron JP, Paillard M, Chambrey R. RhBG and RhCG, the putative ammonia transporters, are expressed in the same cells in the distal nephron. J Am Soc Nephrol 14: 545–554, 2003. [DOI] [PubMed] [Google Scholar]
- 28.Ripoche P, Bertrand O, Gane P, Birkenmeier C, Colin Y, Cartron JP. Human Rhesus-associated glycoprotein mediates facilitated transport of NH3 into red blood cells. Proc Natl Acad Sci USA 101: 17222–17227, 2004. [DOI] [PMC free article] [PubMed] [Google Scholar]
- 29.Sartorius OW, Roemmelt JC, Pitts RF, Calhoon D, Miner P. The renal regulation of acid-base balance in man. IV. The nature of the renal compensations in ammonium chloride acidosis. J Clin Invest 28: 423–439, 1949. [DOI] [PMC free article] [PubMed] [Google Scholar]
- 30.Seshadri RM, Klein JD, Kozlowski S, Sands JM, Kim YH, Handlogten ME, Verlander JW, Weiner ID. Renal expression of the ammonia transporters, Rhbg and Rhcg, in response to chronic metabolic acidosis. Am J Physiol Renal Physiol 290: F397–F408, 2006. [DOI] [PubMed] [Google Scholar]
- 31.Seshadri RM, Klein JD, Smith T, Sands JM, Handlogten ME, Verlander JW, Weiner ID. Changes in the subcellular distribution of the ammonia transporter, Rhcg, in response to chronic metabolic acidosis. Am J Physiol Renal Physiol 290: F1443–F1452, 2006. [DOI] [PubMed] [Google Scholar]
- 32.Shao X, Somlo S, Igarashi P. Epithelial-specific Cre/lox recombination in the developing kidney and genitourinary tract. Am Soc Nephrol 13: 1837–1846, 2002. [DOI] [PubMed] [Google Scholar]
- 33.Teng-umnuay P, Verlander JW, Yuan W, Tisher CC, Madsen KM. Identification of distinct subpopulations of intercalated cells in the mouse collecting duct. J Am Soc Nephrol 7: 260–274, 1996. [DOI] [PubMed] [Google Scholar]
- 34.Verlander JW, Miller RT, Frank AE, Royaux IE, Kim YH, Weiner ID. Localization of the ammonium transporter proteins, Rh B glycoprotein and Rh C glycoprotein, in the mouse kidney. Am J Physiol Renal Physiol 284: F323–F337, 2003. [DOI] [PubMed] [Google Scholar]
- 35.Wall SM Ammonium transport and the role of the Na,K-ATPase. Miner Electrolyte Metab 22: 311–317, 1996. [PubMed] [Google Scholar]
- 36.Wall SM Ouabain reduces net acid secretion and increases pHi by inhibiting NH4+ uptake on rat tIMCD Na+-K+-ATPase. Am J Physiol Renal Physiol 273: F857–F868, 1997. [DOI] [PubMed] [Google Scholar]
- 37.Wall SM, Fischer MP, Kim GH, Nguyen BM, Hassell KA. In rat inner medullary collecting duct, NH4+ uptake by the Na,K-ATPase is increased during hypokalemia. Am J Physiol Renal Physiol 282: F91–F102, 2002. [DOI] [PubMed] [Google Scholar]
- 38.Wall SM, Koger LM. NH4+ transport mediated by Na+-K+-ATPase in rat inner medullary collecting duct. Am J Physiol Renal Fluid Electrolyte Physiol 267: F660–F670, 1994. [DOI] [PubMed] [Google Scholar]
- 39.Wall SM, Hassell KA, Royaux IE, Green ED, Chang JY, Shipley GL, Verlander JW. Localization of pendrin in mouse kidney. Am J Physiol Renal Physiol 284: F229–F241, 2003. [DOI] [PubMed] [Google Scholar]
- 40.Weiner ID Expression of the non-erythroid Rh glycoproteins in mammalian tissues. Transfus Clin Biol 13: 159–163, 2006. [DOI] [PMC free article] [PubMed] [Google Scholar]
- 41.Weiner ID, Hamm LL. Molecular mechanisms of renal ammonia transport. Annu Rev Physiol 69: 317–340, 2007. [DOI] [PMC free article] [PubMed] [Google Scholar]
- 42.Weiner ID, Miller RT, Verlander JW. Localization of the ammonium transporters, Rh B Glycoprotein and Rh C Glycoprotein in the mouse liver. Gastroenterology 124: 1432–1440, 2003. [DOI] [PubMed] [Google Scholar]
- 43.Weiner ID, Verlander JW. Renal and hepatic expression of the ammonium transporter proteins, Rh B Glycoprotein and Rh C Glycoprotein. Acta Physiol Scand 179: 331–338, 2003. [DOI] [PubMed] [Google Scholar]
- 44.Westhoff CM, Ferreri-Jacobia M, Mak DO, Foskett JK. Identification of the erythrocyte Rh-blood group glycoprotein as a mammalian ammonium transporter. J Biol Chem 277: 12499–12502, 2002. [DOI] [PubMed] [Google Scholar]
- 45.Westhoff CM, Siegel DL, Burd CG, Foskett JK. Mechanism of genetic complementation of ammonium transport in yeast by human erythrocyte Rh-associated glycoprotein (RhAG). J Biol Chem 279: 17443–17448, 2004. [DOI] [PubMed] [Google Scholar]
- 46.Zheng W, Verlander JW, Cash M, Lynch IJ, Weiner ID, Cain BD, Wingo CS. Cellular distribution of the potassium channel KCNQ1 in normal mouse kidney. Am J Physiol Renal Physiol 292: F456–F466, 2007. [DOI] [PubMed] [Google Scholar]


