

Abstract
LPL is an enzyme involved in the breakdown and uptake of lipoprotein triglycerides. In the present study, we examined how the transgenic (Tg) overexpression of human LPL in mouse skeletal muscle affected tolerance to cold temperatures, cold-induced thermogenesis, and fuel utilization during this response. Tg mice and their nontransgenic controls were placed in an environmental chamber and housed in metabolic chambers that monitored oxygen consumption and carbon dioxide production with calorimetry. When exposed to 4°C, an attenuation in the decline in body temperature in Tg mice was accompanied by an increased metabolic rate (15%; P < 0.001) and a reduction in respiratory quotient (P < 0.05). Activity levels, the expression of uncoupling proteins in brown fat and muscle, and lean mass failed to explain the enhanced cold tolerance and thermogenesis in Tg mice. The more oxidative type IIa fibers were favored over the more glycolytic type IIb fibers (P < 0.001) in the gastrocnemius and quadriceps muscles of Tg mice. These data suggest that Tg overexpression of LPL in skeletal muscle increases cold tolerance by enhancing the capacity for fat oxidation, producing an avian-like phenotype in which skeletal muscle contributes significantly to the thermogenic response to cold temperatures.
Keywords: metabolic rate, respiratory quotient, body temperature, fiber-typing, uncoupling proteins, activity, birds
In response to cold temperatures, thermoregulatory centers in the hypothalamus initiate several adaptations that work together to maintain body temperature (1). Among these adaptations is a generalized sympathetic response that redirects blood flow away from the skin and stimulates thermogenesis. Initially, a portion of the thermogenic response involves shivering, but this decreases with the time of cold exposure (2). Nonshivering thermogenesis (NST) then becomes the critical source of internal heat and is thought to occur primarily in brown adipose tissue (BAT), where mitochondrial respiration is uncoupled by uncoupling protein-1 (UCP-1) (3). Both the activity and mass of BAT increase with cold exposure (1), and cold intolerance is exhibited in mice with no BAT (4), no UCP-1 (5), or without the ability to synthesize noradrenaline or adrenaline (6). Given the established role of BAT and UCP-1 in this response, less attention has been given to the importance of other metabolically active tissues that may also be involved. Skeletal muscle, which plays a prominent role in NST in birds (7), may be one such tissue that contributes to this cold response in mammals.
Skeletal muscle accounts for a large portion of body mass (∼40% in males, ∼33% in females) (8) and has the greatest capacity to increase energy expenditure. It is one of several tissues that expresses LPL (EC 3.1.1.34), an enzyme that is involved in the clearance of circulating triglycerides by catalyzing the hydrolysis of the triglyceride core of circulating lipoproteins. Generalized transgenic (Tg) overexpression of LPL in mice results in a reduction of serum triglycerides and an increase in HDL cholesterol (9), whereas extreme hypertriglyceridemia has been observed in humans (10), cats (11, 12), and mice (13) lacking LPL. The discordant regulation of LPL in skeletal muscle and adipose tissue serves to traffic circulating lipids toward oxidation or storage, depending upon the metabolic context (14). In catabolic conditions, such as exercise, fasting, and cold exposure, LPL expression is favored in skeletal muscle to facilitate the delivery of fats to this tissue for oxidation (15). In anabolic conditions, such as occurs after a meal, LPL expression is favored in adipose tissue to facilitate the clearance and storage of the lipid load. Mice with overexpression of LPL in skeletal muscle, like the generalized overexpressors, are hypotriglyceridemic (16, 17) and have alterations in glucose metabolism that are presumably a result of the chronic increase in lipid delivery to this tissue. Some, but not all, studies report that skeletal muscle-specific overexpression leads to impaired glucose tolerance, insulin resistance (18-20), and decreased respiratory quotient (RQ) (19). In mice with progressive overexpression of the muscle lipase, a myopathy associated with mitochondrial and peroxisomal proliferation in the muscle is seen (17). Given the importance of skeletal muscle in whole body fuel metabolism and the critical role of LPL in fuel trafficking, we have pursued a better understanding of the function of skeletal muscle LPL in adapting to metabolic stress.
In our previous studies, we showed that overexpression of skeletal muscle LPL is associated with a modestly leaner phenotype and less accumulation in body weight and fat mass when challenged with a high-fat diet (16). The lack of any compensatory change in food intake has suggested that the altered response was attributable solely to an adjustment in energy expenditure. The small difference in expenditure predicted to induce this modest phenotype, however, is near the detection sensitivity level of current indirect calorimetry systems. For this reason, we used cold exposure to perturb and exaggerate this phenotype to uncover an effect on metabolic rate (MR). This pursuit revealed a novel link between LPL overexpression and increased MR and suggests that the impact of skeletal muscle on NST may depend upon its ability to take up and oxidize fat.
METHODS
Experimental design
Mice were housed in a pathogen-free Tg facility at the University of Colorado at Denver and Health Sciences Center. Animal protocols were approved by the Animal Resource Care Committee. The generation of mice overexpressing human LPL in skeletal muscle was described previously (16). FVB male mice, Tg and littermate controls, at 20–25 weeks of age were used in all experiments. Food intake was determined in mice given ad libitum access to standard rodent chow (Purina) and water while placed in metabolic cages (Metabowl; Jencons Scientific, Bridgeville, PA) in an environmental chamber (Tenny Environmental, Williamsport, PA) for precise control of ambient conditions (temperature and humidity) during a 12 h light (6:00 AM to 6:00 PM) and dark photoperiod. Core body temperatures were measured using a themocoupler inserted 1 cm rectally (YSI 400; Yellow Springs Instrument Co., Yellow Springs, OH). Experiments were also carried out at ambient temperatures spanning the thermoneutrality set point for mice. In these experiments, mice were exposed for 24 h at ambient temperatures ranging from 20°C to 36°C in 4°C increments. Three different cold-exposure conditions were used: 1) ambient temperature of 4°C for 16 h; 2) ambient temperature of 4°C for 4 h on 3 separate days in both the light and day cycles; and 3) ambient temperature of −4°C for 4 h.
Indirect calorimetry measurements
An open-ended indirect calorimetry system was used to measure O2 consumption and CO2 production in mice during exposure to various ambient temperatures. This system has been described previously and validated (21). Briefly, air from a common air source was pulled through four metabolic chambers (Metabowl), a blank cage, and a reference line. The differential measurements of O2 and CO2 compared with the reference line, totaling 3.6 × 10⁵ measurements, were performed continuously every 10 min for each of the cages with the use of a paramagnetic O2 analyzer and infrared CO2 analyzer (Oxymat/Ultramat 6; Siemens, Roswell, GA). The analyzers were calibrated before each experiment with a primary standard of O2 (0.950%) and CO2 (0.770%), with the balance being composed of nitrogen (General Air, Denver, CO). Any small fluctuations in the differential readings were measured in the blank fifth cage and accounted for in the calculations of RQ and MR (Weir equation).
Activity monitoring
During the short-term cold exposure experiments (−4°C for 4 h), the activities of the mice were monitored with the use of Opto-M3 Activity Meters (Columbus Instruments, Columbus, OH) customized to work with the metabolic cages. Using infrared beams, activity was monitored in both the horizontal (x axis) and vertical (z axis) directions. For each of the axes, total and ambulatory (new) beam breaks were detected and analyzed. The activity monitors were validated for each of the cages by correlating the total beam breaks for 10 min with the MR measured over the same period (r = 0.351, P = 0.003, n = 120).
Plasma determinations
After the cold exposure, mice were anesthetized with an intraperitoneal injection of Avertin (2,2,2-tribromoethanol, 32 mg; Aldrich, Milwaukee, WI). Blood was drawn from the inferior vena cava into heparinized tubes for the collection of plasma. Glucose was measured using the Analox GM7 (Analox Instruments USA, Lunenburg, MA). Plasma triglycerides were measured using an enzymatic, colorimetric assay (Sigma, St. Louis, MO). Plasma FFAs were measured enzymatically with a colorimetric end point. Tissues were collected and immediately assayed for heparin-releasable lipoprotein lipase as described below.
Lipoprotein lipase assay
Heparin-releasable LPL from all tissues was assayed as described previously (22). Briefly, tissues were minced in cold Krebs-Ringer-Phosphate buffer to ∼2–4 mm3 pieces, and bundles of pieces weighing 40–50 mg were incubated in duplicate in a shaking 37°C water bath for 45 min in 0.4 ml of Krebs-Ringer-Phosphate buffer (pH 7.4) with 15 μg/ml heparin (H-19; Fisher Scientific, Fair Lawn, NJ). For muscle, the hind limb, including the gastrocnemius and the soleus, was visually separated and minced for samples of red and white skeletal muscle, respectively. A 100 μl aliquot was removed and incubated with 100 μl of a [14C]triolein phosphatidylcholine-stabilized substrate. After an additional 45 min of incubation at 37°C, the reaction was solubilized, and 14C-fatty acids were partitioned according to the method of Belfrage and Vaughn (23). A 500 μl aliquot of the resulting aqueous supernatant was counted by β-scintillation (LS6000TA; Beckman). [14C]oleic acid was used to control for extraction efficiency. LPL activity was expressed as nanomoles of FFA per minute per gram of tissue.
Skeletal muscle immunohistochemistry and fiber cross-sectional area
Skeletal muscles (gastrocnemius and quadriceps whole muscles) were dissected from Tg and littermate nontransgenic (nTg) mice housed at 25°C, embedded in Tissue-Tek, and snap-frozen in liquid nitrogen-cooled isopentane. Frozen sections (8 μm) were cut and stained with antibodies specific for each myosin heavy-chain isoform. The antibodies used were as follows: anti-MyHC-I (1:50 dilution; Novocastra Laboratories NCL-MHCs); MyHC-IIa (undiluted, prepared from hybridoma SC-71 deposited in the American Type Culture Collection by S. Schiaffino); MyHC-IIb [1:2 dilution, from hybridoma BF-F3 (American Type Culture Collection, S. Schiaffino)]; anti-laminin (Sigma L9393); goat anti-mouse IgG-FITC (1:100 dilution; Jackson ImmunoResearch 115-095-071); goat anti-mouse IgM-Texas Red (1:100 dilution; Jackson ImmunoResearch 115-095-075), and anti-rabbit FITC (Jackson ImmunoResearch 711-075-152). Fluorescence microscopy images were taken with a Zeiss microscope equipped with digital image capture, and fiber area was analyzed using NIH Image software.
Statistics
Data were analyzed using SigmaStat for Windows 2.03 (Jandel Scientific Software, San Rafael, CA). For the 4 h, 4°C over 3 days and the 16 h, 4°C experiments, percent relative cumulative frequency (PRCF) curves were generated based on a previous publication by Riachi, Himms-Hagen, and Harper (24). This powerful technique is useful for condensing large data sets (>1,200 points) into easily interpreted curves. Briefly, MR data (kcal/day/g) for both nTg and Tg mice were sorted, and frequency, cumulative frequency, and PRCF were determined over a specified interval. Equations for the resulting curves were fitted to the following equation using curve-fitting software (NCSS; NCSS, Kaysville, UT; www.ncss.com):
where y = PRCF, x = MR, H = slope, and EC50 = 50th percentile value for MR. The resulting 50th percentile values for MR for nTg and Tg mice were compared using t-tests. For the thermoneutrality and cold exposure (4 h, −4°C) experiments, a two-way repeated-measures ANOVA with one factor repetition was used. The variables Time and Genotype (nTg vs. Tg) and the interaction (Time × Genotype) were included in the model. A Tukey test was used for multiple comparisons. For plasma measurements, t-tests were used to compare differences among groups. When data were not normally distributed, nonparametric tests were used. P < 0.05 was considered statistically significant. All data are presented as means ± SEM.
RESULTS
Initial evidence that Tg mice were cold-tolerant arose from placing mice individually in plexiglass cages in a cold room at 4°C. Tg mice were able to maintain their body temperature significantly better than control mice (P < 0.05) (Fig. 1). After 30 min, unbiased observers were able to visually distinguish between nTg and Tg mice, as Tg mice seemed to be unaffected by the cold exposure (i.e., maintained normal activity). At 90 min, the core body temperatures of control mice began to diverge from baseline levels and those of Tg mice. After 150 min of cold exposure, Tg mice maintained their body temperatures and had significantly higher body temperatures than control mice by nearly 5°C (P < 0.05). Furthermore, two control mice were removed from the experiment after 2 h and were unable to withstand the cold exposure. To follow up on this initial observation, experiments using an indirect calorimetry system and an environmental chamber were implemented.
Fig. 1.
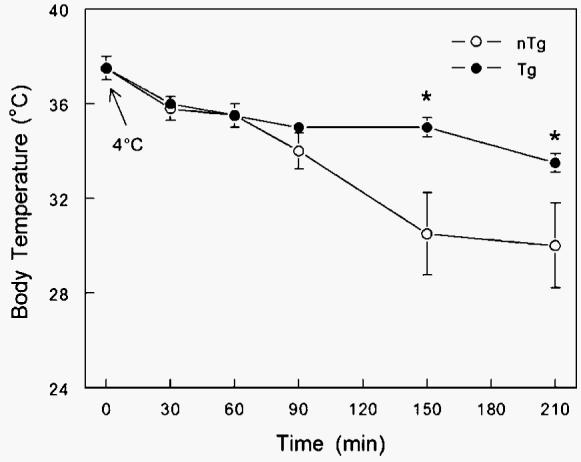
Effect of cold exposure (4°C for 4 h) on body temperature (°C) of transgenic (Tg; n = 8) male mice overexpressing skeletal muscle lipoprotein lipase and littermate controls [nontransgenic (nTg); n = 6] individually placed in plexiglass cages in a cold room. Tg mice were able to maintain their body temperature significantly better that control mice (* P < 0.05). After 30 min, unbiased observers were able to visually distinguish between nTg and Tg mice, as Tg mice seemed to be visually unaffected by the cold exposure. Data are presented as means ± SEM.
In the first set of experiments, mice were cold-exposed at 4°C for 4 h on 3 separate days during both the light and dark cycles. In these experiments, the MRs of Tg mice were not different from those of nTg mice during the first bout of cold exposure, but on subsequent bouts they had higher MRs (Fig. 2A). The increased MR of Tg mice observed during the cold exposure was observed in both the light and dark cycles of the photoperiod. Conversely, the MRs of nTg mice were unaltered after each of the three cold-exposure bouts. When the PRCF curves were analyzed (see Methods for details) for the entire data set, consisting of 2,022 and 2,799 measurements of MR for nTg and Tg mice, respectively, the Tg mice had significantly higher MRs at the 50th percentile compared with the nTg mice (0.560 vs. 0.533; P < 0.0001) (Fig. 2B).
Fig. 2.
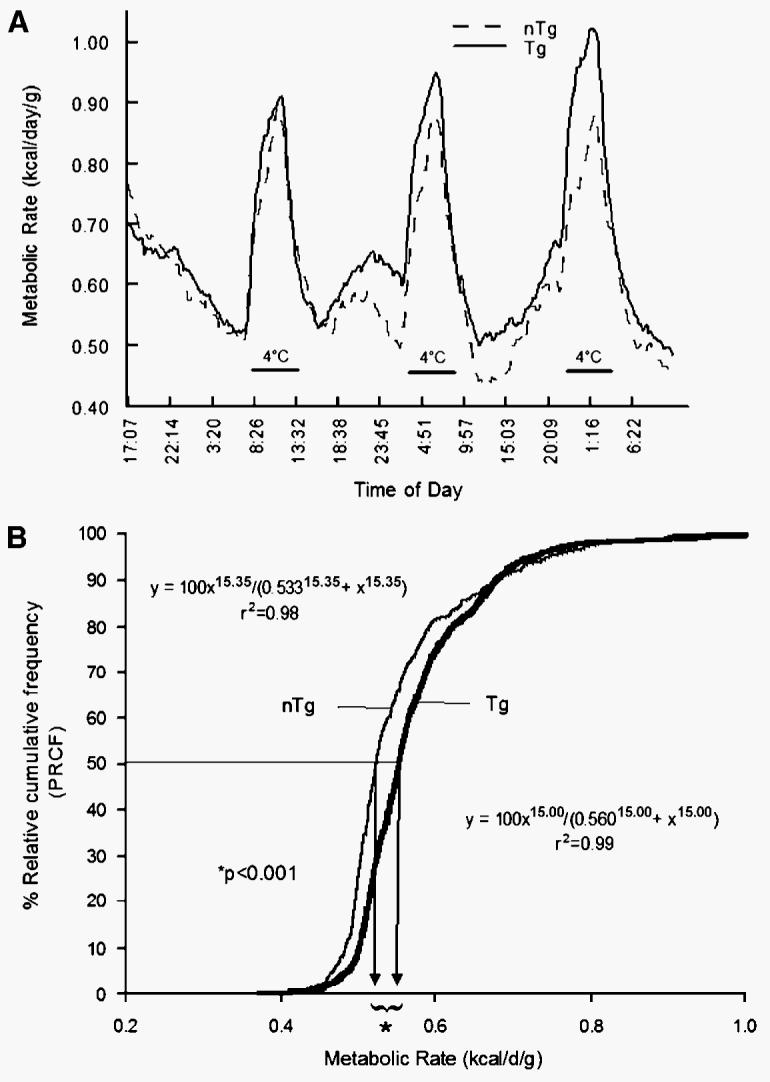
A: Effect of cold exposure (4°C for 4 h on 3 separate days) on metabolic rate (MR; kcal/day/g body weight) of Tg (n = 9) male mice overexpressing skeletal muscle lipoprotein lipase and littermate controls (nTg; n = 7). B: Percent relative cumulative frequency (PRCF) curves (see Methods for details) of MRs for Tg mice and nTg mice. Tg mice had a significantly higher MR at the 50th percentile compared with the nTg mice (0.560 vs. 0.533 kcal/day/g; P < 0.0001).
In the second set of experiments, mice were cold-exposed for 16 h at 4°C. In response to the cold exposure, the MRs of both nTg and Tg mice increased rapidly over the first 2 h of the experiments (Fig. 3A). After this time point, Tg mice were able to consistently maintain a higher MR compared with the MR of nTg mice. When the entire data set was analyzed by graphing the PRCF curves (Fig. 3B), Tg mice had a significantly higher MR at the 50th percentile (0.941 vs. 0.909 kcal/day/g; P < 0.0001). To better understand the potential mechanisms whereby Tg mice were able to increase their MRs in response to cold exposure, the experimental paradigm was shortened to a 4 h cold exposure at −4°C.
Fig. 3.
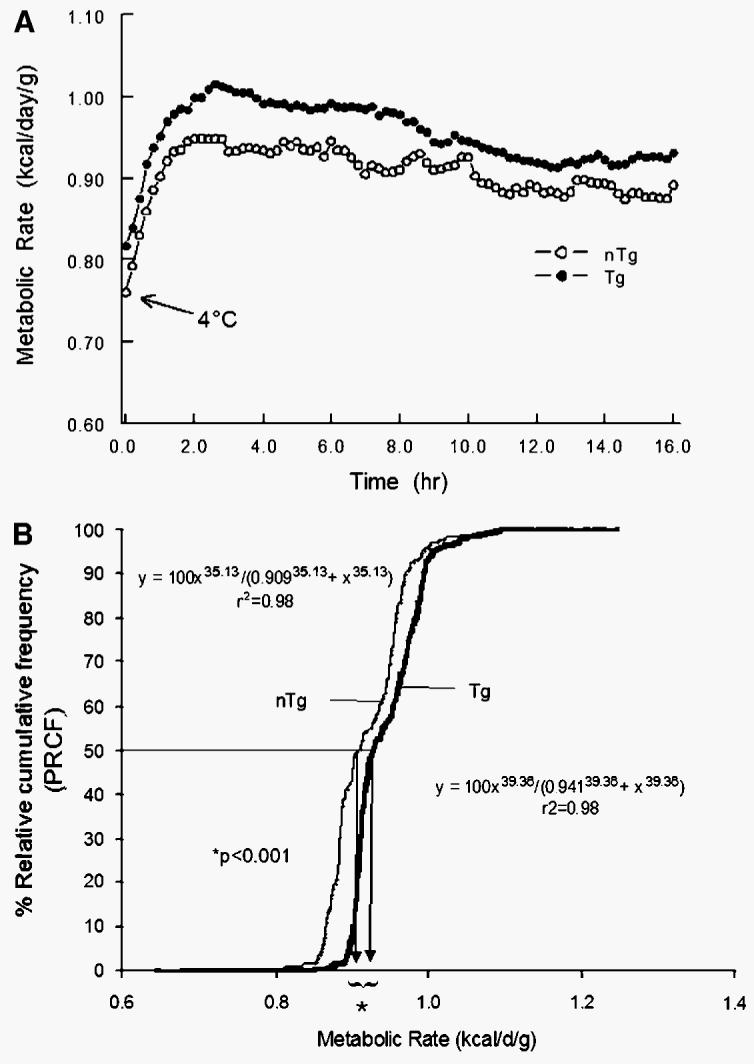
A: Effect of cold exposure (4°C for 16 h) on MR (kcal/day/g body weight) of Tg (n = 9) male mice overexpressing skeletal muscle lipoprotein lipase and littermate controls (nTg; n = 7). In response to the cold exposure, the MRs of both nTg and Tg mice increased rapidly over the first 2 h of the experiments. After this time point, Tg mice were able to consistently maintain a higher MR compared with the MR of nTg mice. B: PRCF curves (see Methods for details) of MRs for Tg and nTg mice. When the entire data set was analyzed, Tg mice had a significantly higher MR at the 50th percentile (0.941 vs. 0.909 kcal/day/g; P < 0.0001).
As in previous experiments, the MRs of both groups of mice increased rapidly in response to the cold exposure (Fig. 4A). However, after 60 min, in contrast to the nTg mice, Tg mice continued to increase their MR and reached a plateau at 120 min. Overall, Tg mice had a significantly higher MR compared with that of nTg mice by ∼15% (P < 0.001) throughout the remainder of the cold exposure. In mice that were housed for 4 h at an ambient temperature of 25°C in the calorimeter, MRs were not different between nTg and Tg mice (Fig. 4A, inset). RQ was calculated over the same interval and graphed in Fig. 4B. RQs in the Tg mice generally decreased at the beginning and reached a plateau toward the end of the cold exposure; in contrast, the RQs of nTg mice increased throughout the same period (Fig. 4B). At 60 min, the RQs of the Tg and nTg mice began to diverge from one another, with the Tg mice having overall lower RQs compared with the RQs of nTg mice (P < 0.05). In response to the cold exposure, nTg mice significantly increased their food intake over the 4 h cold exposure by nearly 2-fold (0.67 ± 0.09 g vs. 1.20 ± 0.08 g, respectively; P < 0.05). On the other hand, there were no detectable differences in food consumption in the Tg mice at 25°C compared with −4°C (1.01 ± 0.09 g vs. 0.92 ± 0.13 g, respectively). There were no significant differences in 4 h food consumption between nTg and Tg mice at either temperature (P > 0.07, by Tukey test), which was consistent with previously reported food consumption over 14 weeks in nTg and Tg mice on synthetic diets (16). To determine the ambient temperature at which the FVB strain of mice would exhibit the lowest MR (thermoneutrality zone), indirect calorimetry was performed in mice exposed for 24 h to ambient conditions from 20°C to 40°C at increments for 4°C. For both nTg and Tg mice, MR decreased significantly from 20°C to 32°C (P < 0.001; data not shown) and reached a nadir from 32°C to 36°C, at which point MR tended to increase at 40°C in both groups. Moreover, throughout the range of ambient temperatures (20°C to 40°C), there were no detectable differences in MR between nTg and Tg mice.
Fig. 4.
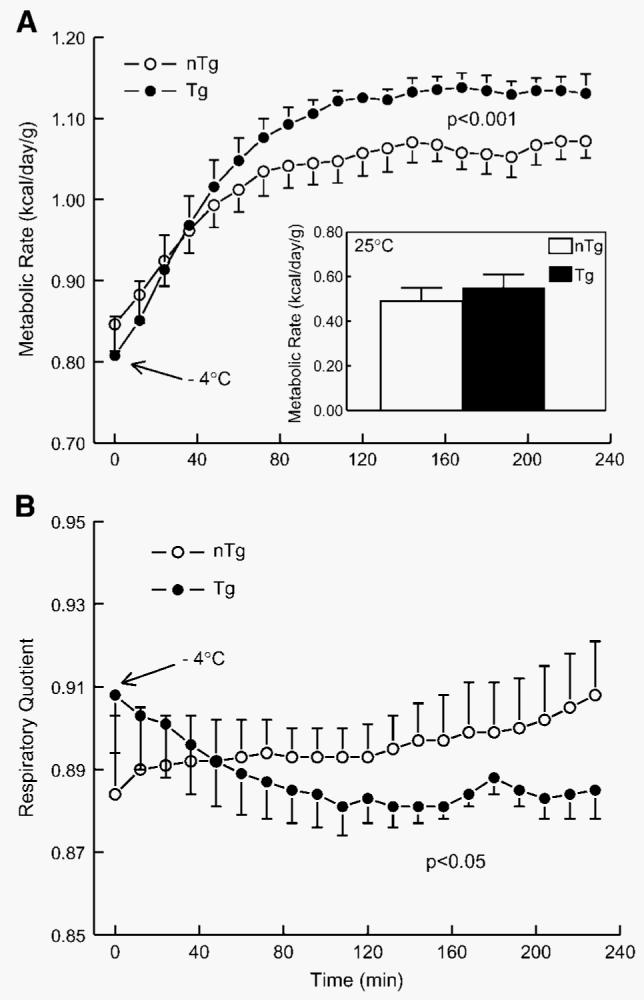
A: Effect of cold exposure (−4°C for 4 h) on MR (kcal/day/g body weight) of Tg (n = 6) male mice overexpressing skeletal muscle lipoprotein lipase and littermate controls (nTg; n = 6). At 60 min, in contrast to the nTg mice, Tg mice continued to increase their MR and reached a plateau at 120 min. Tg mice had a significantly higher MR compared with that of nTg mice by ∼15% (P < 0.001) throughout the remainder of the cold exposure. In mice that were housed for 4 h at an ambient temperature of 25°C in the calorimeter, MRs were not different between nTg and Tg mice (inset). B: Effect of cold exposure (−4°C for 4 h) on respiratory quotient (RQ) of Tg male mice overexpressing skeletal muscle lipoprotein lipase and littermate controls (nTg). RQs in the Tg mice generally decreased at the beginning and reached a plateau toward the end of the cold exposure; in contrast, the RQs of nTg mice increased throughout the same period. At 60 min, the RQs of the Tg and nTg mice began to diverge from one another, with the Tg mice having overall lower RQs compared with the RQs of nTg mice (P < 0.05). Data are presented as means ± SEM.
To determine whether the increase in MR observed in the cold-exposed Tg mice was attributable to increased physical activity, an activity monitoring system using infrared beams (Columbus Instruments) was used. Total and ambulatory (new) beam breaks in both the x (lateral motion) and z (rearing motion) axes are presented in Fig. 5. The activity monitors were validated for each of the cages by correlating the total beam breaks for 10 min with MR measured over the same period (r = 0.351, P = 0.003, n = 120; data not shown). For each measurement of activity, there were no statistical differences detected between nTg and Tg mice during the cold bout.
Fig. 5.
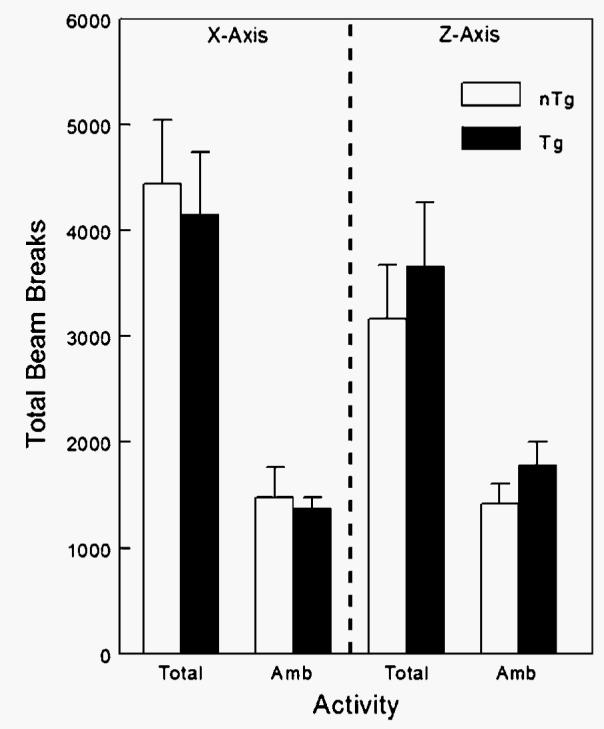
Effect of cold exposure (−4°C for 4 h) on the activity of Tg male mice overexpressing skeletal muscle lipoprotein lipase and littermate controls (nTg). An activity monitoring system using infrared beams (Columbus Instruments) was used, and total and ambulatory (Amb; new) beam breaks in both the x (lateral motion) and z (rearing motion) axes were measured. Activity monitors were validated for each of the cages by correlating the total beam breaks for 10 min with MR measured over the same period (r = 0.351, P = 0.003, n = 120; data not shown). For each measurement of activity, there were no statistical differences detected between nTg and Tg mice (n = 4/group) during the cold bout. Data are presented as means ± SEM.
To uncover a potential mechanism for the increased MR of Tg mice during cold exposure, UCP-1 and UCP-3 mRNA levels for BAT and skeletal muscle, respectively, were measured in nTg and Tg mice (Fig. 6). In response to the cold exposure, overall levels of UCP-1 mRNA in BAT were increased by nearly 50% (P = 0.003) (Fig. 6A). There were no observed differences in UCP-1 mRNA levels between Tg and nTg mice at either ambient temperature. UCP-1 mRNA levels were not altered in BAT of Tg mice in response to the cold. UCP-3 mRNA levels in quadriceps muscles were increased significantly overall by cold exposure (P = 0.002) (Fig. 6B). At 25°C, Tg mice were observed to have a significant decrease in UCP-3 levels compared with nTg mice (P < 0.05). Moreover, in response to cold exposure at 4°C, Tg mice had significant increases in UCP-3 levels in skeletal muscle (P < 0.05). nTg mice did not have detectable changes in UCP-3 mRNA levels in response to cold exposure.
Fig. 6.
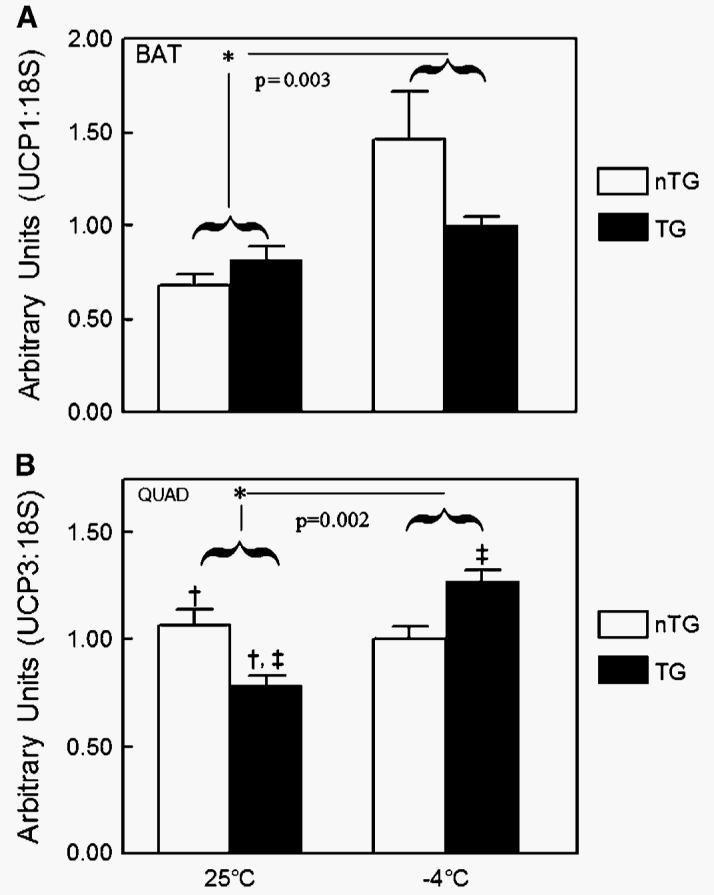
A: Effect of ambient temperature (−4°C or 25°C for 4 h) on uncoupling protein-1 (UCP-1) mRNA in brown adipose tissue (BAT) of Tg (n = 6) male mice overexpressing skeletal muscle lipoprotein lipase and littermate controls (nTg; n = 6). Overall levels of UCP-1 mRNA in BAT were increased by nearly 50% in mice exposed to −4°C for 4 h compared with 25°C (* P = 0.003) when analyzed by two-way ANOVA with genotype, temperature, and the interaction in the model. There were no observed differences in UCP-1 mRNA levels between Tg and nTg mice at either ambient temperature. UCP-1 mRNA levels were not altered in BAT of Tg mice in response to the cold bout. B: Effect of ambient temperature (−4°C or 25°C for 4 h) on UCP-3 mRNA in skeletal muscle tissue of Tg (n = 6) male mice overexpressing skeletal muscle lipoprotein lipase and littermate controls (nTg; n = 6). UCP-3 mRNA levels in the quadriceps (QUAD) muscle were increased significantly overall by cold exposure (* P = 0.002) when analyzed by two-way ANOVA with genotype, temperature, and the interaction in the model. At 25°C, Tg mice were observed to have a significant decrease in UCP-3 levels compared with nTg mice († P < 0.05). Moreover, in response to cold exposure at 4°C, Tg mice had significant increases in UCP-3 levels in skeletal muscle (‡ P < 0.05). nTg mice did not have detectable changes in UCP-3 mRNA levels in response to cold exposure. Data are presented as means ± SEM.
Body composition, plasma measurements, and heparin-releasable LPL activities in nTg and Tg mice after ambient exposures of 4 h at either 25°C or −4°C are presented in Table 1. Body composition, including body weight (g), lean mass (g), bone mass (g), and fat mass (g and %) were not different between the two groups of mice when fed a chow diet at ambient temperatures of 25°C or −4°C. As expected, plasma triglyceride was lower in the Tg mice at 25°C than in the nTg mice (P = 0.02). After cold exposure at −4°C, plasma triglyceride decreased to a nadir in both groups, with no differences detected between groups. Plasma glucose (mmol/l) and free fatty acids (mmol/l) were similar between nTg and Tg mice at both 25°C and −4°C ambient temperatures. Tissue-specific regulation of LPL was evident in white adipose tissue (WAT) and BAT in cold-exposed mice. In WAT, heparin-releasable LPL activity was decreased in both nTg and Tg mice in response to cold exposure (P < 0.01). Conversely, LPL activity in BAT was increased significantly in both nTg and Tg mice by ∼2-fold (P = 0.01). For both WAT and BAT, LPL activity was not different between the groups of mice at the same ambient temperature. Skeletal muscle LPL activity was increased significantly by 8-fold in Tg mice, as expected and reported previously (16), but no effect of cold exposure was observed.
TABLE 1.
Body composition, plasma measurements, and heparin-releasable LPL activities in nTg and Tg mice after ambient exposures of 4 h at either 25°C or −4°C
| Ambient Temperature |
|||||
|---|---|---|---|---|---|
| 25°C |
−4°C |
||||
| Variable | nTg (n = 8) | Tg (n = 7) | nTg (n = 10) | Tg (n = 10) | |
| Body composition | |||||
| Body weight (g) | 28.0 ± 0.6 | 26.2 ± 1.2 | 28.8 ± 0.9 | 28.1 ± 0.7 | |
| Lean mass (g) | 22.3 ± 0.5 | 21.2 ± 1.1 | 23.2 ± 0.4 | 22.8 ± 0.5 | |
| Bone mass (g) | 0.57 ± 0.03 | 0.58 ± 0.03 | 0.59 ± 0.01 | 0.56 ± 0.01 | |
| Fat mass (g) | 3.6 ± 0.2 | 3.1 ± 0.1 | 3.6 ± 0.5 | 3.7 ± 0.5 | |
| Fat mass (%) | 14.0 ± 0.8 | 12.9 ± 0.6 | 13.3 ± 1.4 | 13.8 ± 1.3 | |
| Plasma measurements | |||||
| Triglyceride (mg/dl) | 86 ± 21 | 56 ± 11a | 30 ± 3b | 31 ± 4 | |
| FFA (mmol/l) | 0.73 ± 19 | 0.67 ± 0.18 | 0.78 ± 0.13 | 0.73 ± 0.11 | |
| Glucose (mmol/l) | 13.0 ± 0.5 | 13.0 ± 0.6 | 13.9 ± 0.9 | 13.9 ± 0.3 | |
| Heparin-releasable LPL activity | (n = 4) | (n = 4) | (n = 6) | (n = 6) | |
| White adipose (nmol FFA/min/g) | 19.1 ± 1.5 | 39.2 ± 12.0a | 13.2 ± 2.7b | 12.8 ± 2.8b | |
| Brown adipose (nmol FFA/min/g) | 495 ± 72 | 485 ± 169 | 978 ± 152b | 1095 ± 138b | |
| Skeletal muscle (nmol FFA/min/g) | 8.6 ± 0.3 | 60.9 ± 2.8a | 25.1 ± 12.5 | 66.5 ± 13.4a | |
nTg, nontransgenic; Tg, transgenic.
P < 0.05 for nTg versus Tg at the same ambient temperature.
P < 0.05 for 25°C versus −4°C for like genotypes.
To determine whether the overexpression of LPL altered the distribution of fiber types in skeletal muscle, type IIa and IIb fibers were quantified by immunohistochemistry. As is seen in Fig. 7A, an increased proportion of type IIa fibers (stained green) was apparent in gastrocnemius and quadriceps muscles from Tg mice. Type IIb fibers (stained red) were decreased noticeably in both muscles of Tg mice compared with the muscles of nTg mice. When quantified, the percentage of type IIa fibers were increased significantly in the gastrocnemius muscle of Tg mice compared with nTg mice (14.5 ± 02.0 vs. 4.5 ± 0.9; P < 0.001), whereas type IIb glycolytic fibers were decreased significantly in Tg mice (75.4 ± 2.2 vs. 92.1 ± 1.1; P < 0.001). Similar significant differences (P < 0.001) were also observed in the quadriceps muscle of Tg mice (Fig. 7C).
Fig. 7.
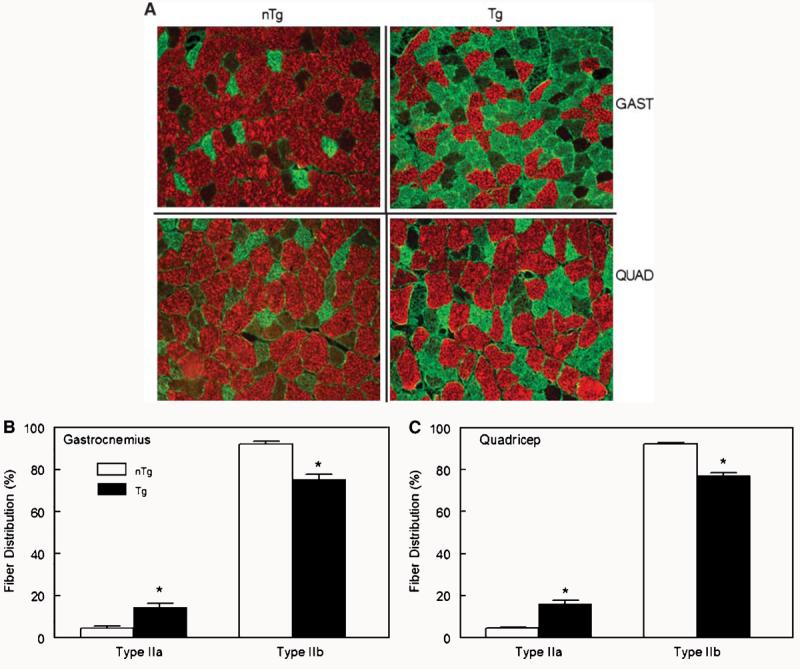
A: Effect of the overexpression of lipoprotein lipase on the distribution of type IIa and IIb fibers visualized by immunohistochemistry in gastrocnemius (GAST) and quadriceps (QUAD) muscle of Tg and littermate controls (nTg) male mice. The increased proportion of type IIa fibers (stained green) was visibly apparent in gastrocnemius and quadriceps muscles from Tg mice. Type IIb fibers (stained red) were noticeably decreased in both muscles of Tg mice compared with the muscles of nTg mice. B, C: Quantification of immunohistochemistry showing the effect of the overexpression of lipoprotein lipase on the distribution of type IIa and IIb fibers in gastrocnemius (B) and quadriceps (C) muscles of Tg and littermate controls (nTg) male mice. The percentage of type IIa fibers was increased significantly in the gastrocnemius muscle of Tg mice compared with nTg mice (14.5 ± 02.0 vs. 4.5 ± 0.9; P < 0.001), whereas type IIb glycolytic fibers were decreased significantly in Tg mice (75.4 ± 2.2 vs. 92.1 ± 1.1; P < 0.001, n = 8/group). Similar significant differences (* P < 0.001) were also observed in the quadriceps muscle of Tg mice. Data are presented as means ± SEM.
DISCUSSION
In this study, we report a novel role of skeletal muscle LPL in the thermoregulation of mice during cold exposure. Cold-exposed Tg mice under several experimental paradigms were able to maintain body temperature and increase their MR compared with nTg mice. Furthermore, after 60 min of the cold exposure at 4°C for 4 h, RQ decreased significantly in Tg mice, indicating increased lipid oxidation in these mice. These changes in MR and RQ could not be explained by alterations in UCP-1 mRNA in BAT, physical activity, or food intake. Tg expression of LPL in skeletal muscle led to a significant increase in the type of muscle fibers that have a greater capacity to oxidize fat. This combination of increased LPL and oxidative myofibril profile primes skeletal muscle to play a greater role in the thermogenic response to cold exposure. The most obvious explanation for this enhanced tolerance to the cold is that the increased uptake of fat and ability to oxidize fat provides greater flexibility in the utilization of fuels and a consequential enhancement in adaptation to metabolic stress, such as extended exposure to cold temperatures.
One aspect of the adaptation to cold exposure is the tissue-specific regulation of LPL. Several studies have shown that cold exposure increases LPL activity in the heart and BAT tissue (25-27). It has also been shown in piglets exposed to the cold that skeletal muscle LPL activity was increased by 71%, whereas WAT LPL activity was decreased by 51% (28). These tissue-specific alterations of LPL would serve to direct lipoprotein-derived fatty acids away from storage in WAT to oxidative tissue that could generate heat for the maintenance of body temperature. The adaptations would not likely involve cardiac and skeletal muscle if these tissues were not important for the thermogenic response to the cold. In the present study, skeletal muscle LPL expression was already increased in TG mice before cold exposure, such that LPL activity was more than twice as high as that achieved by cold temperatures in wild-type animals. This normal adaptation to the cold, therefore, was already present in Tg mice and may have facilitated the delivery of fatty acids from lipoproteins to muscle, where it could be used for thermogenesis.
In addition to the enhanced skeletal muscle LPL, acclimatization to the cold is also accompanied by a shift toward more oxidative muscle fibers. Chicks adapted to cold (4°C) soon after hatching had morphological, histological, and gene expression changes that are consistent with an increase in slow-twitch fibers in the quadriceps muscle (29) compared with chicks housed at thermoneutrality (35°C). Similar finding were also observed in the gastrocnemius muscle of cold-acclimated Muscovy ducklings (30). Other investigators have shown that LPL is increased in slow-twitch oxidative muscles (heart, diaphragm, and soleus) in cold-acclimated rats (31). This enhanced oxidative capacity would provide the ability to oxidize the greater amount of fat delivery to skeletal muscle that results from cold-induced LPL activity. In the present study, this adaptation appeared to be in place in Tg mice before cold exposure, suggesting that this adaptation in muscle morphology may be linked directly to LPL overexpression. It is unclear whether enhanced LPL expression and its delivery of circulating lipids is an independent contribution to the improved tolerance to cold. To answer this question, similar studies with an inducible promoter that could increase LPL activity acutely without the time required for a change in myofiber profile would need to be performed. Regardless, these observations provide evidence for an important role of skeletal muscle LPL in the thermogenic response to the cold in mice.
Because of the focus on BAT in thermogenesis, skeletal muscle has not been viewed as an important contributor to the metabolic adaptation to cold temperatures in mammals. However, there is growing evidence that skeletal muscle may play a greater role than was previously thought, and this role may be dependent upon fuel preference and the type of muscle fibers recruited (32). For example, birds do not have BAT and use skeletal muscle as the primary site for shivering and NST (7). As has been shown in BAT of cold-exposed mammals, FFAs can be used not only for substrate in thermogenesis but also as an uncoupler in mitochondria in avian skeletal muscle (33). Barre et al. (33, 34) presented evidence in chronic glucagon-treated ducklings, in which lipolysis is induced (34), and in cold-acclimated ducklings (33) that FFAs had an important uncoupling role in both muscle and liver mitochondria. These authors also showed that cytochrome oxidase and creatine kinase activities were increased significantly in muscle mitochondria from glucagon-treated ducklings. Furthermore, it was also shown in cold-acclimated ducklings that nearly 70% of cold-induced NST occurred in skeletal muscle, with increases in blood flow to skeletal muscle but in the absence of shivering thermogenesis (33). This evidence in birds, which have no BAT, suggests that skeletal muscle in mammals is capable of a substantial thermogenic response to the cold. Furthermore, these data suggest that the role of mammalian skeletal muscle in this thermogenic response may depend upon the level of LPL expression and/or oxidative capacity.
Further evidence for this dependence on LPL expression and/or oxidative capacity comes from our observations that cold exposure induced UCP-3 expression only in Tg mice. Our studies of UCP expression in nTg mice are consistent with other mammalian studies that show little or no induction of skeletal muscle UCP-3 (35-37), whereas the induction of UCP-3 in Tg mice is more reflective of what has been observed in the highly oxidative, high-LPL-expressing muscles of birds. The UCP homolog in hummingbirds (hmUCP), with high homology to UCP-1, UCP-2, and UCP-3 (55, 70, and 72%, respectively), is induced in response to the daily bout of torpor and is thought to facilitate the rewarming phase (38). Avian UCP (avUCP), originally identified in skeletal muscle of chickens (55, 70, and 70% homology to mammalian UCP-1, UCP-2, and UCP-3, respectively) (39), has also been shown to be induced in skeletal muscle of both king penguins and broiler chickens in response to cold exposure (40, 41). Moreover, when avUCP was activated by retinoic acid, avUCP exhibited thermogenic properties much like UCP-1 in mammals (35). Although these data indicate that skeletal muscle hmUCP and avUCP may play a role in the thermogenic response to cold temperatures, some questions remain regarding whether it functions as a true uncoupler of oxidative phosphorylation or in the prevention of oxygen free radicals that would be expected to accumulate during a period of high energy flux. In transfected yeast mitochondria (42) and skeletal muscle mitochondria of chickens (43), avUCP prevented reactive oxygen species generation, similar to the role now ascribed to UCP3 both in rodent skeletal muscle (44) and in muscle cells in vitro (45). Regardless of the exact function of UCPs in skeletal muscle, their induction appears to be an important part of the adaptation when skeletal muscle contributes significantly to the thermogenic response.
In conclusion, the overexpression of LPL in skeletal muscle shifted the muscle fiber type profile away from the glycolytic type IIb and toward the more oxidative type IIa and dramatically increased the tolerance to cold temperatures. This increased tolerance to the cold appeared to be linked to an enhanced thermogenic response and an increased capacity to oxidize fat. This modification of skeletal muscle, as a result of the tissue-specific overexpression of LPL, increases the importance of this tissue in the thermogenic response to the cold. Furthermore, the phenotypic response to this metabolic stress may be very similar to that observed in birds. Although it is clear that more studies are required to elucidate the mechanistic details of the response, including the role of the induced UCP-3 expression, these observations have revealed a role for skeletal muscle in the mammalian response to cold temperatures that may be dependent upon the expression of LPL and/or oxidative capacity.
Acknowledgments
The authors thank Jennifer Yoon and Jeff Mitchell for their technical assistance. This work was supported by National Institutes of Health Grants GM-29090 to L.A.L. and DK-26356 to R.H.E.
Abbreviations
- BAT
brown adipose tissue
- MR
metabolic rate
- NST
nonshivering thermogenesis
- nTg
nontransgenic
- PRCF
percent relative cumulative frequency
- RQ
respiratory quotient
- Tg
transgenic
- UCP-1
uncoupling protein-1
- WAT
white adipose tissue.
REFERENCES
- 1.Cannon B, Nedergaard J. Brown adipose tissue: function and physiological significance. Physiol. Rev. 2004;84:277–359. doi: 10.1152/physrev.00015.2003. [DOI] [PubMed] [Google Scholar]
- 2.Griggio MA. Thermogenic mechanisms in cold-acclimated animals. Braz. J. Med. Biol. Res. 1988;21:171–176. [PubMed] [Google Scholar]
- 3.Golozoubova V, Hohtola E, Matthias A, Jacobsson A, Cannon B, Nedergaard J. Only UCP1 can mediate adaptive non-shivering thermogenesis in the cold. FASEB J. 2001;15:2048–2050. doi: 10.1096/fj.00-0536fje. [DOI] [PubMed] [Google Scholar]
- 4.Lowell BB, Susulic V, Hamann A, Lawitts JA, Himms-Hagen J, Boyer BB, Kozak LP, Flier JS. Development of obesity in transgenic mice after genetic ablation of brown adipose tissue. Nature. 1993;366:740–742. doi: 10.1038/366740a0. [DOI] [PubMed] [Google Scholar]
- 5.Hofmann WE, Liu X, Bearden CM, Harper ME, Kozak LP. Effects of genetic background on thermoregulation and fatty acid-induced uncoupling of mitochondria in UCP1-deficient mice. J. Biol. Chem. 2001;276:12460–12465. doi: 10.1074/jbc.M100466200. [DOI] [PubMed] [Google Scholar]
- 6.Thomas SA, Palmiter RD. Thermoregulatory and metabolic phenotypes of mice lacking noradrenaline and adrenaline. Nature. 1997;387:94–97. doi: 10.1038/387094a0. [DOI] [PubMed] [Google Scholar]
- 7.Bicudo JE, Vianna CR, Chaui-Berlinck JG. Thermogenesis in birds. Biosci. Rep. 2001;21:181–188. doi: 10.1023/a:1013648208428. [DOI] [PubMed] [Google Scholar]
- 8.Lee RC, Wang Z, Heo M, Ross R, Janssen I, Heymsfield SB. Total-body skeletal muscle mass: development and cross-validation of anthropometric prediction models. Am. J. Clin. Nutr. 2000;72:796–803. doi: 10.1093/ajcn/72.3.796. [DOI] [PubMed] [Google Scholar]
- 9.Shimada M, Shimano H, Gotoda T, Yamamoto K, Kawamura M, Inaba T, Yazaki Y, Yamada N. Overexpression of human lipoprotein lipase in transgenic mice. Resistance to diet-induced hypertriglyceridemia and hypercholesterolemia. J. Biol. Chem. 1993;268:17924–17929. [PubMed] [Google Scholar]
- 10.Brunzell JD, Iverius PH, Scheibel MS, Fujimoto WY, Hayden MR, McLeod R, Frolich J. Primary lipoprotein lipase deficiency. Adv. Exp. Med. Biol. 1986;201:227–239. doi: 10.1007/978-1-4684-1262-8_20. [DOI] [PubMed] [Google Scholar]
- 11.Ginzinger DG, Clee SM, Dallongeville J, Lewis ME, Henderson HE, Bauje E, Rogers QR, Jensen DR, Eckel RH, Dyer R, et al. Lipid and lipoprotein analysis of cats with lipoprotein lipase deficiency. Eur. J. Clin. Invest. 1999;29:17–26. doi: 10.1046/j.1365-2362.1999.00435.x. [DOI] [PubMed] [Google Scholar]
- 12.Peritz LN, Brunzell JD, Harvey-Clarke C, Pritchard PH, Jones BR, Hayden MR. Characterization of a lipoprotein lipase class III type defect in hypertriglyceridemic cats. Clin. Invest. Med. 1990;13:259–263. [PubMed] [Google Scholar]
- 13.Weinstock PH, Bisgaier CL, Aalto-Setala K, Radner H, Ramakrishnan R, Levak-Frank S, Essenburg AD, Zechner R, Breslow JL. Severe hypertriglyceridemia, reduced high density lipoprotein, and neonatal death in lipoprotein lipase knockout mice. Mild hypertriglyceridemia with impaired very low density lipoprotein clearance in heterozygotes. J. Clin. Invest. 1995;96:2555–2568. doi: 10.1172/JCI118319. [DOI] [PMC free article] [PubMed] [Google Scholar]
- 14.Greenwood MR. The relationship of enzyme activity to feeding behavior in rats: lipoprotein lipase as the metabolic gatekeeper. Int. J. Obes. 1985;9(Suppl 1):67–70. [PubMed] [Google Scholar]
- 15.Preiss-Landl K, Zimmermann R, Hammerle G, Zechner R. Lipoprotein lipase: the regulation of tissue specific expression and its role in lipid and energy metabolism. Curr. Opin. Lipidol. 2002;13:471–481. doi: 10.1097/00041433-200210000-00002. [DOI] [PubMed] [Google Scholar]
- 16.Jensen DR, Schlaepfer IR, Morin CL, Pennington DS, Marcell T, Ammon SM, Gutierrez-Hartmann A, Eckel RH. Prevention of diet-induced obesity in transgenic mice overexpressing skeletal muscle lipoprotein lipase. Am. J. Physiol. 1997;273:R683–R689. doi: 10.1152/ajpregu.1997.273.2.R683. [DOI] [PubMed] [Google Scholar]
- 17.Levak-Frank S, Radner H, Walsh A, Stollberger R, Knipping G, Hoefler G, Sattler W, Weinstock PH, Breslow JL, Zechner R. Muscle-specific overexpression of lipoprotein lipase causes a severe myopathy characterized by proliferation of mitochondria and peroxisomes in transgenic mice. J. Clin. Invest. 1995;96:976–986. doi: 10.1172/JCI118145. [DOI] [PMC free article] [PubMed] [Google Scholar]
- 18.Voshol PJ, Jong MC, Dahlmans VE, Kratky D, Levak-Frank S, Zechner R, Romijn JA, Havekes LM. In muscle-specific lipoprotein lipase-overexpressing mice, muscle triglyceride content is increased without inhibition of insulin-stimulated whole-body and muscle-specific glucose uptake. Diabetes. 2001;50:2585–2590. doi: 10.2337/diabetes.50.11.2585. [DOI] [PubMed] [Google Scholar]
- 19.Ferreira LD, Pulawa LK, Jensen DR, Eckel RH. Overexpressing human lipoprotein lipase in mouse skeletal muscle is associated with insulin resistance. Diabetes. 2001;50:1064–1068. doi: 10.2337/diabetes.50.5.1064. [DOI] [PubMed] [Google Scholar]
- 20.Kim JK, Fillmore JJ, Chen Y, Yu C, Moore IK, Pypaert M, Lutz EP, Kako Y, Velez-Carrasco W, Goldberg IJ, et al. Tissue-specific overexpression of lipoprotein lipase causes tissue-specific insulin resistance. Proc. Natl. Acad. Sci. USA. 2001;98:7522–7527. doi: 10.1073/pnas.121164498. [DOI] [PMC free article] [PubMed] [Google Scholar]
- 21.Jensen DR, Gayles EC, Ammon S, Phillips R, Eckel RH. A self-correcting indirect calorimeter system for the measurement of energy balance in small animals. J. Appl. Physiol. 2001;90:912–918. doi: 10.1152/jappl.2001.90.3.912. [DOI] [PubMed] [Google Scholar]
- 22.Eckel RH, Kern PA, Sadur CN, Yost TJ. Methods for studying lipoprotein lipase in human adipose tissue. In: Pohl SL, Clarke WL, Larner J, editors. Methods in Diabetes Research. Wiley; New York: 1986. pp. 259–273. [Google Scholar]
- 23.Belfrage P, Vaughn M. Simple liquid-liquid partition system for isolation of labeled oleic acid from mixtures with glycerides. J. Lipid Res. 1969;10:341–344. [PubMed] [Google Scholar]
- 24.Riachi M, Himms-Hagen J, Harper ME. Percent relative cumulative frequency analysis in indirect calorimetry: application to studies of transgenic mice. Can. J. Physiol. Pharmacol. 2004;82:1075–1083. doi: 10.1139/y04-117. [DOI] [PubMed] [Google Scholar]
- 25.Rogers MP, Robinson DS. Effects of cold exposure on heart clearing factor lipase and triglyceride utilization in the rat. J. Lipid Res. 1974;15:263–272. [PubMed] [Google Scholar]
- 26.Bertin R, Goubern M, Portet R. Effects of diets and cold acclimation on lipoprotein lipase activity and cyclic nucleotide levels in some tissues of rats. Experientia Suppl. 1978;32:185–190. doi: 10.1007/978-3-0348-5559-4_20. [DOI] [PubMed] [Google Scholar]
- 27.Radomski MW, Orme T. Response of lipoprotein lipase in various tissues to cold exposure. Am. J. Physiol. 1971;220:1852–1856. doi: 10.1152/ajplegacy.1971.220.6.1852. [DOI] [PubMed] [Google Scholar]
- 28.Herpin P, Bertin R, Le Dividich J, Portet R. Some regulatory aspects of thermogenesis in cold-exposed piglets. Comp. Biochem. Physiol. A. 1987;87:1073–1081. doi: 10.1016/0300-9629(87)90042-9. [DOI] [PubMed] [Google Scholar]
- 29.Hirabayashi M, Ijiri D, Kamei Y, Tajima A, Kanai Y. Transformation of skeletal muscle from fast- to flow-twitch during acquisition of cold tolerance in the chick. Endocrinology. 2005;146:399–405. doi: 10.1210/en.2004-0723. [DOI] [PubMed] [Google Scholar]
- 30.Duchamp C, Cohen-Adad F, Rouanet JL, Barre H. Histochemical arguments for muscular non-shivering thermogenesis in Muscovy ducklings. J. Physiol. 1992;457:27–45. doi: 10.1113/jphysiol.1992.sp019363. [DOI] [PMC free article] [PubMed] [Google Scholar]
- 31.Begin-Heick N, Heick HM. Increased lipoprotein lipase activity of skeletal muscle in cold-acclimated rats. Can. J. Biochem. 1977;55:1241–1243. doi: 10.1139/o77-186. [DOI] [PubMed] [Google Scholar]
- 32.Haman F. Shivering in the cold: from mechanisms of fuel selection to survival. J. Appl. Physiol. 2006;100:1702–1708. doi: 10.1152/japplphysiol.01088.2005. [DOI] [PubMed] [Google Scholar]
- 33.Barre H, Nedergaard J, Cannon B. Increased respiration in skeletal muscle mitochondria from cold-acclimated ducklings: uncoupling effects of free fatty acids. Comp. Biochem. Physiol. B. 1986;85:343–348. doi: 10.1016/0305-0491(86)90010-6. [DOI] [PubMed] [Google Scholar]
- 34.Barre H, Berne G, Brebion P, Cohen-Adad F, Rouanet JL. Loose-coupled mitochondria in chronic glucagon-treated hyperthermic ducklings. Am. J. Physiol. 1989;256:R1192–R1199. doi: 10.1152/ajpregu.1989.256.6.R1192. [DOI] [PubMed] [Google Scholar]
- 35.Criscuolo F, Mozo J, Hurtaud C, Nubel T, Bouillaud F. UCP2, UCP3, avUCP, what do they do when proton transport is not stimulated? Possible relevance to pyruvate and glutamine metabolism. Biochim. Biophys. Acta. 2006;1757:1284–1291. doi: 10.1016/j.bbabio.2006.06.002. [DOI] [PubMed] [Google Scholar]
- 36.Cannon B, Shabalina IG, Kramarova TV, Petrovic N, Nedergaard J. Uncoupling proteins: a role in protection against reactive oxygen species—or not? Biochim. Biophys. Acta. 2006;1757:449–458. doi: 10.1016/j.bbabio.2006.05.016. [DOI] [PubMed] [Google Scholar]
- 37.Bezaire V, Seifert EL, Harper ME. Uncoupling protein-3: clues in an ongoing mitochondrial mystery. FASEB J. 2007;21:312–324. doi: 10.1096/fj.06-6966rev. [DOI] [PubMed] [Google Scholar]
- 38.Vianna CR, Hagen T, Zhang CY, Bachman E, Boss O, Gereben B, Moriscot AS, Lowell BB, Bicudo JE, Bianco AC. Cloning and functional characterization of an uncoupling protein homolog in hummingbirds. Physiol. Genomics. 2001;5:137–145. doi: 10.1152/physiolgenomics.2001.5.3.137. [DOI] [PubMed] [Google Scholar]
- 39.Raimbault S, Dridi S, Denjean F, Lachuer J, Couplan E, Bouillaud F, Bordas A, Duchamp C, Taouis M, Ricquier D. An uncoupling protein homologue putatively involved in facultative muscle thermogenesis in birds. Biochem. J. 2001;353:441–444. doi: 10.1042/0264-6021:3530441. [DOI] [PMC free article] [PubMed] [Google Scholar]
- 40.Talbot DA, Duchamp C, Rey B, Hanuise N, Rouanet JL, Sibille B, Brand MD. Uncoupling protein and ATP/ADP carrier increase mitochondrial proton conductance after cold adaptation of king penguins. J. Physiol. 2004;558:123–135. doi: 10.1113/jphysiol.2004.063768. [DOI] [PMC free article] [PubMed] [Google Scholar]
- 41.Collin A, Buyse J, van As P, Darras VM, Malheiros RD, Moraes VM, Reyns GE, Taouis M, Decuypere E. Cold-induced enhancement of avian uncoupling protein expression, heat production, and triiodothyronine concentrations in broiler chicks. Gen. Comp. Endocrinol. 2003;130:70–77. doi: 10.1016/s0016-6480(02)00571-3. [DOI] [PubMed] [Google Scholar]
- 42.Criscuolo F, Gonzalez-Barroso MM, Le Maho Y, Ricquier D, Bouillaud F. Avian uncoupling protein expressed in yeast mitochondria prevents endogenous free radical damage. Proc. Biol. Sci. 2005;272:803–810. doi: 10.1098/rspb.2004.3044. [DOI] [PMC free article] [PubMed] [Google Scholar]
- 43.Abe T, Mujahid A, Sato K, Akiba Y, Toyomizu M. Possible role of avian uncoupling protein in down-regulating mitochondrial superoxide production in skeletal muscle of fasted chickens. FEBS Lett. 2006;580:4815–4822. doi: 10.1016/j.febslet.2006.07.070. [DOI] [PubMed] [Google Scholar]
- 44.Schrauwen P, Hesselink M. UCP2 and UCP3 in muscle controlling body metabolism. J. Exp. Biol. 2002;205:2275–2285. doi: 10.1242/jeb.205.15.2275. [DOI] [PubMed] [Google Scholar]
- 45.MacLellan JD, Gerrits MF, Gowing A, Smith PJ, Wheeler MB, Harper ME. Physiological increases in uncoupling protein 3 augment fatty acid oxidation and decrease reactive oxygen species production without uncoupling respiration in muscle cells. Diabetes. 2005;54:2343–2350. doi: 10.2337/diabetes.54.8.2343. [DOI] [PubMed] [Google Scholar]