Abstract
Geometric remodeling of the left ventricle (LV) after myocardial infarction is associated with changes in myocardial wall stress. The objective of this study was to determine the regional curvatures and wall stress based on three-dimensional (3-D) reconstructions of the LV using MRI. Ten patients with ischemic dilated cardiomyopathy (IDCM) and 10 normal subjects underwent MRI scan. The IDCM patients also underwent delayed gadolinium-enhancement imaging to delineate the extent of myocardial infarct. Regional curvedness, local radii of curvature, and wall thickness were calculated. The percent curvedness change between end diastole and end systole was also calculated. In normal heart, a short- and long-axis two-dimensional analysis showed a 41 ± 11% and 45 ± 12% increase of the mean of peak systolic wall stress between basal and apical sections, respectively. However, 3-D analysis showed no significant difference in peak systolic wall stress from basal and apical sections (P = 0.298, ANOVA). LV shape differed between IDCM patients and normal subjects in several ways: LV shape was more spherical (sphericity index = 0.62 ± 0.08 vs. 0.52 ± 0.06, P < 0.05), curvedness at end diastole (mean for 16 segments = 0.034 ± 0.0056 vs. 0.040 ± 0.0071 mm−1, P < 0.001) and end systole (mean for 16 segments = 0.037 ± 0.0068 vs. 0.067 ± 0.020 mm−1, P < 0.001) was affected by infarction, and peak systolic wall stress was significantly increased at each segment in IDCM patients. The 3-D quantification of regional wall stress by cardiac MRI provides more precise evaluation of cardiac mechanics. Identification of regional curvedness and wall stresses helps delineate the mechanisms of LV remodeling in IDCM and may help guide therapeutic LV restoration.
Keywords: three-dimensional modeling, left ventricle, curvature, cine magnetic resonance imaging, human heart
ischemic dilated cardiomyopathy (IDCM) is a degenerative disease of the myocardial tissue accompanied by left ventricular (LV) remodeling (34). LV remodeling is a multistep process that involves acute dilation of the infarcted area, increase of LV volume, lengthening of the LV perimeter, and decrease of LV curvature (10, 42). Natural history studies show that progressive LV remodeling is directly related to future deterioration of LV performance and a poor clinical course (20).
The elevation of LV wall stress in IDCM is associated with morphological changes in the myocardium that may cause regional hypokinesis (20–22). LV wall stress is in part determined by the local curvature of the ventricular wall; i.e., decreased curvature will increase wall stress (23). In addition to increasing LV size, IDCM can alter myocardial properties and normal LV shape curvature. The border zone will have a higher stress, which makes it more susceptible to ischemia and infarction and may accelerate the remodeling process (44). Therefore, therapeutic approaches for IDCM include LV size reduction to disrupt the downward-spiral cycle of heart failure (12).
The geometry of the LV in IDCM is complicated, and a three-dimensional (3-D) approach is necessary to characterize the ventricular mechanics of contractility and regional shape changes throughout the cardiac cycle. Many studies have shown that MRI is a better and more comprehensive approach to quantify 3-D ventricular structure and function (5, 28) than echocardiography (17), ventriculography (16, 48), angiography (40), and indicator-dilution (11) methods.
End-systolic wall stress is governed by the systolic pressure of the LV and a geometric factor of the shape of the LV (19, 23, 47). Several mathematical models have been used to calculate wall stress (47). Some approaches are limited by geometric assumptions and are only valid for spherical or ellipsoidal shapes and, hence, only allow calculation of global wall stress. Other approaches are applicable to any arbitrary shape of the LV (23) but have some errors in the measurement of the thickness of the LV wall and of the radius of curvature (6). The technical limitations of these methods do not permit precise regional measurements of 3-D wall curvature.
In this study, we aim to 1) assess the regional variations of LV shape in 3-D (i.e., in terms of surface curvedness), 2) assess the 3-D regional variations of wall stress (by incorporation of wall curvature), and 3) determine the relationship between peak systolic wall stress and the regional extent of myocardial infarct.
Glossary
- IDCM
Ischemic dilated cardiomyopathy
- dσ*/dtmax
LV contractility index [1.5 × (dV/dtmax)/Vm]
- EDVI
Indexed end-diastolic volume
- ESVI
Indexed end-systolic volume
- HR
Heart rate
- SI
Sphericity index
- C
Curvedness
- CED
Curvedness at end diastole
- CES
Curvedness at end systole
- ΔC
Percent curvedness change
- T
Wall thickness
- R
Wall radius
- WS
Wall stress
- WS
Wall thickening
- EDT
End-diastolic wall thickness
- EST
End-systolic wall thickness
- 2DSR
2-D radius in the short-axis plane
- 2DST
2-D wall thickness in the short-axis plane
- 2DSWS
Wall stress in the short-axis plane
- 2DSWT
Wall thickening in the short-axis plane
- 2DLR
2-D radius in the long-axis plane
- 2DLT
2-D wall thickness in the long-axis plane
- 2DLWS
Wall stress in the long-axis plane
- 2DLWT
Wall thickening in the long-axis plane
- 3DR
3-D radius accounting for 3-D curvature
- 3DT
3-D wall thickness accounting for 3-D curvature
- 3DWS
3-D wall stress
- 3DWT
3-D wall thickening
METHODS
Subjects.
Ten normal subjects and 10 patients with IDCM participated in the study. All subjects underwent diagnostic MRI scan. None of the normal subjects had 1) significant valvular or congenital cardiac disease, 2) history of myocardial infarction, 3) coronary artery lesions, or 4) abnormal LV pressure, end-diastolic volume, or ejection fraction. All subjects were recruited without consideration of gender or ethnicity and gave informed consent. The study was approved by the Human Subjects Review Committee of the National Heart Centre, Singapore.
MRI scans.
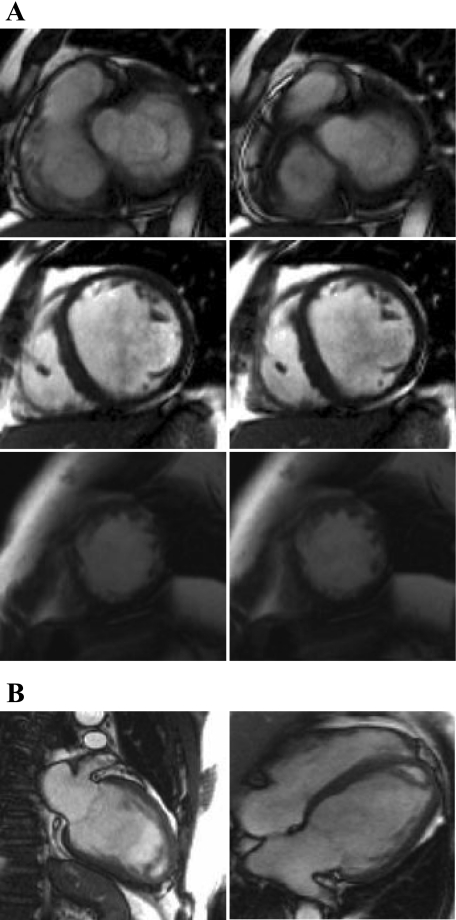
MRI scanning was performed using steady-state free precession cine gradient echo sequences. Subjects were imaged on a 1.5-T scanner (Avanto, Siemens Medical Solutions, Erlangen, Germany). Some preliminary short-axis acquisitions were used to locate the plane passing through the mitral and aortic valves. This allowed the acquisition of the oblique long-axis plane of the LV, which is orthogonal to the short-axis plane and passes through the mitral valve, apex, and aortic valve. In addition, the corresponding vertical long-axis planes (connecting the short-axis plane images) were acquired. TrueFISP (fast imaging with steady-state precession) magnetic resonance pulse sequence with segmented k-space and retrospective electrocardiographic gating was used to acquire a parallel stack of two-dimensional (2-D) cine images of the LV in the short-axis plane, from LV base to apex (8-mm interslice thickness, no interslice gap). The field of view was typically 320 mm with in-plane spatial resolution of <1.5 mm. Each slice was acquired in a single breath hold, with 25 temporal phases per heart cycle. Figure 1 depicts the magnetic resonance short- and long-axis plane or image during end diastole and end systole. The average duration of entire image acquisition period was 30 min. The short- and long-axis views (or planes) derived from the MRI were utilized to carry out 3-D LV reconstruction (at end diastole and end systole) using customized software (see Data processing and LV geometry reconstruction).
Fig. 1.
Sample segmented TrueFISP 2-dimensional (2-D) cine MRIs of short-axis slices (A) acquired at the base (top), middle (middle), and apex (bottom) and long-axis slices (B) of left ventricle (LV) in end-diastolic (left) and end-systolic (right) phases.
Delayed gadolinium-enhancement imaging.
For evaluation of myocardial viability, 10 to 15 contiguous short-axis views were acquired with 2-D MRI. Standard extracellular magnetic resonance contrast agents were injected (0.2 mmol gadolinium/kg iv, gadoterate dimeglumine; Schering, Berlin, Germany). All images were acquired during end-expiratory breath holds at 5–15 min after injection. T1 weighting was achieved with an inversion-recovery fast low-angle shot (IR-FLASH) pulse sequence. Typical parameters were as follows: TE = 2 ms, TR = 6 ms, and voxel size = 1 × 1 × 6 mm, with 300-ms inversion delay and k-space data segmented over four cardiac cycles (32 lines per cycle) and data acquired every cardiac cycle. Images were acquired at middiastole during breath hold (8 s).
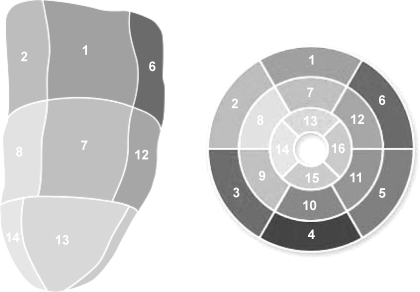
Using commercially available image analysis software (Syngo 3D, Siemens Medical Solution), one author (R.-S. Tan, with more than 10 years of experience in cardiac magnetic imaging) designated the regions of interest in the viable myocardium (dark) and in the nonviable myocardium (highly enhanced) for each image frame in the short-axis cine DE series. The thickness of the hyperenhancement was planimetered on all short-axis images from base to apex. Each 3-D reconstructed LV model was divided into 16 segments (see Fig. 4, Tables 2–4). The myocardial contrast in each of these segments was quantified in terms of scar scores. A scar extent score was assigned to each region as follows: 0 = no scarring, 1 = 1–25% scarring, 2 = 26–50% scarring, 3 = 51–75% scarring, 4 = 76–99% scarring, and 5 = 100% scarring.
Fig. 4.
Standardized myocardial segmentation (see Tables 2–4 for segment identification).
Data processing and LV geometry reconstruction.
The MRI data were processed using a semiautomatic technique provided in the CMRtools suite (CVIS, London, UK). Short- and long-axis images were displayed simultaneously, such that segmentation in the two planes proceeded interactively to reduce registration errors (35). For each phase, every control point on the endocardium was constrained to lie on the intersection of the short- and long-axis views.
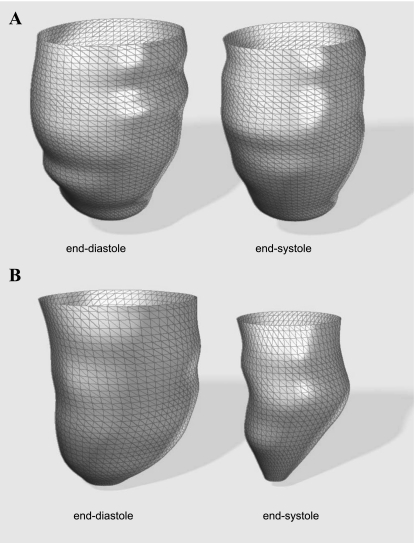
The construction of long-axis planes (orthogonal to the short-axis planes oriented at regular angular intervals) enabled the fitting of a series of B-spline curves to represent the contours of the endocardial surface. This allowed the addition or manipulation of control points to obtain the desired boundary locations. The papillary muscles and trabeculae were included in the chamber volume to obtain smooth endocardial contours suitable for shape analysis. The 3-D reconstructions of a typical IDCM and normal LV during end-diastolic and end-systolic phases are shown in Fig. 2.
Fig. 2.
Three-dimensional (3-D) reconstruction of LV endocardial surface at end diastole and end systole for an ischemic dilated cardiomyopathy (IDCM) patient (A) and a normal subject (B).
From the reconstructed LV, the chamber volume, wall mass, stroke volumes, and EF were determined. A six-order polynomial function was then used to curve fit the volume-time data to determine the volume rate (dV/dt). The contractility index (dσ*/dtmax) was calculated using the following formula: 1.5 × (dV/dtmax)/Vm, where Vm is myocardial volume at the end-diastolic phase, as previously reported (49). Global LV shape was assessed by calculation of the sphericity index (SI) in diastole using the following formula: SI = AP/BA, where BA was measured in the four-chamber view from the apex to the midpoint of the mitral valve and AP was measured as the axis that perpendicularly intersects the midpoint of the long axis. A small SI value implies an ellipsoidal LV, whereas values approaching 1 suggest a more spherical LV.
Computation of 3-D surface shape descriptors.
Software developed in-house was used to reconstruct the LV endocardial meshes at end diastole and end systole as well as to calculate the surface shape descriptors, expressed in terms of local normal curvature and curvedness. The formulations for these descriptors are shown in appendix a.
To evaluate the shape at a particular point on the mesh, a local surface geometry was fitted to the region. The normal curvature at that point is then calculated as
 |
(1) |
where λ = dv/du, such that u and v are the parameters of the underlying geometry, and {E, F, G} and {L, M, N} are components of the first and second fundamental forms, respectively.
The extreme values κ1 and κ2 of κ(λ) are the maximum and minimum principal curvatures, respectively, and they are obtained from the roots of the equation
 |
(2) |
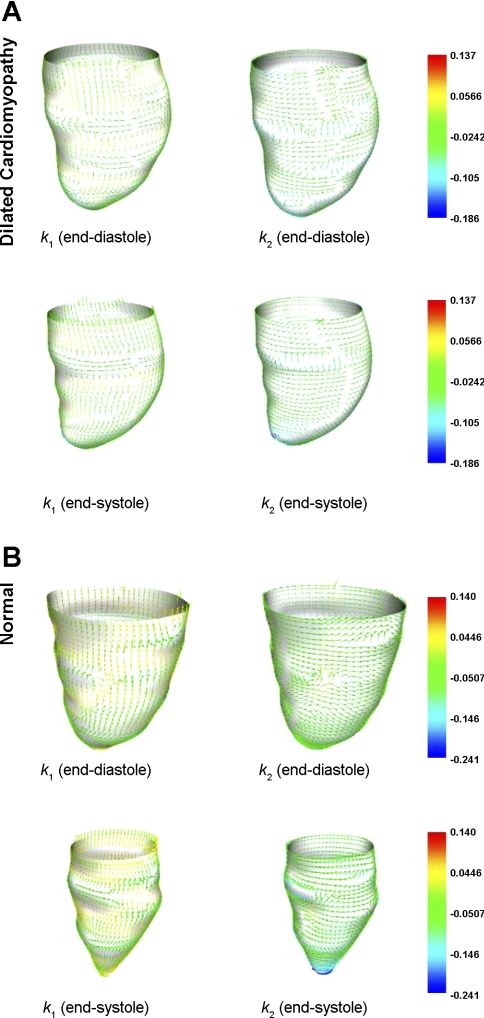
The corresponding directions of κ1 and κ2 are the principal directions and are orthogonal to each other. Figure 3 presents typical principal curvature on the endocardial wall of the LV in IDCM and normal hearts.
Fig. 3.
Principal curvature analysis on LV endocardial wall. Arrowheads represent directions of maximum (left) and minimum (right) principal curvature of the endocardial surface of IDCM patients (A) and normal subjects (B).
A shape descriptor is characterized in terms of the curvedness value (C), as presented by Koenderink and Van Doorn (25). It is a measure of the degree of regional curvature and is defined as
 |
(3) |
The value of C indicates the magnitude of the curvedness at a point, which is a measure of the extent to which a region deviates from flatness. A normal LV will exhibit a larger value of C.
The percent curvedness change (ΔC) between the end-diastolic and end-systolic phase is defined as
 |
(4) |
where CED and CES represent curvedness at the end-diastolic and end-systolic phase, respectively. Positive values of ΔC indicate LV wall regions of increasing curvature during systole; negative values of ΔC indicate wall regions of decreasing curvature.
Regional wall thickening.
In addition to the evaluation of curvature measures on each point of the surface mesh, the LV radius (R) and wall thickness (T) were deduced from the 3-D geometry of the LV. The steps of the computation of wall radius-to-curvature and thickness are summarized in appendix b. The wall thickening (WT) is expressed at each segment by the following formula
 |
(5) |
where EST and EDT are wall thickness at end systole and end diastole, respectively.
Regional peak systolic wall stress.
The wall stress is obtained by the equilibrium of forces due to stresses in the wall and blood pressure acting on the wall. Following Grossman et al. (19), the regional peak systolic wall stress (WS) was determined from the inner radius of curvature (R) and T at end systole by
 |
(6) |
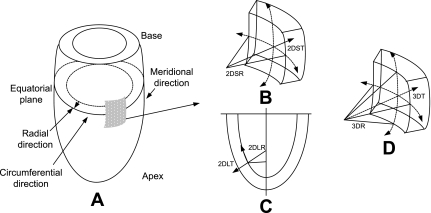
where SP is the peak systolic ventricular blood pressure (in mmHg). In this study, SP was assessed from the systolic noninvasive blood pressure (37a); a conversion factor of 0.133 was used to express the final results in 1,000 N/m2. WS was calculated using R and T values derived with the 3-D curvature method described above. WS was determined using Eq. 6 and as illustrated in Fig. B1 in the circumferential and longitudinal (or meridional) regions in 2-D as 2DSWS and 2DLWS and for a 3-D element with radius that is the inverse of curvature (computed from Eq. 3).
Fig. B1.
A: LV geometry. B: schematics of 2DSR (cavity radius) and 2DST (wall thickness) in short-axis plane. C: schematics of 2DLR and 2DLT in long-axis plane. D: schematics of 3DR and 3DT accounting for 3-D curvature.
To determine regional LV properties of curvedness, wall stress, and wall thickening, the LV was divided into a 16-segment model (8) from apex to base (Fig. 4).
Statistical analysis.
LV volume, function, SI, and curvedness data were compared between IDCM patients and normal subjects using a t-test. 2-D short-axis plane, long-axis plane, and 3-D evaluations of wall stress were compared using ANOVA. If there was a significant interaction (P < 0.05) between multiple measurements, selected pairwise comparisons were examined further. The difference in curvedness, wall stress, and wall thickening among various zones was assessed by ANOVA. Statistical significance for comparison of regional LV systolic wall stress between IDCM patients and normal subjects was determined using a two-tailed Student's t-test. A similar analysis was made for wall thickening calculated in the 2-D short-axis plane, 2-D long-axis plane, and direction of the 3-D curvature. Bivariate correlation was performed between curvedness difference, wall stress, and wall thickening and extent of myocardial infarction using Spearman's correlation coefficient. Values are means ± SD, and significance was defined as P < 0.05.
RESULTS
Global LV function.
The hemodynamic and volumetric parameters of the subjects are summarized in Table 1. The cardiac contractility index dσ*/dtmax and LV ejection fraction (LVEF) were significantly lower in IDCM patients than normal subjects. In addition, LV end-diastolic and end-systolic volumes were greater in IDCM patients than normal subjects. By visual inspection, the LV has a broader apex in IDCM patients than normal subjects. The increase in dilated volume in the LV with IDCM was accompanied by a corresponding increase in sphericity. Consequently, the LV was significantly more spherical in IDCM patients than normal subjects.
Table 1.
Characteristics of normal subjects and IDCM patients
| Normal (n = 10) | IDCM (n = 10) | P | |
|---|---|---|---|
| Age, yr | 39±17 | 52±9 | 0.05 |
| Weight, kg | 67±15 | 71±16 | 0.57 |
| Height, cm | 169±8 | 164±8 | 0.18 |
| Diastolic pressure, mmHg | 73±12 | 70±9 | 0.54 |
| Systolic pressure, mmHg | 122±17 | 113±12 | 0.19 |
| HR, beats/min | 70±9 | 81±18 | 0.10 |
| CI, ml/m2 | 3.3±0.4 | 2.3±0.4 | <0.001 |
| EDVI, ml/m2 | 73±10 | 144±27 | <0.001 |
| ESVI, ml/m2 | 26±6 | 114±32 | <0.001 |
| EF, % | 65±5 | 22±9 | <0.001 |
| SI | 0.52±0.06 | 0.62±0.08 | <0.05 |
| dσ*/dtmax, s−1 | 5.7±1.3 | 2.4±0.9 | <0.001 |
Values are means ± SD. IDCM, ischemic dilated cardiomyopathy; HR, heart rate; CI, cardiac index; EDVI, end-diastolic volume index; ESVI, end-systolic volume index; EF, ejection fraction; SI, sphericity index; dσ*/dtmax, cardiac contractility index (=1.5 × (dV/dtmax)/Vm, where dV/dtmax is maximum volume rate and Vm is myocardial volume).
Variation of curvedness, peak systolic wall stress, and wall thickening from base to apex in normal subjects.
Calculated regional values for curvedness at end diastole and end systole in normal subjects and IDCM patients are summarized in Table 2. In general, normal hearts demonstrated the following regional differences: curvedness is highest at the apex and higher in the inferior regions than in the lateral region (among the 4 circumferential zones), especially at end diastole. In IDCM patients, curvedness was highest at the apex, whereas there was no significant difference among the six circumferential zones. Similar to normal subjects, the gradient from base to apex was significant (P < 0.001, ANOVA).
Table 2.
LV regional curvedness analysis in normal subjects and IDCM patients
| Segment |
Normal (n = 10) |
IDCM (n = 10)
|
||||
|---|---|---|---|---|---|---|
| CED, mm−1 | CES, mm−1 | ΔC, % | CED, mm−1 | CES, mm−1 | ΔC, % | |
| 1. Basal anterior | 0.040±0.0098 | 0.054±0.0064 | 25±21 | 0.031±0.0073* | 0.036±0.0079‡ | 12±13 |
| 2. Basal anterior septal | 0.037±0.0058 | 0.058±0.010 | 33±13 | 0.032±0.0064* | 0.034±0.0063‡ | 8±7‡ |
| 3. Basal inferior septal | 0.030±0.0036 | 0.047±0.0062 | 36±7 | 0.030±0.0084 | 0.033±0.0096† | 8±17‡ |
| 4. Basal inferior | 0.038±0.0053 | 0.056±0.0079 | 31±10 | 0.032±0.0074* | 0.036±0.011‡ | 8±17† |
| 5. Basal inferior lateral | 0.035±0.0040 | 0.055±0.0096 | 36±8 | 0.031±0.0070 | 0.033±0.0079† | 5±15‡ |
| 6. Basal anterior lateral | 0.036±0.0063 | 0.050±0.0065 | 27±16 | 0.031±0.0057 | 0.035±0.0062‡ | 8±16* |
| 7. Middle anterior | 0.034±0.0035 | 0.057±0.010 | 39±10 | 0.029±0.0054* | 0.032±0.0056‡ | 6±12‡ |
| 8. Middle anterior septal | 0.043±0.0057 | 0.070±0.016 | 38±8 | 0.031±0.0042‡ | 0.033±0.0050‡ | 6±8‡ |
| 9. Middle inferior septal | 0.037±0.0059 | 0.056±0.0096 | 34±7 | 0.031±0.0044* | 0.031±0.0048‡ | −1±8‡ |
| 10. Middle inferior | 0.043±0.0044 | 0.060±0.010 | 28±10 | 0.033±0.0042‡ | 0.034±0.0056‡ | 2±7‡ |
| 11. Middle inferior lateral | 0.037±0.0025 | 0.063±0.011 | 39±10 | 0.032±0.0052* | 0.034±0.0059‡ | 4±13‡ |
| 12. Middle anterior lateral | 0.033±0.0029 | 0.052±0.011 | 34±11 | 0.030±0.0078 | 0.030±0.0042‡ | −1±16‡ |
| 13. Apical anterior | 0.043±0.0061 | 0.083±0.016 | 47±9 | 0.043±0.017 | 0.049±0.016‡ | 11±12‡ |
| 14. Apical septal | 0.052±0.0092 | 0.10±0.024 | 47±12 | 0.040±0.010† | 0.042±0.012‡ | 6±8‡ |
| 15. Apical inferior | 0.056±0.0077 | 0.10±0.030 | 43±14 | 0.047±0.0045† | 0.050±0.0087‡ | 3±16‡ |
| 16. Apical lateral | 0.048±0.0091 | 0.10±0.026 | 50±13 | 0.045±0.0093 | 0.051±0.014‡ | 10±14‡ |
Values are means ± SD. LV, left ventricular; CED, curvedness in end-diastole; CES, curvedness in end-systole; ΔC, curvedness change between end diastole and end systole.
P < 0.05;
P < 0.01;
P < 0.001 vs. normal.
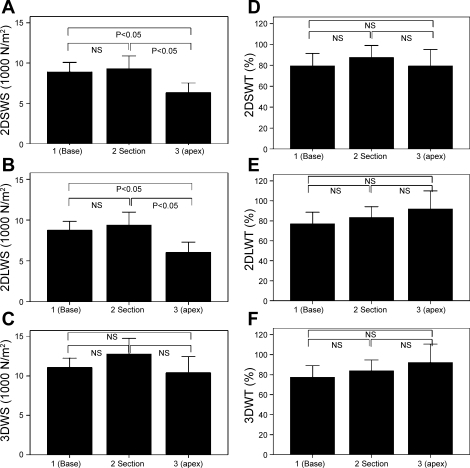
Wall thickness and radius of the cavity were measured in the short-axis plane, long-axis plane (perpendicular to the short axis), and 3-D surface. Wall stress calculated with these data is shown in Fig. 5, A–C. Peak systolic wall stress in the short-axis plane (Fig. 5A) and long-axis plane (Fig. 5B) revealed a significant difference from base to apex (P < 0.0001, ANOVA). The short- and long-axis wall stress showed 41 ± 11% and 45 ± 12% increase of peak systolic wall stress between basal and apical sections, respectively. When wall thickness and radius of the cavity were calculated in the 3-D space, the variation of wall stress (3DWS) from base to apex was no longer observed (Fig. 5C). The difference between 2DSWS and 3DWS, 2DLWS, and 3DWS was reduced more at the base. The 3DWS values tend to be highest in the anterior region and lowest in the inferior region (Table 3).
Fig. 5.
Variation of LV systolic wall stress and wall thickening from base to apex in normal subjects. A: wall stress in short-axis direction (2DSWS). B: wall stress in long-axis direction (2DLWS). C: 3-D wall stress (3DWS). D: wall thickening in short-axis direction (2DSWT). E: wall thickening in long-axis direction (2DLWT). F: 3-D wall thickening (3DWT). Values are means ± SD. P, 2-tailed significance of paired differences; NS, not significant.
Table 3.
LV end-systolic wall stress that takes into account curvature in normal heart
| Segment | 3DWS, ×1,000 N/m2 | 2DLWS, ×1,000 N/m2 | 2DSWS, ×1,000 N/m2 |
P |
||
|---|---|---|---|---|---|---|
| 3DWS vs. 2DSWS | 3DWS vs. 2DLWS | 2DSWS vs. 2DLWS | ||||
| 1. Basal anterior | 10.9±3.92 | 8.19±3.55 | 10.1±4.99 | 0.01 | 0.030 | NS |
| 2. Basal anterior septal | 10.1±3.96 | 7.99±4.38 | 8.81±2.62 | 0.006 | NS | NS |
| 3. Basal inferior septal | 12.4±3.21 | 12.1±5.56 | 7.54±2.81 | NS | <0.0001 | NS |
| 4. Basal inferior | 10.3±4.07 | 8.00±2.67 | 8.08±3.26 | 0.009 | 0.03 | NS |
| 5. Basal inferior lateral | 10.4±4.69 | 7.80±3.46 | 8.73±3.83 | 0.003 | 0.021 | NS |
| 6. Basal anterior lateral | 12.5±5.50 | 9.50±4.68 | 9.39±5.80 | <0.001 | 0.003 | NS |
| 7. Middle anterior | 13.7±4.52 | 9.10±3.88 | 10.0±3.93 | <0.0001 | <0.0001 | NS |
| 8. Middle anterior septal | 10.2±3.85 | 7.41±4.02 | 9.85±3.33 | 0.024 | NS | 0.048 |
| 9. Middle inferior septal | 11.9±4.69 | 10.5±6.60 | 7.41±3.44 | NS | <0.0001 | NS |
| 10. Middle inferior | 11.1±5.77 | 8.35±3.91 | 8.05±5.74 | 0.039 | <0.0001 | NS |
| 11. Middle inferior lateral | 12.6±9.63 | 8.00±5.89 | 10.8±9.49 | 0.021 | <0.0001 | NS |
| 12. Middle anterior lateral | 17.3±11.12 | 12.4±9.20 | 10.2±7.31 | <0.0001 | 0.006 | NS |
| 13. Apical anterior | 12.5±6.02 | 6.27±3.38 | 7.15±3.49 | <0.0001 | <0.0001 | NS |
| 14. Apical septal | 8.50±4.23 | 6.07±3.79 | 5.53±2.54 | NS | 0.015 | NS |
| 15. Apical inferior | 10.0±6.40 | 7.16±4.13 | 5.08±3.88 | NS | 0.003 | NS |
| 16. Apical lateral | 10.7±7.40 | 5.87±3.14 | 10.7±7.40 | 0.045 | 0.006 | NS |
Values are means ± SD. 3DWS, 3-dimensional (3-D) wall stress; 2DLWS, wall stress in long-axis plane; 2DSWS, wall stress in short-axis plane; NS, not significant.
Wall thickening values determined in the short-axis plane, long-axis plane, and 3-D surface are shown in Fig. 5, D–F. Wall thickening did not differ significantly from base to apex. The comparison between 3DWT and a 2-D assessment of wall thickening (i.e., 2DSWT and 2DLWT) did not reveal significant differences at the basal and midzone, anterior, septal, and lateral regions.
Curvedness, radius-to-thickness ratio, peak systolic wall stress, and wall thickening in IDCM patients and normal subjects.
Regional variations of LV curvature are highlighted by curvedness values from base to apex in normal subjects and IDCM patients in Table 2. Significant differences in end-diastolic curvedness (CED) were noted in all regions, except the base and anterior. Also, significant differences in end-systolic curvedness (CES) and ΔC were noted in all regions between normal subjects and IDCM patients. Significant differences in end-diastolic radius-to-thickness ratio (R/TED) were noted in 9 of 16 segments. Also, significant differences in end-systolic radius-to-thickness ratio (R/TES) were noted in all regions between normal subjects and IDCM patients (Table 4).
Table 4.
LV radius-to-thickness ratio that takes into account 3-D curvature in normal subjects and IDCM patients
| Segment |
Normal (n = 10) |
IDCM (n = 10)
|
||
|---|---|---|---|---|
| R/TED | R/TES | R/TED | R/TES | |
| 1. Basal anterior | 5.04±1.35 | 1.86±0.65 | 5.64±1.63 | 4.35±1.03‡ |
| 2. Basal anterior septal | 4.22±1.26 | 1.66±0.58 | 5.62±1.43* | 4.64±1.29‡ |
| 3. Basal inferior septal | 4.59±1.06 | 2.01±0.53 | 6.13±2.06* | 4.84±1.62‡ |
| 4. Basal inferior | 3.90±0.60 | 1.72±0.61 | 5.00±1.07* | 3.98±1.14‡ |
| 5. Basal inferior lateral | 4.95±1.19 | 1.84±0.80 | 5.30±1.30 | 4.42±1.72‡ |
| 6. Basal anterior lateral | 5.65±1.83 | 2.15±0.96 | 5.31±1.38 | 4.50±1.60‡ |
| 7. Middle anterior | 6.98±3.17 | 2.10±0.70 | 8.79±2.16* | 7.02±1.77‡ |
| 8. Middle anterior septal | 4.77±1.20 | 1.65±0.55 | 8.04±1.56‡ | 6.55±1.57‡ |
| 9. Middle inferior septal | 4.74±1.25 | 1.94±0.69 | 6.18±1.51* | 5.72±1.37‡ |
| 10. Middle inferior | 4.18±0.83 | 1.83±0.84 | 5.27±1.10* | 4.84±1.33‡ |
| 11. Middle inferior lateral | 5.15±1.00 | 2.03±1.34 | 5.56±1.44* | 5.26±1.96‡ |
| 12. Middle anterior lateral | 6.26±1.87 | 2.57±1.53 | 7.06±2.49 | 6.10±1.84‡ |
| 13. Apical anterior | 5.86±1.67 | 1.97±0.86 | 7.51±3.27 | 6.23±2.65‡ |
| 14. Apical septal | 4.55±0.83 | 1.41±0.59 | 7.59±2.64† | 6.37±2.22‡ |
| 15. Apical inferior | 4.78±1.15 | 1.59±0.89 | 5.74±1.24 | 4.90±1.45‡ |
| 16. Apical lateral | 5.67±2.42 | 1.72±1.01 | 6.10±2.03 | 5.17±2.02‡ |
Values are means ± SD. R/TED, end-diastolic radius-to-thickness ratio; R/TES, end-systolic radius-to-thickness ratio.
P < 0.05;
P < 0.01;
P < 0.001 vs. normal.
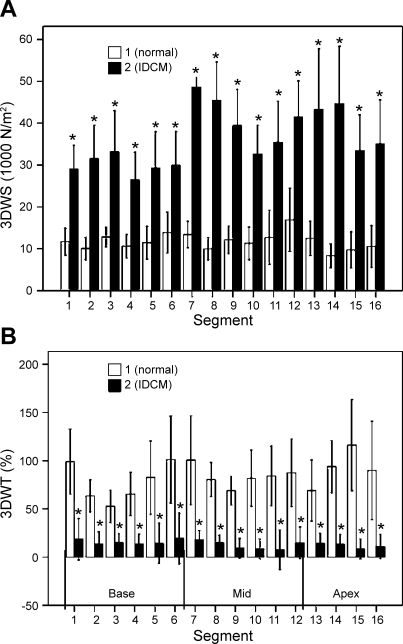
In IDCM patients, 3DWS was significantly increased and 3DWT was decreased compared with normal subjects (Fig. 6A). There is a gradient of mean wall stress from base to apex with 3DWS. Also, 3DWS was highest at the apex in IDCM patients and 3DWT was significantly decreased in all regions compared with normal subjects (Fig. 6B). In addition, 3DWT is smallest at the inferior segments and highest at the anterior segments. There is also significant variation among the four circumferential regions (P < 0.001, ANOVA) and from base to apex (P < 0.001, ANOVA).
Fig. 6.
Variation of LV end-systolic wall stress (3DWS) in normal subjects and IDCM patients. A: 3DWS assessment from 3-D curvature. B: 3DWT assessment from 3-D curvature. Values are means ± SD. *Significantly different from normal.
Analysis of segment scar extent in IDCM patients.
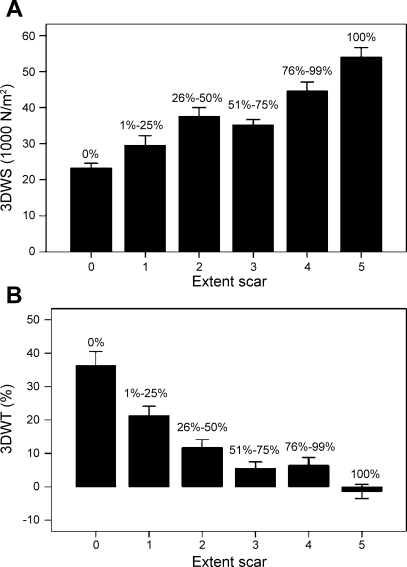
The distribution of mean values of wall stress and wall thickening with the extent of segment scar is shown in Fig. 7 for a total of 160 segments from the IDCM patients. As expected, there was a positive correlation between the extent of myocardial infarct and peak systolic wall stress (3DWS; r = 0.652, P < 0.0001; Fig. 7A). A negative correlation between the extent of myocardial infarct and wall thickening (3DWT) can be seen (r = −0.622, P < 0.0001; Fig. 7B).
Fig. 7.
Distribution of peak systolic wall stress (3DWS, A) and wall thickening (3DWT, B) based on different segment scar extent in IDCM patients. Values are means ± SD.
DISCUSSION
This study investigated the regional 3-D shape variations (e.g., in terms of curvedness) and wall stress in the LV. Accordingly, we developed methods to determine and map the local curvatures, local radius, and wall thickness in a 3-D model of the reconstructed LV. This approach yields new insights and demonstrates the potential of using 3-D regional analysis to provide details associated with local mechanics that are unattainable with 2-D analysis or simplified geometric modeling.
Normal hearts.
The radius of curvature of the LV is usually estimated from the short- and long-axis diameters (2-D analysis). These parameters, however, do not necessarily correspond to the radii of curvature at a particular point, especially when local pathology is present (45). In the present study, we have compared the difference between 3-D and 2-D analysis (i.e., short axis and long axis). The wall stress values derived from short- and long-axis methods tend to vary from base to apex, with the smallest wall stress value at the apex. 3DWS is fairly uniform, however, from base to apex (P = 0.298, ANOVA) among the four circumferential regions (P > 0.05, ANOVA). Also, 3DWS is ∼10% lower at the apex and 20% lower at the inferior region than elsewhere. These modest variations in wall stress are in agreement with the relatively uniform radius-to-thickness ratio from base to apex (Table 4). Previous studies of wall stress at the apex are controversial, with some predicting high values (36) and others predicting low values (3, 28).
ICDM.
LV remodeling in IDCM is a multistep process that has been investigated in numerous studies (9, 34, 39). The loss of contractile function following coronary occlusion is accompanied by acute dilatation of the infarction area, increase of LV volume, lengthening of the LV perimeter, and blunting of the normal curvature. Geometrically, the increase of LV volume and sphericity result in a corresponding increase of the local radii of curvature. This is also consistent with the increase of SI, which is the short axis-to-long axis ratio. The development of IDCM is accompanied by a decrease of LV function (e.g., LVEF, dσ*/dtmax, and wall thickening), on the one hand, and a progressive increase of LV wall stress, on the other. In the present study, we find that wall stress increases in each region, which may in turn cause decreased function (wall thickening). The increase of global stress has been shown to be a measure of afterload following infarction (47). However, information regarding regional distribution of wall stress is lacking. Since infarction results in regional inhomogeneity of wall stress and the regional load may vary between different zones of an LV, the response to the load should be examined regionally.
Measurement of regional LV curvature.
The importance of shape characteristics of ventricular chambers has been appreciated for many centuries. Much of the previous work, however, has been of a qualitative nature or based on assumptions regarding ideal geometry of the ventricle. Furthermore, many earlier studies are based on 2-D models of short and/or long axis from ventriculography (4, 20, 30, 31, 33), MRI (3), and echocardiography (29).
The present study draws on the strength of 3-D geometric methodology, which uses an analytic approach to extract local differential properties and curvature information by means of local surface fitting (14, 18, 24, 50). This approach is proven to be robust and produces accurate results, as shown by Garimella and Swartz (15) and Cazals and Pouget (8). The approach is also quantitative and provides specific regional information, and it can be extended to the characterization of 3-D LV wall stress.
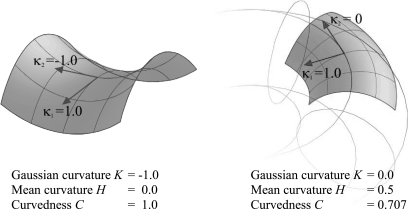
The choice of the descriptor used to quantify the variation of the surface shape is important. The common shape-related differential properties of surfaces are the Gaussian curvature (K = k1k2) and the mean curvature [H = (k1 + k2)/2]. The Gaussian curvature is considered the most widely used index of surface shape, and it depends only on the intrinsic geometry of the surface. However, it does not intuitively describe the extent of surface bending. For example, in Fig. 8, the Gaussian curvature K at the parabolic line on a toroidal surface is zero, even though it is actually curved. On the other hand, the mean curvature H can also be misleading. For example, at the saddle point illustrated in Fig. 8, H is zero, even though the surface is curved. Koenderink and van Doorn (25) also showed that K is not very indicative of local shape, and they introduced a more significant measure of local shape known as curvedness (C).
Fig. 8.
Schematics of difference between curvedness, Gaussian curvature, and mean curvature.
The curvedness value (C) describes the magnitude of the curvature at a surface point, i.e., a measure of degree of curvature at a point. Since we are interested in the magnitude or extent of curvature locally, we chose C as the curvature metric for analyzing LV regional shape. Our results show that surface curvedness (CES) of the LV of an IDCM patient is significantly lower than CES of the normal LV. This is explicitly demonstrated by the lower systolic function (i.e., LVEF and wall thickening).
Limitations of the study.
The peak systolic blood pressure only provides a global value of stress for the whole ventricle. Consequently, regional variations of the wall stress reported here only account for geometric factors; they do not integrate the local changes in pressure.
The evaluation of the wall surface curvature depends on factors such as image resolution and the surface reconstruction process. The spacing between short-axis image slices for cardiac MRI in clinical practice is typically ∼5–10 mm. Therefore, a considerable amount of interpolation between image slices has been used, and this may affect the accuracy of the curvature evaluation. The accuracy of the surface curvature also depends on the mesh quality and sampling density of the LV models, since the differential properties of each surface point are computed using additional information from the neighboring vertices. Because of the resolution of the MRIs used and a more intricate shape of the apical region, segmentation of LV contours is often more difficult in the apical region than in the middle and basal regions. This could affect the evaluation of the regional curvedness at the apical region, especially at end systole. An additional limitation is the absence of an age-matched control group.
Several parameters, such as wall thickening and regional circumferential or radius strain, have been developed to quantify regional myocardial function. Since exclusion of trabeculation at end systole is impossible because the trabeculae are compacted with the full thickness of myocardium, the wall thickening may be overestimated. Furthermore, calculation of wall thickening will be affected by the axis rotation during the cardiac cycle. Regional strains were not calculated in the present study, however, and cannot be compared.
Traditional techniques of regional ventricular function parameters (i.e., wall thickening and regional circumferential or radius strain) depend on assumptions about coordinates, reference, and the uniformity of ventricular contraction. Our method of shape analysis was developed to allow the quantification of regional curvedness and is independent of some of those assumptions.
Conclusions.
A framework has been developed for the analysis of LV regional curvature, wall stress, and wall thickening for normal subjects and patients with IDCM. The methodology relies on magnetic resonance anatomic data and local surface-fitting techniques to interrogate LV geometry at end diastole and end systole. The proposed 3-D approach is found to be better than the 2-D approaches for precise evaluation of the regional wall stress. A decrease of end-systolic curvedness and an increase of peak systolic wall stress are observed in patients with IDCM compared with normal subjects. This decrease in wall surface curvature may be an important prognostic factor of LV remodeling.
GRANTS
This work was supported in part by a research grant from the National Heart Centre Singapore and National Heart, Lung, and Blood Institute Grant HL-84529.
APPENDIX A
Computation of 3-D shape descriptors.
We compute LV surface curvatures via an analytic approach using a local surface patch-fitting method.
Local surface patch fitting.
In the vicinity of a point x, the surface can be approximated by an osculating paraboloid that may be represented by a quadratic polynomial with parameters du and dv. This polynomial can be considered a Taylor expansion at x of the surface by omitting those after the quadratic term
 |
(A1) |
The coefficients x00, xu, and xv are the zero, first, and second derivatives of x with respect to u and v at the surface point x00 = x(u, v), respectively. With these six derivatives, the curvatures of the surface can be easily computed. Considering the function given by z = f(x, y), a second-order polynomial of the form
 |
(A2) |
is used to fit the approximating surface patch. In this equation, p = x − x0 and q = y − y0, where x0 and y0 are the x and y coordinates of the center point x0 of the surface patch under consideration. The six coefficients of the paraboloid are then obtained by least-squares solution of an overdetermined system of linear equations
 |
(A3) |
where n is the number of points in the neighborhood of a selected surface point.
It is desired that c1–c6 are acquired, such that the divergence of the fitted paraboloid and the data points are minimized, which is similar to minimizing the differences between zn (measured value of z) and z′n (calculated value of z). The minimization problem at this point is then expressed as
 |
(A4) |
where N represents the number of points within the fitted paraboloid and G is a distance weighting function
 |
(A5) |
where f and d are arbitrary constants, which can be adjusted accordingly. The error function E will have a minimum when
 |
(A6) |
thus yielding the six linear equations required to compute c1–c6.
The first coefficient c1 is the z value of the center point x0 on the fitted surface patch, while c2–c6 can be interpreted as the first and second derivatives of x with respect to p and q at x0. By acquiring these coefficients, we can then determine the shape descriptor, which is based on the curvedness (C) presented by Koenderink and Van Doorn (25) as
 |
(A7) |
where κ1 and κ2 are the maximum and minimum principal curvatures at the vertex of the surface, the values of which are obtained from the roots of
 |
(A8) |
where {E, F, G} and {L, M, N} are components of the first and second fundamental forms, respectively.
APPENDIX B
Computation of radius and wall thickness using the short- and long-axis approach and the 3-D approach.
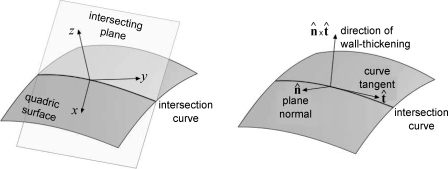
To enable the calculations of 2DSR and 2DLR, we need to determine the properties of the intersection curve between the quadric surface and the intersecting plane, be it the short- or long-axis plane (Fig. B1). The objective is to find the curvature of the intersection curve, as well as the vector defining the direction, to measure the wall thickness. The wall radius is then the inverse of the curvature. The direction vector will be used to perform a ray-triangle intersection with the epicardial surface mesh to determine the wall thickness.
The calculation is carried out in the local frame of the quadric surface obtained during the patch fitting. As the intersection plane passes through the origin of the quadric surface, the implicit form in the local frame is given by
 |
(B1) |
If we include the quadric equation in the plane equation, we obtain
 |
(B2) |
 |
The parametric curve that describes the intersection between the quadric and the plane is then given by
 |
(B3) |
where α is the curve parameter. A suitable parameterization is to take α = x. On the basis of differential geometry, the curvature κ of r at the origin is
 |
(B4) |
where ṙ and r̈ are the first and second derivatives of r with respect to the curve parameter, respectively.
To calculate these derivatives, we evaluate the y component of r. The derivative of Eq. B2 with respect to x gives
 |
(B5) |
 |
(B6) |
Differentiating Eq. B5, again with respect to x, yields
 |
 |
(B7) |
Next, we evaluate the z component of r by differentiating the quadric equation z = ax2 + bxy + cy2 + dx + ey with respect to x
 |
(B8) |
If we differentiate Eq. B8 with respect to x, we obtain
 |
(B9) |
At α = 0, x = y = 0. Using the results in Eqs. B6 and B8, we obtain
 |
 |
(B10) |
Furthermore, using the results in Eqs. B7 and B9, we obtain
 |
(B11) |
 |
 |
Using Eqs. B10 and B11, we can then use Eq. B4 to determine the curvature κ of the intersection curve r. The tangent of the curve t̂ at the origin was calculated as follows: t̂ = ṙ(0)/|ṙ(0)|. The direction of the wall thickness was then taken as the cross-product of the plane normal n̂ and t̂ (in the global coordinate space), as illustrated in Fig. B2.
Fig. B2.
Normal (n̂) at endocardial surface.
To calculate the wall thickness, a ray was defined with origin at the point of interest and direction t̂. An intersection was then performed between the ray and the epicardial surface. The wall thickness was taken as the distance between the point of interest and the point of ray-surface intersection. However, for the 3DR method, which employs the surface-fitting method, the direction of the ray is the normal of the quadric surface at the origin and is given by
 |
(B12) |
The costs of publication of this article were defrayed in part by the payment of page charges. The article must therefore be hereby marked “advertisement” in accordance with 18 U.S.C. Section 1734 solely to indicate this fact.
REFERENCES
- 1.Arisi G, Macchi E. Potential fields on the ventricular surface of the exposed dog heart during normal excitation. Circ Res 52: 706–715, 1983. [DOI] [PubMed] [Google Scholar]
- 2.Aygen M, Popp RL. Influence of the orientation of myocardial fibers on echocardiographic images. Am J Cardiol 60: 147–152, 1987. [DOI] [PubMed] [Google Scholar]
- 3.Balzer P, Furber A, Delepine S, Rouleau F, Lethimonnier F, Morel O, Tadei A, Jallet P, Geslin P, Le Jeune JJ. Regional assessment of wall curvature and wall stress in left ventricle with magnetic resonance imaging. Am J Physiol Heart Circ Physiol 277: H901–H910, 1999. [DOI] [PubMed] [Google Scholar]
- 4.Baroni M Computer evaluation of left ventricular wall motion by means of shape-based tracking and symbolic description. Med Eng Phys 21: 73–85, 1999. [DOI] [PubMed] [Google Scholar]
- 5.Bellenger NG, Francis JM, Davies CL, Coats A, Pennell DJ. Establishment and performance of a magnetic resonance cardiac function clinic. J Cardiovasc Magn Reson 2: 15–22, 2000. [DOI] [PubMed] [Google Scholar]
- 6.Beyar R, Shapiro E, Graves W, Guier W, Carey G, Soulen R, Zerhouni E, Weisfeldt M, Weiss J. Quantification and validation of left ventricular wall thickening by a three-dimensional element magnetic resonance imaging approach. Circulation 81: 297–307, 1990. [DOI] [PubMed] [Google Scholar]
- 7.Bogaert J, Rademarkers F. Regional nonuniformity of normal adult human left ventricle. Am J Physiol Heart Circ Physiol 280: H610–H620, 2001. [DOI] [PubMed] [Google Scholar]
- 8.Cazals F, Pouget M. Estimating differential quantities using polynomial fitting of osculating jets. Comput Aided Geom Des 22: 121–146, 2005. [Google Scholar]
- 9.Cerqueira MD, Weissman NJ, Dilsizian V, Jacobs AK, Kaul S, Laskey WK, Pennell DJ, Rumberger JA, Ryan T, Verani MS. Standardized myocardial segmentation and nomenclature for tomographic imaging of the heart. A statement for healthcare professionals from the Cardiac Imaging Committee of the Council on Clinical Cardiology of the American Heart Association. Circulation 105: 539–542, 2002. [DOI] [PubMed] [Google Scholar]
- 10.Cohn JN, Ferrari R, Sharpe N. Cardiac remodeling—concepts and clinical implications: a consensus paper from an international forum on cardiac remodeling. J Am Coll Cardiol 35: 569–582, 2000. [DOI] [PubMed] [Google Scholar]
- 11.Debatin J, Nadel SN, Sostman HD, Spritzer CE, Evans AJ, Grist TM. Magnetic resonance imaging-cardiac ejection fraction measurements. Phantom study comparing four different methods. Invest Radiol 27: 198–204, 1992. [PubMed] [Google Scholar]
- 12.Di Donato M, Toso A, Dor V, Sabatier M, Barletta G, Menicanti L, Fantini F, the Group RESTORE. Surgical ventricular restoration improves mechanical intraventricular dyssynchrony in ischemic cardiomyopathy. Circulation 109: 2536–2543, 2004. [DOI] [PubMed] [Google Scholar]
- 13.Dong S, McGregor J, Crawley A, McVeigh E, Belenkie I, Smith E, Tyberg J, Beyar R. Left ventricular thickness and regional systolic function in patients with hypertrophic cardiomyopathy. A three-dimensional tagged magnetic resonance study. Circulation 90: 1200–1209, 1994. [DOI] [PMC free article] [PubMed] [Google Scholar]
- 14.Frobin W, Hierholzer F. Transaction of irregularly sampled surface data points into a regular grid and aspects of surface interpolation, smoothing and accuracy. Proc SPIE Biostereometrics'85 602: 109–115, 1985. [Google Scholar]
- 15.Garimella RV, Swartz BK. Curvature Estimation for Unstructured Triangulations of Surfaces. Los Alamos, NM: Los Alamos National Library, 2003.
- 16.Gaudio C, Tanzilli G, Mazzarotto P, Motolese M, Romeo F, Marino B, Reale A. Comparison of left ventricular ejection fraction by magnetic resonance imaging and radionuclide ventriculography in idiopathic dilated cardiomyopathy. Am J Cardiol 67: 411–415, 1991. [DOI] [PubMed] [Google Scholar]
- 17.Germain P, Roul G, Kastler B, Mossard J, Bareiss P, Sacrez A. Inter-study variability in left ventricular mass measurement. Comparison between M-mode echocardiography and MRI. Eur Heart J 13: 1011–1019, 1992. [DOI] [PubMed] [Google Scholar]
- 18.Goldfeather J, Interrante V. A novel cubic-order algorithm for approximating principal direction vectors. ACM Trans Graphics 23: 45–63, 2004. [Google Scholar]
- 19.Grossman W, Braunwald E, Mann T, McLaurin L, Green L. Contractile state of the left ventricle in man as evaluated from end-systolic pressure-volume relations. Circulation 56: 845–852, 1977. [DOI] [PubMed] [Google Scholar]
- 20.Hayashida W, Kumada T, Nohara R, Tanio H, Kambayashi M, Ishikawa N, Nakamura Y. Left ventricular regional wall stress in dilated cardiomyopathy. Circulation 82: 2075–2083, 1990. [DOI] [PubMed] [Google Scholar]
- 21.Hirota Y, Shimizu G, Kaku K, Saito T, Kino M, Kawamura K. Mechanisms of compensation and decompensation in dilated cardiomyopathy. Am J Cardiol 54: 1033–1038, 1984. [DOI] [PubMed] [Google Scholar]
- 22.Jackson BM, Parish LM, Gorman JH 3rd, Enomoto Y, Sakamoto H, Plappert T, St. John Sutton MG, Salgo I, Gorman RC. Borderzone geometry after acute myocardial infarction: a three-dimensional contrast-enhanced echocardiographic study. Ann Thorac Surg 80: 2250–2255, 2005. [DOI] [PubMed] [Google Scholar]
- 23.Janz R Estimation of local myocardial stress. Am J Physiol Heart Circ Physiol 242: H875–H881, 1982. [DOI] [PubMed] [Google Scholar]
- 24.Kambhamettu C, Goldgof DB. Curvature-based approach to point correspondence recovery in conformal nonrigid motion. CVGIP: Image Understanding 60: 26–43, 1994. [Google Scholar]
- 25.Koenderink JJ, Van Doorn AJ. Surface shape and curvature scales. Image Vision Comput 10: 557–565, 1992. [Google Scholar]
- 26.Krahwinkel W, Haltern G, Gulker H. Echocardiographic quantification of regional left ventricular wall motion with color kinesis. Am J Cardiol 85: 245–250, 2000. [DOI] [PubMed] [Google Scholar]
- 27.Lessick J, Fisher Y. Regional three-dimensional geometry of the normal human left ventricle using cine computed tomography. Ann Biomed Eng 24: 583–594, 1996. [DOI] [PubMed] [Google Scholar]
- 28.Lessick J, Sideman S, Azhari H, Shapiro E, Weiss JL, Beyar R. Evaluation of regional load in acute ischemia by three-dimensional curvature analysis of the left ventricle. Ann Biomed Eng 21: 147–161, 1993. [DOI] [PubMed] [Google Scholar]
- 29.Leung KY, Bosch JG. Localized shape variation for classifying wall motion in echocardiograms. Med Image Comput Comput Assist Interv 10: 52–59, 2007. [DOI] [PubMed] [Google Scholar]
- 30.Mancini GBJ, DeBoe SF, Anselno E, LeFree MT. A comparison of traditional wall motion assessment and quantitative shape analysis: a new method for characterizing left ventricular function in human. Am Heart J 114: 1183–1191, 1987. [DOI] [PubMed] [Google Scholar]
- 31.Mancini GBJ, DeBoe SF, Anselmo E, Simon SB, LeFree MT, Vogel RA. Quantitative regional curvature analysis: an application of shape determination for the assessment of segmental left ventricular function in man. Am Heart J 113: 326–334, 1987. [DOI] [PubMed] [Google Scholar]
- 32.Mancini GBJ, DeBoe SF, McFillem MJ, Bates ER. Quantitative regional curvature analysis: a prospective evaluation of ventricular shape and wall motion measurements. Am Heart J 116: 1616–1621, 1988. [DOI] [PubMed] [Google Scholar]
- 33.Marcus E, Barta E, Beyar R, Battler A, Rath S, Har-Zahav Y, Adam D, Lorente P, Sideman S. Characterization of regional left ventricular contraction by curvature difference analysis. Basic Res Cardiol 83: 486–500, 1988. [DOI] [PubMed] [Google Scholar]
- 34.Nakayama Y, Shimizu G, Hirota Y, Saito T, Kino M, Kitaura Y, Kawamura K. Functional and histopathologic correlation in patients with dilated cardiomyopathy: an integrated evaluation by multivariate analysis. J Am Coll Cardiol 10: 186–192, 1987. [DOI] [PubMed] [Google Scholar]
- 35.Niggel TJ, Borowski DT, LeWinter MM. Relation between left ventricular shape and exercise capacity in patients with left ventricular dysfunction. J Am Coll Cardiol 22: 751–757, 1993. [DOI] [PubMed] [Google Scholar]
- 36.Panda S, Natarjan R. Finite-element method of stress analysis in the human left ventricular layered wall structure. Med Biol Eng Comput 15: 61–71, 1977. [DOI] [PubMed] [Google Scholar]
- 37.Pfeffer MA, Braunwald E. Ventricular remodeling after myocardial infarction. Circulation 81: 1161–1170, 1990. [DOI] [PubMed] [Google Scholar]
- 37a.Reichek N, Wilson J, St. John Sutton M, Plappert TA, Goldberg S, Hirshfeld JW. Noninvasive determination of left ventricular end-systolic stress: validation of the method and initial application. Circulation 65: 99–108, 1982. [DOI] [PubMed] [Google Scholar]
- 38.Rueckert D, Burger P. Shape-base segmentation and tracking of the heart in 4D cardiac MR image. Proc Med Image Understanding Anal '97, Oxford UK, July 1997, p. 193–196.
- 39.Sabbah HN, Kono T, Stein PD, Mancini GB, Goldstein S. Left ventricular shape changes during the course of evolving heart failure. Am J Physiol Heart Circ Physiol 263: H266–H270, 1992. [DOI] [PubMed] [Google Scholar]
- 40.Semelka R, Tomei E, Wagners S, Mayo J, Kondo C, Suzuki J, Caputo G, Higgins C. Normal left ventricular dimensions and function: reproducibility of measurements with cine MR imaging. Radiology 174: 763–768, 1990. [DOI] [PubMed] [Google Scholar]
- 41.Street DD, Spotnitz HM. Fiber orientation in the canine left ventricle during diastole and systole. Circ Res 24: 339–347, 1969. [DOI] [PubMed] [Google Scholar]
- 42.Swynghedauw B Molecular mechanisms of myocardial remodeling. Physiol Rev 79: 215–262, 1999. [DOI] [PubMed] [Google Scholar]
- 43.Takayama Y, Costa KD, Covell JW. Contribution of laminar myofiber architecture to load-dependent changes in mechanics of myocardium. Am J Physiol Heart Circ Physiol 284: H1510–H1520, 2003. [DOI] [PubMed] [Google Scholar]
- 44.Tibayan FA, Lai DT, Timek TA, Dagum P, Liang D, Zasio MK, Daughter GT, Miller DC, Ingels NB Jr. Alteration in left ventricular curvature and principal strains in dilated cardiomyopathy with functional mitral regurgitation. J Heart Valve Dis 12: 292–299, 2003. [PubMed] [Google Scholar]
- 45.Tsujioka K, Ogasawara O, Mito K, Haramatsu O, Wada Y, Goto M, Matsuoka S, Kagiyama M, Kajiya F. Piezoelectric polymer curvature sensor for measurement of regional curvature radius of LV wall. Am J Physiol Heart Circ Physiol 254: H1010–H1016, 1988. [DOI] [PubMed] [Google Scholar]
- 46.Tulner SAF, Steendijk P, Klautz RJM, Bax JJ, Schalij MJ, van der Wall EE, Dion RAE. Surgical ventricular restoration in patients with ischemic dilated cardiomyopathy: evaluation of systolic and diastolic ventricular function, wall stress, dyssynchrony and mechanical efficiency by pressure-volume loops. J Thorac Cardiovasc Surg 124: 886–890, 2002. [DOI] [PubMed] [Google Scholar]
- 47.Yin FC Ventricular wall stress. Circ Res 49: 829–842, 1981. [DOI] [PubMed] [Google Scholar]
- 48.Zhong L, Ghista DN, Ng EYK, Lim ST, Chua T, Lee CN. Left ventricular shape-based contractility index. J Biomech 39: 2397–2409, 2006. [DOI] [PubMed] [Google Scholar]
- 49.Zhong L, Tan RS, Ghista DN, Ng EYK, Chua LP, Kassab GS. Validation of a novel noninvasive cardiac index of left ventricular contractility in patients. Am J Physiol Heart Circ Physiol 292: H2764–H2772, 2007. [DOI] [PubMed] [Google Scholar]
- 50.Zhong L, Yeo SY, Su Y, Le TT, Tan RS, Ghista DN. Regional assessment of left ventricular surface shape from magnetic resonance imaging. Conf Proc IEEE Eng Med Biol Soc 1: 884–887, 2007. [DOI] [PubMed] [Google Scholar]


