

Abstract
We studied the consequences of expression of wild-type (WT) human NIPA1 and two mutant forms of NIPA1 with known HSP-associated mutations (T45R and G106R) on cultured rat cortical neurons and using equivalent substitutions in the Caenorhabditis elegans NIPA1 homolog CeNIPA. WT NIPA1 localized in transfected neuronal and non-neuronal cells to the Golgi complex, a subset of synaptic vesicles, to a subset of early endosomes, and plasma cell membrane. Mutant NIPA1 accumulated in the endoplasmic reticulum (ER) triggering ER stress and features of apoptotic cell death. Flow cytometric analysis of NIPA1 surface expression demonstrated relatively intact trafficking of mutant forms and only the T45R mutant exhibited modestly reduced patterns of surface expression without evidence for a dominant-negative effect. In vivo pan-neuronal expression of the WT C. elegans NIPA1 homolog (CeNIPA) was well tolerated, with no obvious impact on neuronal morphology or behavior. In striking contrast, expression of CeNIPA bearing HSP-associated mutations caused a progressive neural degeneration and a clear motor phenotype. Neuronal loss in these animals began at day 7 and by day 9 animals were completely paralyzed. These effects appeared to arise from activation of the apoptotic program triggered by unfolded protein response (UPR), as we observed marked modifications of motor and cellular phenotype when mutant NIPA1 was expressed in caspase (ced-3)- and UPR (xbp-1)-deficient backgrounds. We propose that HSP-associated mutations in NIPA1 lead to cellular and functional deficits through a gain-of-function mechanism supporting the ER accumulation of toxic NIPA1 proteins.
Keywords: hereditary spastic paraplegia, NIPA1, Caenorhabditis elegans, flow cytometry, animal model, unfolded protein response
Introduction
Hereditary spastic paraplegia (HSP), characterized by a progressive weakness and spasticity of the lower extremities, is one of the most genetically heterogeneous neurodegenerative disorders with >30 associated genes (Fink, 2006; Züchner, 2007). Despite this heterogeneity, pathological changes in HSP are thought to be uniform, with predominant axonal degeneration of the longest ascending (dorsal columns) and descending (pyramidal) tracts in the spinal cord (Wharton et al., 2003; Deluca et al., 2004). Several different mechanisms for the observed axonal degeneration have been suggested recently (Soderblom and Blackstone, 2006).
Mutations in the gene NIPA1 (nonimprinted gene in Prader-Willi/Angelman syndrome region 1) have recently been associated with autosomal-dominant (AD) HSP. The NIPA1 gene is also linked to the critical region associated with Prader-Willi and Angelman syndromes on chromosome 15q11 (SPG6) (Rainier et al., 2003). The predicted NIPA1 protein consists of 329 aa that can be predicted to comprise nine transmembrane (TM) segments. NIPA1 is highly conserved across vertebrates (Chai et al., 2003). Although the exact function of NIPA1 remains unclear, recent evidence suggests that the protein may localize to plasma membrane and early endosomes, where it may serve as an intracellular magnesium transporter (Goytain et al., 2007). The Drosophila NIPA1 homolog spichthyin is believed to regulate synaptic development and axonal maintenance through bone morphogenic protein (BMP)-linked signaling pathways (Wang et al., 2007). A single C. elegans NIPA1 homolog, Y53G8B.4, exists and encodes a 388 aa protein that shares 45% amino acid identity with human NIPA1. Importantly, residues corresponding to sites of known HSP-associated mutations in NIPA1 s are conserved in the Drosophila and C. elegans homologs.
Allelic heterogeneity of the human NIPA1 locus is relatively low, with only three amino acid substitutions identified in SPG6 kindreds thus far (Rainier et al., 2003; Chen et al., 2005; Reed et al., 2005; Kaneko et al., 2006). Preliminary studies suggest that the T45R and G106R substitutions alter magnesium transport. Goytain et al. (2007) reported that the mouse NIPA1 substitution T39R, corresponding to the human NIPA1 substitution T45R, reduces magnesium transport by ∼30%, whereas the cognate G106R substitution in mouse NIPA1 (G100R) abolishes magnesium transport completely. These effects have been attributed to altered surface trafficking. Surface expression of murine NIPA1 T39R was significantly reduced compared with the WT protein, whereas surface expression of G100R was completely abolished. Interestingly, both of these variants accumulated in the ER, although no phenotype was attributed to this observation. Despite the evidence presented for altered subcellular localization and function, Goytain et al. (2007) attribute these forms of SPG6-HSP to a haploinsufficiency mechanism.
To better appreciate the mechanism of NIPA1-associated HSP, we studied the consequences of human NIPA T45R and G106R expression in vitro using COS7 and HEK293T cell lines as well as in primary rat neuronal cultures. To extend these findings to an in vivo model, we produced the analogous mutations in the C. elegans NIPA1 homolog and examined neuronal morphology, behavior, and viability after targeting expression to nematode motor neurons.
Materials and Methods
Eukaryotic DNA expression constructs.
The full coding sequence of the NIPA1 and NIPA2 genes (RefSeq [http://www.ncbi.nlm.nih.gov] accession number DNA: NM_144599 and NM_030922, respectively) were amplified from human brain tissue using reverse transcriptase PCR (RT-PCR). Total RNA was isolated from homogenized brain using Trizol (Invitrogen), and first-strand cDNA was generated using RT-PCR kit according to the manufacturer's protocols (Promega). The primers used for PCR were 5′-ATGGGGACTGCAGCTGCGGCA-3′ and 5′-GTCTGTTTTCATATTAG-3′. The resulting cDNA sequence was verified by sequencing and cloned into the eukaryotic expression vector pEGFP-N2 (BD Biosciences Clontech) using XhoI and EcoRI restriction sites. We also generated a second tagged NIPA1 construct with an in-frame C-terminal hemagglutinin (HA) epitope, which was cloned into the eukaryotic expression vector pcDNA3.1 using XhoI and BamHI restriction sites. Both EGFP and HA constructs were tagged at the C-terminus because of the presence of a putative N-terminal signal peptide. T45R and G106R missense mutations were introduced into each of these constructs using a site-directed mutagenesis kit (QuikChange, Stratagene) and verified by sequencing.
Cell lines and transfection.
HEK293T and COS7 cell lines were purchased from American Type Culture Collection (ATCC), cultured in DMEM (Sigma-Aldrich) containing 10% fetal bovine serum, 2 mm l-glutamine, 1 mm sodium pyruvate, 100 IU/ml penicillin, and 100 μg/ml streptomycin (Invitrogen), and maintained at 37°C in humidified 5% CO2/95% air. Cells were seeded at moderate density (∼50–60% confluent) in 12-well plates, and transfected the next day with the respective combination of constructs using FuGENE 6 (Roche Diagnostics) according to the manufacturer's protocol. Primary cortical neuronal cultures were prepared from embryonic day 18 (E18) rat embryos and transfected using the rat neuron Nucleofector kit (Amaxa) according to the manufacturer's protocol. The primary cortical neurons were electrically transfected with the respective constructs using the Nucleofector 1 device and the manufacturer's optimized protocol.
Immunocytochemistry, immunohistochemistry, and confocal microscopy.
Antibodies used in this study included mouse monoclonal anti-HA antibodies (Sigma-Aldrich), mouse monoclonal early endosomal marker (EEA1) antibodies, mannose 6-phosphate receptor (late endosomal marker), endosomal marker Rab-5 antibodies, calnexin antibodies, Golgi 58K antibodies, synaptophysin SY38 antibodies (all from Abcam), and mouse monoclonal Cy3 antibodies (Rockland). The pEYFP (Golgin-245) vector was obtained from Clontech (BD Biosciences Clontech). Cells were fixed with 4% paraformaldehyde (Electron Microscopy Sciences) and blocked with 2% bovine serum albumin in 1× PBS containing 0.5% Triton X-100. Cells were incubated with the specific antibody at a dilution of 1:800. After 2 h of incubation, cells were washed twice with 1× PBS and incubated with the secondary antibody conjugated to Cy3 for 1 h. After three washes, coverslips were mounted onto microscope slides and fluorescent images acquired with a Zeiss LSM510 META laser-scanning confocal microscope and processed with LSM Image software. Transfected cells were evaluated in a blind manner in regard to the presence of WT, mutant forms, or sham transfections; we evaluated between 50 and 100 cells for each construct, and specific numbers can be found in the Results section. Images were visualized using a confocal microscope, and the LSM images were photographed at 20×, 40×, 60×, and 100× magnification.
Flow cytometry and fluorescent resonance energy transfer experiments.
Cells were harvested 24 h after transfection using 37°C trypsin/EDTA (Invitrogen) and immediately placed in 4°C FACS buffer composed of PBS (Mediatech), 2% fetal bovine serum (FBS) (Invitrogen), and 0.05% sodium azide (VWR). Cells were then transferred to 96-well plates, where they were washed twice in FACS buffer (i.e., pelleted by centrifugation at 450 × g, vortexed, and resuspended). For surface protein staining, cells were incubated in antibody-containing FACS buffer for 1 h at 4°C, washed in FACS buffer three times, and resuspended in 2% w/v paraformaldehyde (PFA) (Electron Microscopy Sciences). For total protein staining, samples were first fixed and permeabilized using the Cytofix/Cytoperm kit from BD Biosciences for 15 min. After washing twice with Permwash (BD Biosciences) to remove residual fixative, cells were resuspended in antibody-containing Permwash for 1 h at 4°C. Following incubation with antibody, samples were washed four times with Permwash and twice with FACS buffer before resuspension in 2% PFA. The HA antibody (clone 16B12) was obtained from Covance as an Alexa-555 or Alexa-647 conjugate and used at a 1:250 dilution for surface staining and a 1:500 dilution for total protein staining. The MYC antibody (clone 4A6) was obtained from Millipore as an Alexa-555 conjugate and used at a 1:250 dilution for surface staining. Samples were run on a LSR II flow cytometer (BD Biosciences). For each staining condition, 50,000 cells were analyzed. Nonviable cells were excluded from analysis based on forward- and side-scatter profiles (data not shown), as determined from staining with 7-amino-actinomycin D (7-AAD) (Invitrogen). The Alexa-555 fluorophore was excited using a 535 nm laser and detected with a 575/26 bandpass filter. The Alexa-647 fluorophore was excited using a 635 nm laser and detected with a 675/20 bandpass filter. Fluorescent resonance energy transfer (FRET) between the Alexa-555 and Alexa-647 fluorophores was evaluated by excitation with the 535 nm laser and detection with a 670/14 bandpass filter (i.e., exciting the “donor” but detecting emission from the “acceptor”). Spectral compensation using single-stained controls was performed before acquisition of FRET data to eliminate the contribution of donor and acceptor emission (following direct excitation by the 535 nm laser) to the FRET channel. Data were acquired using FACSDiva (BD Biosciences) and analyzed off-line using FlowJo 7.1 (Treestar). To compare surface and total expression levels of wild-type and mutant NIPA1 proteins, the mean fluorescence intensity of mock transfected cells was subtracted from the mean fluorescence intensity of each positively transfected condition and the remaining fluorescence was normalized to that of the wild-type condition, yielding a relative fluorescence intensity (“Relative FI”). Statistical significance was determined using a one sample t test using a hypothetical mean of 1 (since data were normalized in each experiment to wild-type expression). Data were expressed as mean ± SEM. To compare the FRET signals between wild-type and mutant NIPA1 proteins, a FRET-positive gate was set such that <1% of cells were positive when stained individually with either donor- or acceptor-conjugated antibody. The percentage of cells in the FRET-positive gate with donor- and acceptor-conjugated antibody costaining was then used as an index of FRET intensity (Dye et al., 2005).
Subcellular fractionation, preparation of synaptosomes, Western blot analysis, and immunoprecipitation.
Adult mouse brain (4 weeks old C57BL/6, male) was homogenized in 0.25 m sucrose, 14% iodixanol (Optiprep gradient media), and protease inhibitor mixture. Samples were centrifuged for 4 h at 265,000 × g in a Sorvall TV-865 rotor and fractions were collected. The fractions were TCA precipitated and used for Western blot analysis with rabbit anti-NIPA1 antibody, mouse anti-synaptophysin monoclonal antibody, 58K Golgi protein antibody, and anti-Rab5 antibodies. Subcellular fractionation was performed as previously described, separating LP1 fraction containing heavy membranes and LP2 fraction enriched with synaptic vesicle membranes (Ferguson et al., 2003). Western blot was performed in a similar manner as for subcellular fractions. Quantification of Western blots for the assays of ER stress was performed with ChemiImager 5500 (Alpha Innotech) using Alpha Ease Fc software (Alpha Innotech).
For immunoprecipitation, HEK293 cells were transfected with a mixture of NIPA1WT::myc and NIPA1WT::HA, or NIPA1WT::myc and NIPA1T45R or NIPA1G106R::HA, or an empty vector as a control. After 36 h of transfection, cells were lysed and immunoprecipitated with anti-HA agarose (Thermo Scientific) Western blot analysis of myc-tagged NIPA1 with anti-myc antibody (anti-myc tag, clone 4A6). Cell lysates were used as protein input control of IP, together with actin immunoblotting as a loading control.
Polyclonal anti-NIPA1 antibodies.
Custom rabbit polyclonal antibodies were generated using the antigen KEFNFNLGEMNKSNMKTD (protein residue 311–329) (supplemental Fig. 1, available at www.jneurosci.org as supplemental material) conjugated to thyroglobulin. This sequence is absolutely conserved between human and rat/mouse NIPA1. The antibodies were obtained from Open Biosystems, affinity purified against the immunizing peptide using the recommended protocol. Affinity-purified antibodies were used in all experiments for endogenous NIPA1 localization and controlled through parallel incubations in the absence of primary antibodies (preimmune serum) and with peptide immunogen preabsorption.
Lactate dehydrogenase cytotoxicity assay and cell death analysis.
Cell death was evaluated by quantification of lactate dehydrogenase (LDH) activity using the LDH-Cytotoxicity Assay Kit (BioVision) with LDH activity measured at 495 nm using a microtiter plate reader. Each experiment with HEK293 cells was performed three times and the results were analyzed using an unpaired Student's t test; the assay of cytotoxicity with cultured cortical neurons was performed only twice because of lower ratio of transfection efficacy compared with heterologous cells. The cellular morphology after transfection with WT or mutant forms of the NIPA1 gene was assessed by 4′,6-diamidino-2-phenylindole dihydrochloride staining. Cells were fixed after removal of growth media with 4% paraformaldehyde/4% sucrose in PBS and, after washing, were stained with 4′,6-diamidino-2-phenylindole dihydrochloride. Living cells were characterized by evenly stained nuclei, while apoptotic cells showed condensed or fragmented nuclear morphology with cell body shrinkage and without signs of lysis. The ratio of apoptotic to normal cells was determined after counting 100 cells, and verified by repeating each count three times.
C. elegans lines and maintenance.
C. elegans growth and maintenance were performed using standard procedures (Brenner 1974). Genetic transformation was performed using the lin-15 (n765ts)X nematode line (Jin 1999). The motor phenotype of transgenic C. elegans lines was compared with a WT N2 line. Additional lines used in this study included unc-104 (e1265)II, ced-3(n717)IV and zcls4[HSP4::GFP]xbp-1(zc12)III; all these lines were obtained from the Caenorhabditis Genetics Center at University of Minnesota. For unc-104 transport experiments, CeNIPA::GFP(+) males were crossed to unc-104(e1265)−/− hermaphrodites, and unc-104(e1265)−/−;GFP-positive animals were selected for confocal imaging studies.
C. elegans reporter gene fusions and transformation.
The C. elegans NIPA1 homolog was identified using BLAST via the Wormbase database (http://www.wormbase.org) as Y53G8B.4 (GenBank accession numbers NM_065260). Here we renamed C. elegans homolog as CeNIPA. CeNIPA domains were analyzed with SMART software. Given the absence of phenotype rescue studies using human NIPA1 and C. elegans CeNIPA genes, we refer to CeNIPA as a homolog rather than ortholog gene. Protein alignments were performed with ClustalW software. Coding sequence of Y53G8B.4 was sequenced using RT-PCR on RNA isolated from adult N2 worms. This cDNA was fused with the pan-neuronal promoter F25B3.3 promoter using 3 kb of 5′ upstream sequence of this gene to express cDNA Y53G8B.4 with PCR primers 5′-CTGCAGGCATACGAGTGTGGCATACGAGTGAGG-3′ and 5′-GGATCCGTCGTCGTCGTCGATGCCGTCTTC-3′. This was cloned into the expression vector pPD95.75 using the PstI/BamHI cloning sites (Fire et al., 1990). The S73R and T143R missense mutations were introduced using site-directed mutagenesis as described above. These reporter constructs and a dominant DNA marker lin-15 (+) (pL15EK) were coinjected into lin-15 (n765ts) young adults and genetic transformation was assessed as rescue of the multivulval phenotype at 22.5°C. We also created a PF25B3.3::dsRED construct using the same cloning approach, and this construct was coinjected with the CeNIPA constructs and pL15EK to lin-15 (n765ts) lin-15(-) and ced-3 (n717) worm lines. Transformation experiments with the zcls4[HSP4::GFP]xbp-1(zc12) line were performed with modified CeNIPA::dsRED because of the presence of GFP as a part of HSP4 reporter construct.
Assessment of nematode motor activity.
Locomotor behavior was examined in individual wild-type and mutant animals (both of N2 and ced-3 genetic backgrounds) using a visual assay. Single worms were picked of breeding plates and placed individually on OP50 plates with thin lawns, and each worm was assessed every 24 h until they died. The animal movements were tracked manually and video images were collected for 30 min each day using a ZVS-3C75DE camera (Carl Zeiss) mounted on a stereo dissecting microscope (Stemi 2000-C, Carl Zeiss). We analyzed the movements of body segments and compared it with normal WT control animals. We visually divided the nematode body into approximately equal sections (tail, middle third, and head) and analyzed the number of sinusoidal moves within two 5 min segments. The animals were also mechanically stimulated to induce escape locomotor behavior. We plotted the degree of movements in each segments and compared this to age-matched normal animals. We compared the motility of transgenic animals with ced-3/CeNIPA and zcls4[HSP4::GFP]xbp-1(zc12)/CeNIPA animals using Student's t test.
Primary C. elegans neuronal cultures.
Primary neuronal cultures were prepared from hermaphrodite adults from lines expressing WT and mutant CeNIPA [CeNIPA(+)::EGFP, CeNIPA(S73R)::EGFP, CeNIPA(T144R)::EGFP], and from double-transgenic lines PF25B3.3::dsRED; CeNIPA(S73R)::EGFP;ced-3(n7127) or PF25B3.3::dsRED; CeNIPA(T144R)::EGFP;ced-3(n7127) using the methods described previously (Christensen et al., 2002). The cells were incubated at 18°C, and ∼104 cell per plate were plated for imaging and analysis of axonal outgrowth and degeneration. We scored 100 cells coexpressing GFP and dsRED for each mutation and WT CeNIPA. This analysis was initially done on day 1 and continued until the majority of neurons expressing mutant CeNIPA died. The neurons were scored for the presence of GFP signal in axons, the presence of dsRED signal in axons, and signs of neuronal cell death.
Results
Endogenous NIPA1 localized to the Golgi complex, synaptic vesicles, and other cytoplasmic membranes, including plasma membrane
Western blotting and immunocytochemistry of both endogenous and transfected human WT NIPA1 demonstrated high specificity of our affinity-purified polyclonal antibodies without any cross-reactivity with NIPA2 protein (supplemental Fig. 2, available at www.jneurosci.org as supplemental material). Having established specificity, the regional and subcellular distribution of endogenous NIPA1 was studied in the rodent (mouse and rat) CNS. NIPA1 immunoblotting studies reveal a high level of expression in frontal cortex (Fig. 1A, lane 1), cerebellum, striatum, and spinal cord (lanes 2–4, respectively) without significant interregional differences. We also analyzed the subcellular distribution of NIPA1 in adult mouse brain homogenates. Biochemical fractionation studies showed that the peak densities of NIPA1-positive fractions almost completely overlapped with the peak fractions positive for Golgi complex markers and synaptic vesicles fractions (Fig. 1C). In differential centrifugation-based fractionations of brain membranes, NIPA1 protein was also present in the LP2 fraction (Fig. 1B), consistent with localization to synaptic vesicle membranes.
Figure 1.
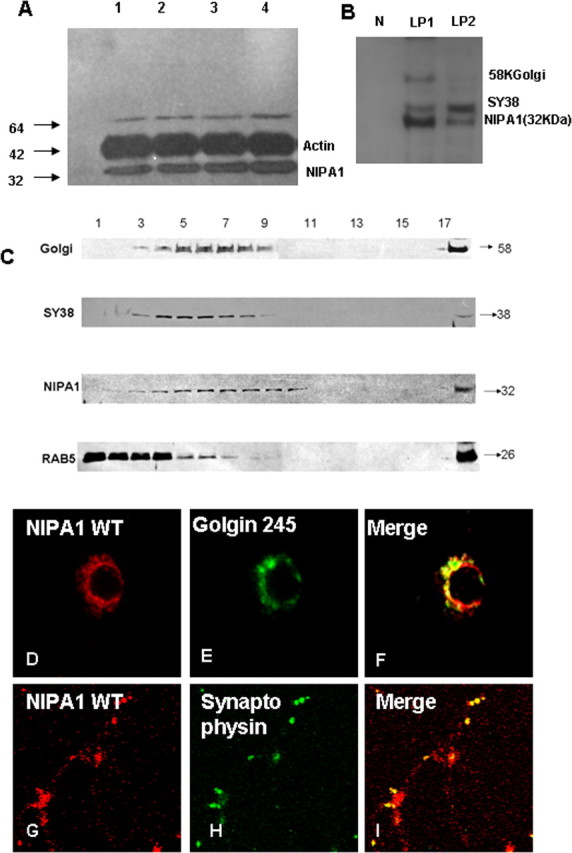
Distribution of endogenous NIPA1 protein in the mammalian CNS. Western blot analysis of NIPA1 distribution in adult mouse brain demonstrating the presence of endogenous NIPA1 protein in cortical regions (A, lane 1), cerebellum (lane 2), striatum (lane 3), and cervical spinal cord (lane 4); there was no significant differences between these regions when compared with actin load (plotting not shown). Fractionation with synaptosome isolation (B) showed, as suggested by the results shown in C, the presence of NIPA1 in the LP1 fraction, containing large membranes, such as Golgi complex (58KGolgin); additionally, we observed NIPA1 presence in the LP2 fraction, which is enriched for synaptic vesicles (SY38 synaptophysin) and small transport vesicles; the nuclear fraction (N lane) did not show any NIPA1 reactivity. Results obtained from mouse and rat adult brains did not differ in regional or subcellular distribution (data not shown). C, Western blot analysis of subcellular fractions of adult mouse brain. Antibodies against NIPA1 revealed the overlap of peak fractions with the Golgi complex markers and synaptophysin (SY38), while there was no peak fracture overlap with early endosomal markers (Rab5). Immunocytochemistry using E18 rat cultured cortical neurons confirmed colocalization of endogenous NIPA1 (red) with Golgi complex (green) (D–F) marker Golgin 245 and synaptic vesicle marker synaptophysin (G–I).
We confirmed the results of the biochemical fractionation studies in vitro using cultured cortical rat neurons. Significant colocalization of endogenous NIPA1 with Golgi complex markers was seen in all 100 analyzed E18 cortical neurons (Fig. 1D–F). Similarly, a subset of synaptic vesicles expressing synaptophysin colocalized with endogenous NIPA1 in all 100 analyzed E18 rat neurons with sufficient immunostaining (Fig. 1G–I)
We observed only partial colocalization with endosomal markers, previously suggested to comprise the majority of NIPA1-positive vesicles (Goytain et al., 2007). In brain fractions, peak densities of NIPA1 and the early endosomal marker Rab-5 were only partially overlapping, whereas peak fractions for Golgi complex markers and synaptic vesicle fractions almost completely overlapped with NIPA1 (Fig. 1C). Cellular immunohistochemical studies confirmed only partial colocalization of NIPA1 and Rab-5, which occurred in all 75 analyzed neuronal cell bodies with no colocalization in axons (Fig. 2A–E).
Figure 2.
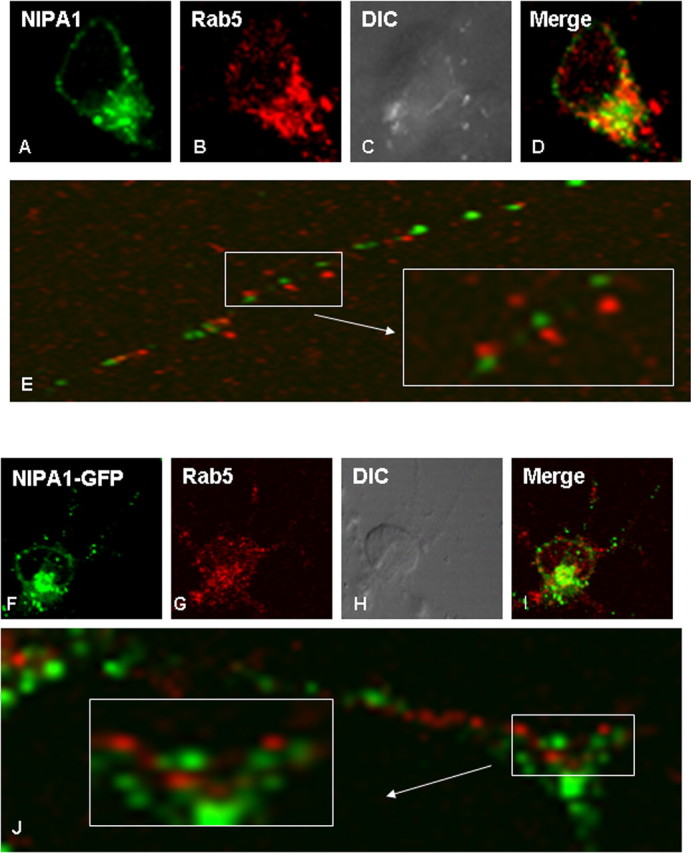
Partial overlap with early endosomal markers. Only partial colocalization with early endosomes of both endogenous NIPA1 protein (A–E) and expressed tagged NIPA1::EGFP protein (F–J) in cultured rat cortical neurons was seen in the neuronal bodies. We did not observe any colocalization of NIPA1 and Rab5 antigen in the NIPA1-positive vesicles of neuronal processes (E, J). There was no significant difference between the distribution of the endogenous and expressed tagged protein. Similar patterns were observed in HEK293 and COS7 cell lines for expressed NIPA1 protein (data not shown).
The subcellular distribution of epitope-tagged NIPA1 was determined
To determine the cellular consequences of HSP-associated NIPA1 mutations, we expressed epitope-tagged human NIPA1 constructs (C-terminal translational fusions with EGFP or HA) in heterologous and homologous cultured cells. Epitope tagging did not appear interfere with NIPA1 protein expression or trafficking. By confocal microscopy, we observed no apparent difference between the subcellular distribution of endogenous NIPA1 and transfected NIPA1::EGFP or NIPA1::HA. Similar to endogenous NIPA1 in primary cultured, neurons the epitope-tagged constructs localized primarily to cytoplasmic membrane including plasma membrane, the trans-Golgi complex (Fig. 3A–C), and ER (Fig. 4A–C) in HEK293T and COS7 cell lines (50 cells from each line were analyzed and no significant deviations from this pattern were observed). Partial colocalization of tagged NIPA1 with endosomal markers was also observed in a pattern essentially identical to that of the endogenous protein (Fig. 2F–J). We observed no apparent colocalization of NIPA1 with a marker of early endosomes, EAA1, or a late endosomal marker (mannose 6 phosphate receptor antibody; data not shown). In addition, we found that the expression of epitope-tagged NIPA1 in primary cortical rat neuronal cultures was similar to that of endogenous NIPA1 (data not shown).
Figure 3.

Mislocalization of mutant NIPA1. Expressed WT NIPA1::HA demonstrated marked colocalization with the trans-Golgi complex [A, anti-HA (red); B, Golgin 245-YFP (green); C, overlay; HEK293 cells shown]. D–I, Zoom of the Golgi complex. Expressed mutant form G106R of NIPA1::HA resulted in only partial overlap with Golgi markers with additional presence of the mutant protein outside the Golgi complex (G–I). Golgi complex in cells expressing mutant forms of NIPA1 was typically thinner than in cells expressing WT NIPA1. Mutation T45R had the same effect on NIPA1 intracellular trafficking.
Figure 4.
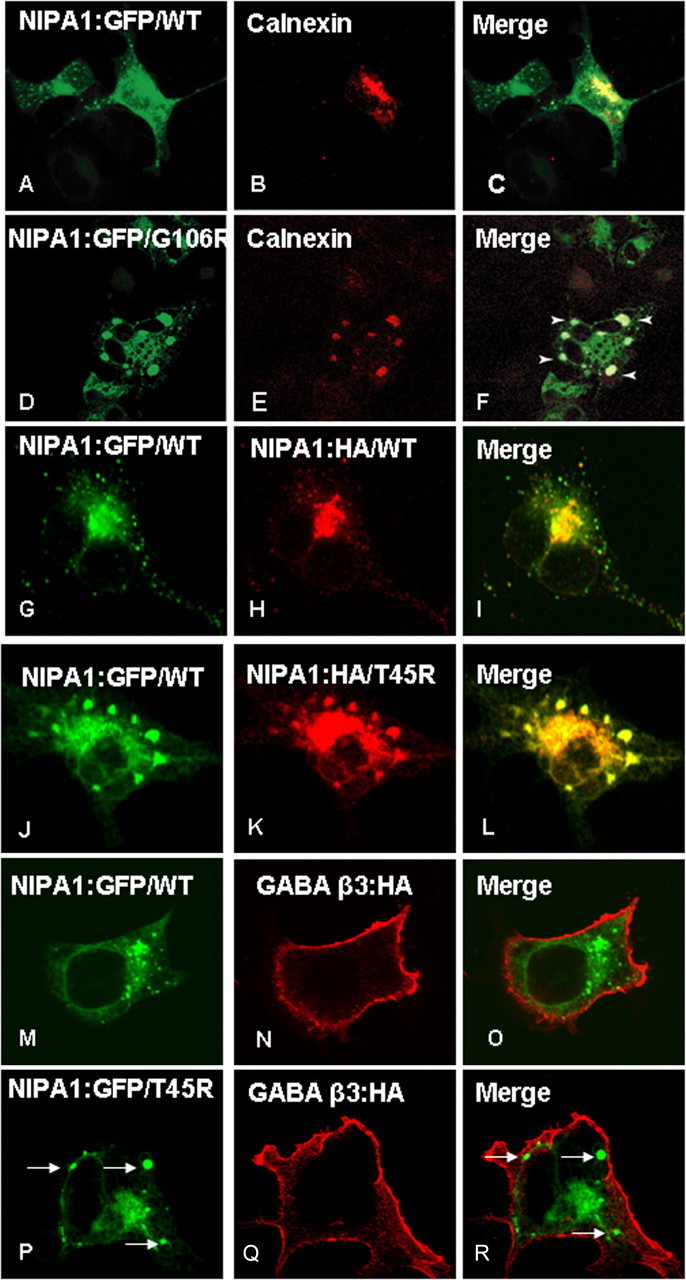
Endoplasmatic reticulum accumulation of mutant NIPA1. Overexpression of WT NIPA1::EGFP (A) shows a diffuse presence in the ER, which was visualized by ER marker anti-calnexin antibodies (B; C, overlay). Expression of a mutant NIPA1::EGFP (G106R mutation shown, D) resulted in the accumulation in ER, anti-calnexin antibodies (E; F, overlay) (arrowheads indicate NIPA1+ aggregates). The ER was abnormal with the presence of cystic structures. Overexpression in a “heterozygous state” showed that both WT and mutant forms of protein colocalized in ER. G–I show a control experiment with heterozygous expression of NIPA1::EGFP (G) and NIPA1:HA (H; I, merge), which did not show any effect of expressing both forms of the tagged protein on its localization. J–L show the expression of a mixture of WT and T45R, resulting in an alteration of WT NIPA1 subcellular localization, including sequestration in ER aggregates (J, WT NIPA1::EGFP; K, NIPA1T45R::HA; L, merge); G106R mutations had essentially an identical effect on WT NIPA1 protein (data not shown). The presence of mutant NIPA1 accumulation in ER (P–R, arrows indicate NIPA1 accumulation) did not affect the cell surface trafficking of the β-3 subunit of GABAA receptor; M–O shows the same GABA protein in the presence of WT NIPA1.
HSP-associated mutations alter the subcellular distribution of WT NIPA1
Expression of tagged WT NIPA1 in parallel with NIPA1 containing the T45R or G106R mutations revealed a marked mutation-associated alteration in protein subcellular distribution and trafficking. In contrast to the predominant Golgi localization of WT NIPA1 (Fig. 3A–F), mutant NIPA1 displayed increased localization outside of the Golgi (Fig. 3G–I, T45R mutation had an identical pattern, data not shown). Fifty cells were analyzed for each studied mutation and 95% of cells showed this pattern; there was a tendency for thinner Golgi complex staining in cells that showed the signs of mislocalization of tagged NIPA1. Since both of the NIPA1 mutations were predicted to cause protein misfolding, we tested the hypothesis that altered cellular distribution reflects mutant NIPA1 accumulation in the ER by costaining for NIPA1 and the molecular chaperone, calnexin (Fig. 4A–C); all 100 cells analyzed had the same pattern. Consistent with this hypothesis, both mutations displayed clumping in the ER, which were typically enlarged in all 50 cells analyzed for each mutation (Fig. 4D–F; data not shown for the T45R mutation). Although COS7 cells were specifically chosen here to better illustrate subcellular compartmentalization, this pattern of expression was also observed in other cell hosts (data not shown). Interestingly, ER accumulation was evident even when mutant NIPA1 was expressed “heterozygously,” where an equimolar mixture of WT and mutant protein was cotransfected to mimic the hemizygous state of HSP patients. Whereas coexpression of WT NIPA1::EGFP along with WT NIPA1::HA did not alter the expression pattern of either tagged WT proteins in 100 analyzed cells (Fig. 4G–I), coexpression of WT NIPA1::EGFP with either of the HA-tagged mutants resulted in a striking change of WT distribution, with both forms exhibiting the pattern of expression observed with mutant NIPA1 expression alone in 100 analyzed cells (Fig. 4J–L) (G106R had essentially identical effects). We also attempted to analyze the mislocalization of mutant forms of NIPA1 by studying endoglycosylation pattern (endoglycosidase H as a marker of GC retention and peptide N-glycosidase-F as a marker of ER retention). NIPA1 is predicted by in silico analysis to be glycosylated; however, we did not see any changes in the protein mobility indicating that NIPA1 is not glycosylated in vivo (data not shown).
To determine whether the ER accumulation phenotype was specific for NIPA1 trafficking or was a generalized disruption of ER function, we analyzed the effect of ER NIPA1 accumulation on the trafficking of other proteins, which are not known to interact with NIPA1. We used the β3 subunit of the GABA type A (GABAA) receptor, which is efficiently trafficked to the cell surface without the presence of other GABAA receptor subunits. We observed a robust surface staining for the β3 GABAA receptor subunit in cells expressing both WT and mutant forms of NIPA1 (Fig. 4M–R, T45R mutation shown) (G106R had the same effect, data not shown). Fifty cells were analyzed for the WT and each mutant NIPA1 and this pattern was present in every cell. Surface GABAA receptor β3 subunit trafficking was disrupted only when transfected cells showed signs of apoptotic cell death (data not shown). These data suggest that accumulation of mutant NIPA1 in the ER does not globally disrupt trafficking of other proteins. This is also consistent with our observations that some WT or mutant NIPA1 is still trafficked to the cell surface as demonstrated by our flow cytometry experiments.
WT and mutant forms of NIPA1 oligomerize and are expressed equally in transfected heterologous cells
When coexpressed, accumulation of both WT and mutant NIPA1 protein in the ER suggested that WT and mutant NIPA1 proteins oligomerize. Coimmunoprecipitation experiments using anti-HA antibodies on lysates prepared from cells coexpressing WT NIPA1-HA and WT NIPA1-myc showed that NIPA1 protein did oligomerize. Additionally, the presence of HSP mutants did not affect the binding of WT NIPA1. Coimmunoprecipitation was similar for a “heterozygous” state of NIPA1WT::HA/NIPA1WT::myc (Fig. 5A, lanes 1 and 5), NIPA1WT::myc/NIPA1T45R::HA (Fig. 5A, lanes 2 and 6), or NIPA1WT::myc/NIPA1G106R::HA (Fig. 5A, lanes 3 and 7; lanes 4 and 8 are negative control lanes with empty vector transfection). The ratio of myc to HA signal did not significantly differ between WT and mutant forms (data not shown). We also confirmed that both WT and mutant proteins were expressed approximately equally after transfection with equimolar amounts of DNA using a “heterozygous” state consisting of 50% DNA of WT NIPA1 and mutant NIPA1 T45R or G106R (Fig. 5B; lanes 1 and 5 contained WT NIPA1 with an equimolar amount of HA and myc-tagged NIPA1; lanes 2 and 6 contained NIPA1 WT and T45R; lanes 3 and 7 contained NIPA1 and G106R; lanes 4 and 8 contained empty vector; B1 was stained with anti-myc antibodies, B2 was stained with anti-HA antibodies, and B3 and B4 were stained with anti-NIPA1 antibodies).
Figure 5.

Expression and trafficking of NIPA1. Coimmunoprecipitation of NIPA1::HA and NIPA1::myc using anti-HA antibodies showed similar amount of precipitated protein between the expressed mixture of NIPAWT::HA and NIPAWT::myc (A, lanes 1 and 5), NIPA1WT::myc and NIPA1T45R::HA (A, lanes 2 and 6), or NIPA1WT::myc and NIPA1G106R::HA (A, lanes 3 and 7; lanes 4 and 8 are negative control with empty vector transfection). The ratio of myc and HA signal did not significantly differ (plotting not shown). The amount of expressed in HEK293 cells did not differ between various tagging of WT NIPA1 (B, lanes 1 and 5 contain equimolar amounts of NIPA1WT::HA and NIPA1WT::myc), or between WT and mutant forms (lanes 2 and 6 contain NIPA1WT NIPA1WT::myc and NIPA1T45R::HA, lanes 3 and 7 NIPA1WT::myc and NIPA1G106R::HA, lanes 4 and 8 empty vector; B1 is stained with anti-myc antibodies, B2 with anti-HA antibodies, and B3 and B4 with anti-NIPA1 antibodies). The ratio of anti-HA, anti-myc, and anti-NIPA1 antibodies signal did not differ when corrected for actin load (plotting not shown). Representative flow cytometry frequency histograms of Alexa-647 (A647) fluorescence intensity for cells expressing NIPA1WT::HA (left), NIPA1T45R::HA (middle), or NIPA1G106R::HA (right) constructs and stained with the HA-A647 antibody (C). A representative histogram from mock transfected cells (white) was overlaid on each of the histograms from positively transfected cells (gray). Surface staining (i.e., without membrane permeabilization) is shown in the top row, and total cellular staining (i.e., after membrane permeabilization) is shown in the bottom row. The x-axis indicates arbitrary fluorescence units (log scale), and the y-axis indicates the number of cells. D, Plotting of cell surface localization using HA tagging and detected by flow cytometry. Data is normalized to the signal from WT NIPA1 protein. Surface signal was compared with a total signal, which paralleled the pattern of activity on the cell surface. Only the T45R mutation had a mild reduction of surface activity with normal total amount of protein (**p < 0.01 compared with the wild-type condition). E, Representative flow cytometry dot plots of cells expressing an equal mixture of NIPA1WT::myc and NIPA1WT::HA (left), NIPA1T45R::HA (middle), or NIPA1G106R::HA (right) constructs and stained with various combinations of A555- or A647-conjugated antibodies. In the first three rows, cells were stained with the MYC-A555 (Donor-A), HA-A555 (Donor-B), or HA-A647 (Acceptor) antibodies, illustrating that spectral compensation with respect to the FRET channel was performed appropriately. In the last two rows, cells were costained with the HA-A647 antibody and either the MYC-A555 (fourth row) or the HA-A555 (fifth row), allowing for FRET to be evaluated between MYC- and HA-tagged proteins or between HA-tagged proteins, respectively. The horizontal line in each panel indicates the FRET gate, such that <1% of cells were deemed FRET positive when stained with A555- or A647-conjugated antibodies individually (the percentage positive is shown in the top right of each panel).
Mutant NIPA1 displayed effectively intact trafficking to the cell surface without evidence for a dominant negative effect
WT NIPA1 demonstrated readily detectable expression at the plasma cell membrane of every cell type studied. Although by microscopy, mutant NIPA1 appeared to achieve WT levels of surface expression, quantification of these levels required other approaches. We used flow cytometry to analyze the surface levels of HA-tagged NIPA1 in HEK293T cells. We observed a mild reduction of trafficking of NIPA1 to the cell surface only for the T45R mutation with levels 78 ± 7% (p < 0.01; n = 20) normalized to the surface activity of WT NIPA1 (Fig. 5D). To determine whether the reduced surface levels of mutant NIPA1 arose from decreased levels of total NIPA1 protein, cells were permeabilized before staining and flow cytometry. Interestingly, total NIPA1 T45R expression levels were not significantly different from WT NIPA expression. Unchanged total expression in the context of slightly decreased surface expression, however, implied that the intracellular fraction of NIPA1 was slightly elevated by the T45R mutation, a finding consistent with the observed ER accumulation. For the NIPA1 G106R mutation, surface levels were 108 ± 10% (n = 20) of WT NIPA1, demonstrating that this mutant could also efficiently reach the cell surface without exerting any dominant negative effect. Additionally, we also investigated a possibility of negative dominant effect of mutant forms of NIPA1 on the trafficking of WT NIPA1 using a “heterozygous” state (transfection with a mixture of 0.5 μg of WT NIPA1-HA cDNA and 0.5 μg of NIPA1-HA T45R or G106R cDNA). Mutant and WT NIPA1 surface and total levels were relatively equivalent to results detected by analysis of a “homozygous” state (transfection with 1.0 μg of WT NIPA1-HA cDNA or mutant NIPA1-HA T45R or G106R cDNA) (data not shown). Together, these results suggested that the primary mechanism by which NIPA1 mutations supports HSP may depend less on an impact of mutations on the levels of surface expression, but more either through functional transport deficits or by cellular toxicity that arises from intracellular accumulation.
We also evaluated interactions of WT and mutant NIPA1 on the cell surface using fluorescent resonance energy transfer (FRET) experiments. HEK293T cells were transfected using a “heterozygous” state (transfection with a mixture of 0.5 μg of WT NIPA1::HA cDNA and 0.5 μg of WT NIPA1::myc cDNA, or 0.5 μg of cDNA WT NIPA1::myc and NIPA1::HA T45R or G106R cDNA). We did not observe any differences in FRET signal between WT NIPA1::HA and WT NIPA1::myc interactions, or between WT and either of the mutant forms, suggesting equal interactions in the presence of a mutant protein (Fig. 5E).
Mutant NIPA1 proteins triggered ER stress and cell death
Homologous (cultured cortical neurons) and heterologous cells overexpressing mutant NIPA1 constructs demonstrated a progressive pattern of cell death, not seen with expression of WT NIPA1. Loss of cells started ∼8 h after transfection, progressing to ∼50% cell death after 36 h, and reaching >90% cell death after 48 h. Very few cells were present in mutant NIPA1 cultures 80 h after transfection. Reducing the cDNA concentration used for transfection did not affect the rate of cell death, but did reduce transfection efficiency (data not shown), suggesting that even low levels of the mutant protein were highly toxic. Cells expressing mutant NIPA1 constructs displayed condensed DNA with a fragmented nuclear morphology, findings consistent with apoptotic cell death (Fig. 6A–C). Quantitation of cell death was achieved by manual cell counting and LDH assays (Fig. 6D) (HEK293 cells, LDH assay of cortical neurons showed essentially identical pattern), with both mutant NIPA1 T45R and G106R exhibiting patterns of toxicity. In addition, we found an elevation in the phosphorylated fraction of pancreatic ER kinase (Fig. 6E) and calnexin (Fig. 6F), consistent with an induction of ER stress and activation of the UPR by mutant NIPA1.
Figure 6.
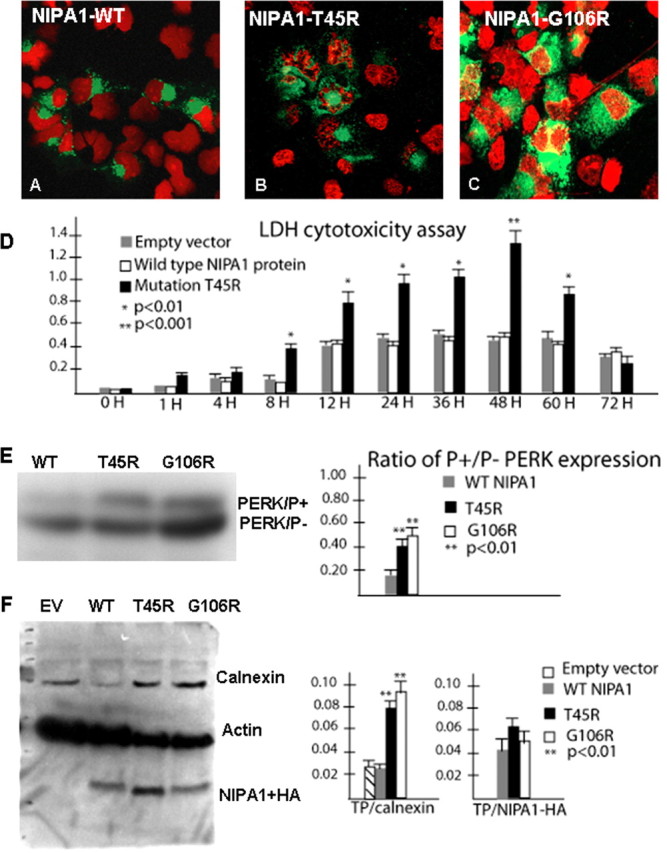
Mutant NIPA1 induces ER stress and program cell death. Transfection with wild-type NIPA1::EGFP showed normal nuclear structure (in red) after staining with 4′,6-diamidino-2-phenylindole dihydrochloride (A, EGFP signal indicated the transfection of the cell). Transfection with mutant T45R (B) and G106R (C) induced apoptotic cell death, indicated by a fragmented nuclear morphology caused by DNA condensation. D, The LDH-cytotoxicity assay performed on transfected HEK293 cells with WT NIPA1 and mutant (T45R) NIPA1 demonstrates a significant increase of released LDH from cells expressing mutant NIPA1 starting 8 h after the transfection and culminating between 48 and 60 h; the LDH levels dropped significantly 12 h later (gray bar, empty vector; white bar, WT NIPA1; and black bar, T45R mutation). More than 95% of transfected cells underwent apoptotic cells death 72 h after transfection. The survival of cells expressing the wild-type form of protein did not differ from cells transfected by an empty vector. The vertical axis shows values of the absorbance of the samples at 495 nm. Expression of the G106R mutation induced the comparable degree of programmed cell death (data not shown). We also assayed the markers of ER stress leading to the UPR and found a significantly increased ratio of phosphorylated pancreatic ER kinase (PERK) in the presence of either studied mutation (E; gray bar, WT NIPA1; black bar, T45R; and white bar, G106R mutation) and increased expression of calnexin [F, empty vector (EV)] compared with actin (TP). In both instances, the G106R mutation showed slightly higher activity of ER stress markers but it did not reach statistical significance.
Overexpression of the wild-type C. elegans NIPA1 homolog CeNIPA was not associated with any motor or cellular phenotype
A search of the C. elegans genome sequence (Wormbase) identified a highly conserved NIPA1 homolog encoded by the gene Y53G8B.4. In contrast to mammalian NIPA1 and NIPA2, C. elegans have only one homologous gene, which shares 40% identity with human NIPA1 [identities = 124/303 (40%), positives = 186/303 (61%), gaps = 20/303 (6%)] and 52% identity with NIPA2 [identities = 158/299 (52%), positives = 206/299 (68%), gaps = 29/299 (9%)] (supplemental Fig. 1, available at www.jneurosci.org as supplemental material). Hydropathy analysis predicted that this 388 aa protein had nine putative transmembrane domains and that the sites of HSP mutations were conserved with human NIPA1 and NIPA2. We renamed this gene homolog as CeNIPA reflecting its homology to both NIPA1 and NIPA2 human proteins. To determine the consequences of the equivalents of human HSP NIPA1 mutations, we expressed CeNIPA::EGFP using the F25B3.3 pan-neuronal promoter. The CeNIPA gene is somewhat atypical for nematode genes because of the size of the first intron, which spans >10 kb. This necessitated the use of a CeNIPA cDNA rather than the genomic sequence. Using this strategy, we achieved evident CeNIPA::EGFP expression in neurons of the head nerve ring and major nerve cords (Fig. 7A–C). It should be noted that overexpression of NIPA1::EGFP did not result in obvious behavioral or motor phenotypes and did not affect reproductive fitness of the animals (data not shown, 14 independent lines analyzed) [supplemental Movie 1 (normal motility after expression of CeNIPA(+) in a 9-d-old adult hermaphrodite), available at www.jneurosci.org as supplemental material].
Figure 7.
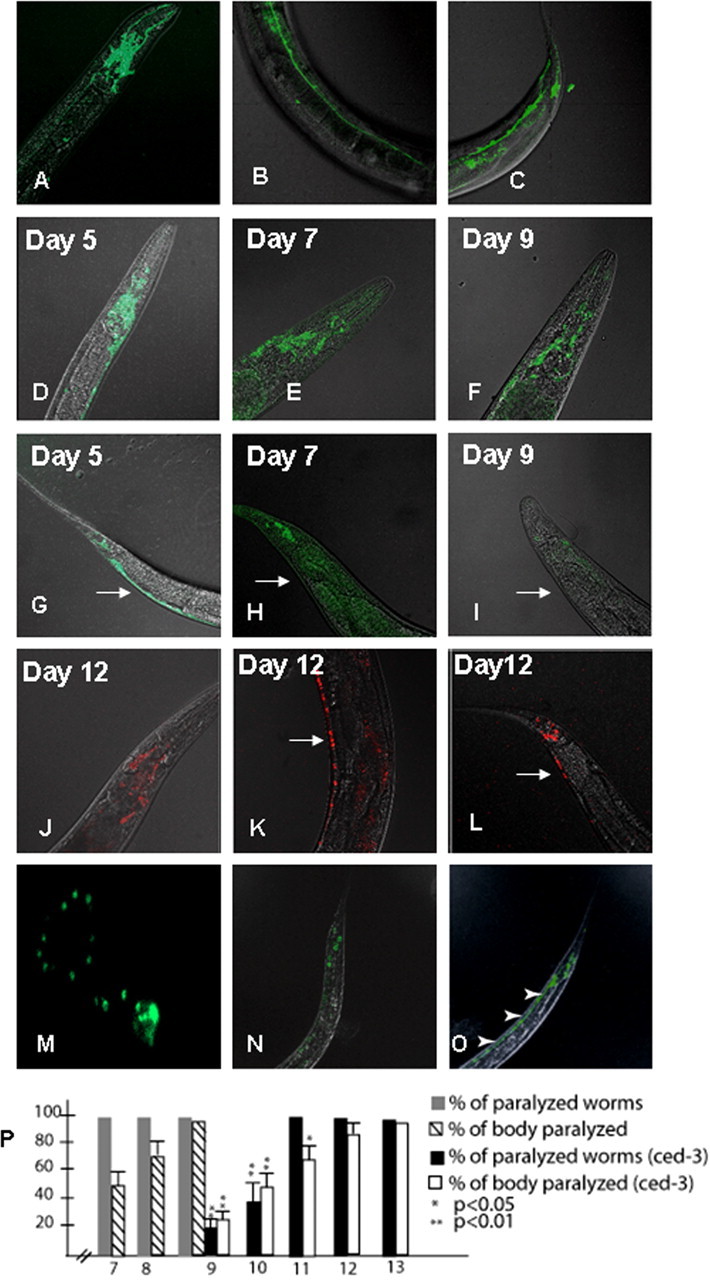
Expression of WT and mutant forms of CeNIPA. A–C, Expression of CeNIPAWT::EGFP driven by the F25B3.3 promoter with a strong presence of CeNIPA in the nerve ring/head and tail neurons, and in the ventral neuronal cord. D–I show progression of GFP signal loss in transgenic worms expressing T144R mutant CeNIPA. Five-day-old animals (D, G), which did not show any motor abnormalities, had a robust expression of CeNIPAT144R::EGFP in neurons of the pharyngeal nerve ring, ventral cord (arrow), and tail ganglia. Seven-day-old transgenic animals, which had signs of distal (tail) paralysis, had a loss of CeNIPAT144R::EGFP within the ventral cord (arrow) and showed reduction of expression in the head and tail regions (E, H). Nine-day-old transgenic nematodes, showing almost complete paralysis, had only a residual EGFP expression in the head and tail regions with the disappearance of signal from the ventral motor cord neurons (arrow) (F, I). Note also a wide, swollen tail (H, I), which was observed in paralyzed animals. Transgenic animals expressing S73R mutant CeNIPA had indistinguishable changes in GFP expression and motor paralysis phenotype (data not shown). Transgenic zcls4[HSP4::GFP]xbp-1(zc12);CeNIPA S37R::dsRED animals with a Xba-1 mutation showed no signs of neuronal loss and had normal motility and longevity (J–L); note the presence of red signal (dsRED) from neurons in the ventral motor cord thought out its course (arrow). M shows primary neuronal culture from transgenic C. elegans embryos expressing WT CeNIPA demonstrating the presence of CeNIPA GFP-positive structures, resembling pattern of expression in rat neuronal cell cultures. These structures are actively transported by unc-104 (homolog of kinesin heavy chain 1A or axonal transporter of synaptic vesicle precursor) and unc-104(e1265)−/−;CeNIPA::GFP (N) had GFP signal limited to cell bodies, and a loss axonal GFP, as was seen in animals expressing CeNIPA::GFP in a normal genetic background (O; arrowheads indicate GFP signal from axons in the ventral cord). P, Progression of paralysis of transgenic worms expressing mutant forms of CeNIPA expressed in a normal N2 background (days 7–9) and its significant delay in ced-3 animals (days 9–13) (gray bar, percentage of paralyzed worms expressing CeNIPA mutations on N2 background; striped bar, percentage of paralyzed body length on N2 background; black bar, percentage of paralyzed worms expressing CeNIPA mutations on ced-3 background; white bar, percentage of paralyzed body length on ced-3 background; *p < 0.05, **p < 0.01). Xba-1 worms did not show any signs of motor paralysis when CeNIPA S37R and T144R mutations were expressed.
CeNIPA::EGFP was axonally transported in an unc-104-dependent manner
Primary cell cultures obtained from CeNIPA::EGFP-expressing transgenic lines displayed a punctate pattern of EGFP expression localized to neuritic processes (Fig. 7M), as observed for human NIPA1 in rodent primary neuronal cultures. In contrast, soluble EGFP expression distributed diffusely throughout the cell soma cytoplasm (data not shown). Since NIPA1 colocalized with synaptic vesicle markers in rat cortical neurons (see above), we investigated whether NIPA1 localization to neuronal processes was achieved by synaptic vesicle transport machinery. UNC-104, which encodes a kinesin-like motor protein homologous to the axonal transporter of synaptic vesicle precursor (KIF1A) in man, is known to be required for anterograde transport of synaptic vesicle precursors in the nematode (Otsuka et al., 1991). We thus expressed CeNIPA::EGFP in an unc-104(e1265)−/− background and analyzed NIPA1 distribution and localization in relation to the N2 (WT) background. In contrast to transgenic N2 animals, where CeNIPA::EGFP was distributed in the cell soma and axons (Fig. 7O), CeNIPA::EGFP; unc-104(e1265)−/−animals displayed EGFP labeling only in the somata of neurons (Fig. 7N). These findings were consistent with an anterograde transport mechanism common to that used by synaptic vesicle proteins as required for the normal axonal localization of CeNIPA.
Overexpression of the human HSP mutations in the C. elegans NIPA1 homolog CeNIPA caused a progressive motor paralysis
To provide an in vivo opportunity to assess the functional impact of HSP-associated mutations, we generated and characterized nematode lines expressing CeNIPA::EGFP containing missense mutations analogous to the human HSP-associated mutations, T45R (S73R) and G106R (T144R). Transgenic worms expressing either the S73R or T144R mutation displayed normal motor development through early adulthood. However, changes in locomotor behavior were clearly evident by day 7, characterized by paralysis of the posterior half of the body in the context of normal head motility and feeding behavior [supplemental Movie 2 (paralysis of a distal half of the body in a 7-d-old nematode), available at www.jneurosci.org as supplemental material]. The paralyzed body section was also plump and swollen, in contrast to the normal appearance of the anterior end (supplemental Fig. 2A–C, available at www.jneurosci.org as supplemental material). Eight independently generated transgenic lines (four for each mutation) were analyzed, without noticeable variation in either the degree of paralysis or the temporal pattern of expression. We observed paralysis to progress in a posterior-anterior direction over the first 48 h [supplemental Movie 3 (progression of the paralysis toward the head in a 8-d-old nematode, the same animal shown), available at www.jneurosci.org as supplemental material] with virtually complete paralysis by day 9 [supplemental Movie 4 (almost complete paralysis in a 9-d-old nematode with intact feeding behavior, the same animal shown as in Movies 2, 3), available at www.jneurosci.org as supplemental material]. As noted above, at day 7, paralyzed body sections had a swollen appearance (supplemental Fig. 3C, available at www.jneurosci.org as supplemental material). More than 90% of transgenic animals expressing the HSP-associated mutations died by day 9, with the remainder dying by day 10. In contrast, transgenic animals expressing WT CeNIPA had the same life span and motility as N2 animals (data not shown)
The progression of motor paralysis in mutant NIPA1 transgenic nematodes was paralleled by reduced CeNIPA::EGFP expression in neurons of the nerve cords, tail, and to some degree in the pharyngeal ring as well. Mutant animals did not show any noticeable changes in the degree of EGFP expression on day 5, when they still had normal motor performance [Fig. 7D (ventral nerve cord and tail neurons), G (head neurons)]. However, on day 7, we observed a marked reduction in CeNIPA::EGFP expression in the tail neurons and adjacent ventral motor cord, paralleling the paralysis of the distal body (Fig. 7H). By day 9, only minimal CeNIPA::EGFP was observed in the nerve cords and neurons of the tail (Fig. 7I), with reduced expression also evident in the pharyngeal nerve ring (Fig. 7F). In contrast, 9-d-old animals expressing WT CeNIPA::EGFP showed normal locomotor movement, normal tail morphology, and strong EGFP expression in the nerve cords (Fig. 7A–C; supplemental Movie 1, supplemental Fig. 2A, available at www.jneurosci.org as supplemental material). We also generated double-transgenic animals using mutant CeNIPA PF25B3.3::dsRED;CeNIPAS73R or T144R::EGFP; a soluble EGFP was driven by the same promoter as CeNIPA to allow assessment of neurons without reliance on a CeNIPA fusion. The WT lines did not differ from tagged WT CeNIPA lines on an N2 background (data not shown).
Evidence for an apoptotic cascade supported the in vivo and in vitro phenotypes caused by HSP mutants in CeNIPA
Our in vitro studies with transfected mammalian cells indicated that cells expressing mutant NIPA1 exhibit ER stress and, ultimately, apoptosis. We sought to understand whether an apoptotic process supported the cellular and behavioral phenotypes of HSP-mutant CeNIPA nematodes. Thus, we expressed WT and mutant CeNIPA in an apoptosis-defective ced-3 (n717) background. Transgenic lines bearing mutant CeNIPA in the control background (N2) showed signs of motor paralysis with the same posterior-anterior progression and a similar cellular phenotype of gradual and temporally correlated loss of CeNIPA::EGFP-positive neurons as noted above. In contrast, transgenic CeNIPAS73R or T144R::EGFP;ced-3 lines demonstrated a noticeable delay of abnormalities. The first signs of paralysis were not observed in the latter animals until day 9, whereas the vast majority of CeNIPA mutant worms in the N2 background were already either completely paralyzed or dead (Fig. 7P). Mutant CeNIPA worms in the ced-3 background also displayed a less uniform progression of paralysis, and complete paralysis was not observed until days 12 and 13.
Primary neuronal cultures prepared from PF25B3.3:dsRED;CeNIPA::EGFP mutant lines generated in a normal genetic background were unsuccessful, as EGFP-labeled neurons did not survive >24 h. Furthermore, EGFP-labeled neurons examined at earlier times failed to differentiate as indicated by the elaboration of neuronal processes (Fig. 8A). In contrast, primary neuronal cultures using PF25B3.3::dsRED;CeNIPAS73R::EGFP;ced-3(n7127) or PF25B3.3::dsRED;CeNIPAT144R::EGFP;ced-3(n7127) lines were always successful, and neurons displayed a normal appearance until day 3, when we generally observed a reduction of CeNIPA::EGFP in axons. Morphologically, however, these axons appeared normal, as judged by the presence of PF25B3.3::dsRED signal (Fig. 8B–D). At day 5, we could no longer morphologically distinguish axonal processes in the mutant CeNIPA neurons, and these cells died 24–48 h later (Fig. 8E,F). In contrast, neurons expressing CeNIPAWT::EGFP, in both N2 and ced-3(n7127) backgrounds, had normal appearance and axonal morphology at 7 d or longer (Fig. 8G).
Figure 8.
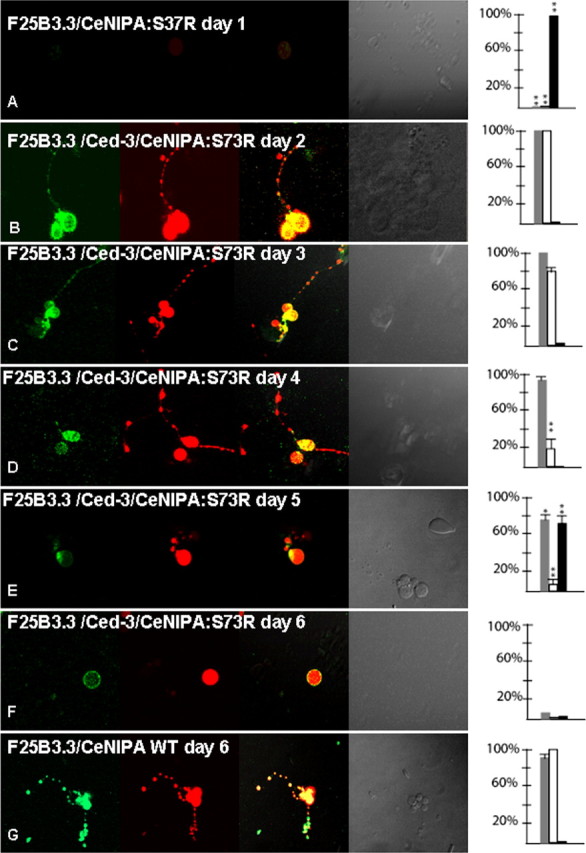
Neurodegeneration of C. elegans neurons expressing mutant forms of CeNIPA. Analysis of primary neuronal C. elegans cultures from double-transgenic animals PF25B3.3::dsRED;CeNIPAS73R::EGFP (A) or PF25B3.3::dsRED;CeNIPAS73R::EGFP;ced-3(n7127) (B–F), in which promoter-generated signal served as a marker of axonal structural integrity. The first column shows EGFP signal by CeNIPA, the second column dsRED signal driven by the F25B3.3 promoter, the third column merge images, the fourth column DIC images, and the fifth plotting of neuronal viability (gray bar shows percentage of viable neurons, white bar percentage of axons with preserved GFP signal, and black bar percentage of neurons undergoing axonal degeneration assessed by the presence of dsRED axonal signal, **p < 0.01). A shows nonviable CeNIPAS73R::EGFP without any differentiation on day 1. Neuronal cultures established from transgenic animals PF25B3.3::dsRED;CeNIPAS73R::EGFP;ced-3(n7127) were viable with a differentiation of neuronal processes and a strong CeNIPAS73R::EGFP signal until day 3 (B, C). The majority of neurons showed signs of reduced EGFP signal between days 3–4 but without signs of axonal structural disintegration as judged by dsRED signal (D). Cultured neurons underwent axonal degeneration (E) followed by neuronal death (F) with the majority of neurons losing viability on days 6 and 7. G shows an example of PF25B3.3::dsRED;CeNIPAWT::EGFP;ced-3(n7127) expressing a WT CeNIPA protein on day 6 with well differentiated axonal processes and strong presence of CeNIPA::EGFP-positive structures in axons. T144R mutations had essentially identical effect on survival and differentiation of neurons (data not shown).
The UPR played a critical role in development of the motor and cellular phenotypes caused by HSP mutations in CeNIPA
Transfected heterologous and homologous mammalian cell lines underwent apoptotic cell death, likely triggered by the UPR in the presence of mutant NIPA1 protein. In support of this, we asked whether mutants deficient in the UPR would rescue the motor paralysis phenotype induced by HSP mutations in CeNIPA. To this end, we selected a strain of C. elegans carrying a mutation in the xbp-1 gene, which have defective UPR (Calfon et al., 2002). CeNIPAS73R or WT::dsRED were expressed in C. elegans strain zcls4[HSP4::GFP]xbp-1(zc12) and transgenic animals were evaluated in the same manner as described above. Similar to other transgenic lines expressing WT CeNIPA, zcls4[HSP4::GFP]xbp-1(zc12);CeNIPAWT::dsRED animals were normal in terms of their survival, motor, and cellular phenotypes (data not shown). Furthermore, we have observed a complete rescue of the motor paralysis phenotype induced by mutant CeNIPA as zcls4[HSP4::GFP]xbp-1(zc12);CeNIPAS37R::dsRED animals did not show any signs of motor impairment and their longevity did not differ from N2 worms or zcls4[HSP4::GFP]xbp-1(zc12);CeNIPAWT::dsRED animals. Furthermore, the dsRED signal from neurons expressing CeNIPAS37R did not disappear as was observed in N2 or ced-3(n7127) worms expressing HSP CeNIPA mutations (Fig. 7J–L).
Discussion
Through a combination of Western blotting, immunohistochemistry, confocal imaging, and flow cytometry, we demonstrate that (1) the subcellular distribution of NIPA1 was more widespread than previously reported; (2) although the subcellular distribution of mutant NIPA1 was dramatically altered, these variants were still efficiently trafficked to the cell surface; (3) accumulation of mutant NIPA1 induced ER stress triggering UPR; (4) in vivo expression of a mutant nematode NIPA1 homolog displayed a progressive loss of motor neurons paralleled by paralysis; and (5) this motor deficit was attenuated by genetic elimination of the apoptotic caspase ced-3, and completely prevented by genetic elimination of the UPR.
NIPA1 mutations caused accumulation of mutant protein in the ER, causing ER stress and cell death
The overexpression of two mutant forms of NIPA1 had similar consequences, with apparent accumulation of mutant protein in the ER. Interestingly, ER accumulation was also reported by Goytain et al. (2007) although this was not concluded to be detrimental for cellular function or survival. However, this accumulation did not significantly reduce the trafficking of NIPA1 to the cell surface. This indicated that the majority of mutant NIPA1 was effectively trafficked, and its secretory pathway was not markedly altered. Our studies further documented a NIPA1-induced ER stress and triggering of the UPR. The observed cell death triggered by mutant NIPA1 was consistent with apoptotic cell death, likely induced by prolonged ER stress (Marciniak and Ron, 2006). To date, there are several well documented examples of neurodegenerative disease caused by longstanding ER stress, including GM1 gangliosidosis, neuronal ceroid lipofuscinosis, and an ataxic “woozy mouse” mutant (Tessitore et al., 2004; Zhao et al., 2005; Kim et al., 2006). In addition, this same mechanism has been implicated in more common neurodegenerative disorders such as Parkinson disease, Alzheimer disease, and amyotrophic lateral sclerosis (Ross and Poirier, 2005). While HSP has long been considered an example of a pure axonal degeneration, it should be noted that this idea has recently been challenged by evidence suggesting concomitant neurodegeneration. Whereas the extent of neuronal death in SPG6 is unknown, since human postmortem studies have not been performed, MRI morphometric analysis of the spinal cord from SPG6 patients showed profound spinal cord atrophy compared with other types of HSP (Hedera et al., 2005). These findings support a model of underlying loss of neurons that give rise to a loss of descending axons within the corticospinal tracts.
NIPA1 mutations caused an altered subcellular distribution of NIPA1
The studies of the subcellular distribution of endogenous NIPA1 protein revealed a more widespread distribution than previously reported (Goytain et al., 2007; Wang et al., 2007). Those studies were performed using COS7 cells (Goytain et al., 2007) or Drosophila ortholog (Wang et al., 2007). We studied the distribution of endogenous NIPA1 using mammalian brain tissue, and the results of cellular fractionation and immunocytochemistry showed a high degree of concordance. Patients with HSP caused by NIPA1 mutations, which is widely expressed also in non-neuronal tissues, do not manifest any additional abnormalities, and the clinical presentation of the disease is restricted to the CNS. Thus, it is conceivable that NIPA1 has additional functions in mammalian neurons, and our results arguing for more widespread subcellular localization may reflect this fact. Our findings also point to a presynaptic role for WT NIPA1 protein. Importantly, the distribution of endogenous and expressed WT NIPA1 did not differ significantly, supporting our conclusion that the abnormal distribution of the mutant forms was not an artifact of an overexpression system, but rather the deleterious impact of UPR.
CeNIPA mutations caused an anteriorly progressing paralysis when expressed in C. elegans
Loss of NIPA1-positive neurons coincided with a progressive motor paralysis in transgenic C. elegans expressing the equivalents of NIPA1 HSP mutations. Overexpression of NIPA1WT, in contrast, yields no observable motor or behavior phenotypes. The onset of motor paralysis appears in young adult animals that display otherwise normal development and motor abilities during larval growth. This suggests that mutant NIPA1 does not interfere with neuronal development, and that the motor phenotype in nematodes represents a gradual neurodegenerative process. The reasons for the anteriorly progressing motor paralysis and loss of neurons in this model is unclear, although it resembles the progression of human disease seen in SPG6 and other types of HSP, where motor function derived the longest axons is affected earliest. Possibly these axons require a more significant extent of axonal transport that is disrupted as an early feature of the UPR in neurons.
What is the most likely mechanism of NIPA1-related neurodegeneration?
NIPA1 has been proposed to function as a magnesium transporter, and mutations could cause HSP by impairing magnesium transfer (Goytain et al., 2007). However, our data suggests a distinct mechanism for toxicity likely derived from the UPR. Our data are difficult to reconcile with a haploinsufficiency mechanism, as total cellular expression levels were not altered by either of the NIPA1 mutations. This idea is consistent with clinical observations of patients with deletion of 15q11 who are hemizygous for the NIPA1 gene. In contrast to HSP patients, neither Angelman nor Prader-Willie patients exhibit spasticity, as might be expected if reduced levels of NIPA1 protein were detrimental for axonal maintenance (Chai et al., 2003).
Mutant forms of NIPA1 protein could also exhibit a negative dominant effect on WT NIPA1. A murine equivalent of the human NIPA1 mutation, T45R, was found to reduce magnesium transport by only 30% in vitro, and the protein trafficked to the cell surface, with a modest reduction of NIPA1 staining (Goytain et al., 2007). In contrast, a murine equivalent of the G106R human mutation resulted in a complete absence of magnesium transport, with no staining observed at the cell surface (Goytain et al., 2007). These findings would, however, imply that each of these mutations cause SPG6 by distinct mechanisms because each mutation had very different effects on the surface trafficking and magnesium transport. Our data do not support abnormal trafficking of mutant forms to the cell surface because the quantification of NIPA1 density on the cell surface by flow cytometry showed only a modest reduction for T45R mutation and did not show any significant differences for the G106R mutation. Furthermore, we did not detect a negative dominant effect on WT NIPA1 trafficking. Mutant forms of NIPA1 can also exhibit a negative dominant effect on the functional properties of WT magnesium transporter. However, it seems difficult to reconcile these findings with simple deficits in magnesium transport because T45R mutation did not significantly alter the magnesium transport (Goytain et al., 2007). Thus, this data together with our C. elegans experiments support the importance of a toxic gain of function.
Wang et al. (2007) studied mutations in the Drosophila NIPA1 ortholog spichthyin, which caused altered microtubular dynamics and abnormal axonal transport. This is very intriguing because disruption of axonal transport has been suggested as one of the main mechanisms of HSP (Crosby and Proukakis, 2002; Reid, 2003). However, the generated spichthyin mutations consisted of large deletions, while we studied HSP missense mutations. Thus, it is likely that the differences in the observed motor phenotypes between Drosophila and C. elegans model organisms are due to the diverse nature of introduced mutations in NIPA1 orthologs. However, we did not observe any obvious motor or cellular phenotype after overexpression of WT NIPA1, while overexpression of spichthyin inhibited BMP signaling, resulting in defects of axonal transport. The reasons for these differences are unclear at present, and a potential role of NIPA1 in regulations of microtubules and its contribution to HSP pathogenesis deserves further studies.
Modification of the genetic background of C. elegans significantly altered the cellular and motor phenotype caused by CeNIPA HSP mutations
Our in vitro data indicated that neurodegenerative effects of mutant NIPA1 appeared to arise from activation of an apoptotic program, triggered by the UPR. We observed a significant delay in the onset of motor paralysis and neuronal degeneration when mutant NIPA1 was expressed in a caspase (ced-3)-deficient background, which is resistant to apoptosis (Ellis and Horvitz, 1986; Aravind et al., 2001). Ced-3 nematodes showed significant delay in the onset of motor paralysis and the course of posterior-anterior neuronal loss was also slower than in C. elegans with normal apoptotic response. The effect of abolished UPR in C. elegans was even more striking, and the xbp-1 mutant strain, which is unable to trigger UPR (Calfon et al., 2002), was completely resistant to the effects of mutant CeNIPA. The absence of any observable motor paralysis and neuronal loss in xbp-1 mutant worms in the presence of mutant CeNIPA also argues against the possibility of a dominant-negative effect of CeNIPA HSP mutations. Inhibition of the activation of the proapoptotic processes is the main defect of the xbp-1(zc12) C. elegans strain, and the apparent neuroprotective effect in the presence of mutant CeNIPA supports that a toxic gain of function is the main consequence of HSP mutations in this protein. Together, our studies suggest that therapeutic strategies for carriers of these NIPA1 mutations may best orient toward diminishing toxic NIPA1 protein accumulation or their impact, as opposed to elevating NIPA1 function.
Footnotes
This work was supported by National Institutes of Health (NIH) Grant K08NS42743 and by the Spastic Paraplegia Foundation to P.H. D.S.M. and R.D.B. are supported by NIH Grant R37MH073159. We gratefully acknowledge the use of the Worm Core Facility of the Center for Molecular Neuroscience (Vanderbilt University Medical Center) and the Vanderbilt University Medical Center Cell Imaging Core Resource. The Vanderbilt University Medical Center Cell Imaging Core Resource is supported by NIH Grants CA68485 and DK20593.
References
- Aravind L, Dixit VM, Koonin EV. Apoptotic molecular machinery: vastly increased complexity in vertebrates revealed by genome comparisons. Science. 2001;291:1279–1284. doi: 10.1126/science.291.5507.1279. [DOI] [PubMed] [Google Scholar]
- Brenner S. The genetics of Caenorhabditis elegans. Genetics. 1974;77:71–94. doi: 10.1093/genetics/77.1.71. [DOI] [PMC free article] [PubMed] [Google Scholar]
- Calfon M, Zeng H, Urano F, Till JH, Hubbard SR, Harding HP, Clark SG, Ron D. IRE1 couples endoplasmic reticulum load to secretory capacity by processing the XBP-1 mRNA. Nature. 2002;415:92–96. doi: 10.1038/415092a. [DOI] [PubMed] [Google Scholar]
- Chai JH, Locke DP, Greally JM, Knoll JH, Ohta T, Dunai J, Yavor A, Eichler EE, Nicholls RD. Identification of four highly conserved genes between breakpoint hotspots BP1 and BP2 of the Prader-Willi/Angelman syndromes deletion region that have undergone evolutionary transposition mediated by flanking duplicons. Am J Hum Genet. 2003;73:898–925. doi: 10.1086/378816. [DOI] [PMC free article] [PubMed] [Google Scholar]
- Chen S, Song C, Guo H, Xu P, Huang W, Zhou Y, Sun J, Li CX, Du Y, Li X, Liu Z, Geng D, Maxwell PH, Zhang C, Wang Y. Distinct novel mutations affecting the same base in the NIPA1 gene cause autosomal dominant hereditary spastic paraplegia in two Chinese families. Hum Mutat. 2005;25:135–141. doi: 10.1002/humu.20126. [DOI] [PubMed] [Google Scholar]
- Christensen M, Estevez A, Yin X, Fox R, Morrison R, McDonnell M, Gleason C, Miller DM, 3rd, Strange K. A primary culture system for functional analysis of C. elegans neurons and muscle cells. Neuron. 2002;33:503–514. doi: 10.1016/s0896-6273(02)00591-3. [DOI] [PubMed] [Google Scholar]
- Crosby AH, Proukakis C. Is the transportation highway the right road for hereditary spastic paraplegia? Am J Hum Genet. 2002;71:1009–1016. doi: 10.1086/344206. [DOI] [PMC free article] [PubMed] [Google Scholar]
- Deluca GC, Ebers GC, Esiri MM. The extent of axonal loss in the long tracts in hereditary spastic paraplegia. Neuropathol Appl Neurobiol. 2004;30:576–584. doi: 10.1111/j.1365-2990.2004.00587.x. [DOI] [PubMed] [Google Scholar]
- Dye BT, Schell K, Miller DJ, Ahlquist P. Detecting protein-protein interaction in live yeast by flow cytometry. Cytometry A. 2005;63:77–86. doi: 10.1002/cyto.a.20112. [DOI] [PubMed] [Google Scholar]
- Ellis HM, Horvitz HR. Genetic control of programmed cell death in the nematode C. elegans. Cell. 1986;44:817–829. doi: 10.1016/0092-8674(86)90004-8. [DOI] [PubMed] [Google Scholar]
- Ferguson SM, Savchenko V, Apparsundaram S, Zwick M, Wright J, Heilman CJ, Yi H, Levey AI, Blakely RD. Vesicular localization and activity-dependent trafficking of presynaptic choline transporters. J Neurosci. 2003;23:9697–9709. doi: 10.1523/JNEUROSCI.23-30-09697.2003. [DOI] [PMC free article] [PubMed] [Google Scholar]
- Fink JK. Hereditary spastic paraplegia. Curr Neurol Neurosci Rep. 2006;6:65–76. doi: 10.1007/s11910-996-0011-1. [DOI] [PubMed] [Google Scholar]
- Fire A, Kondo K, Waterson R. Vectors for low copy transformation of C. elegans. Nucleic Acids Res. 1990;25:4269–4270. doi: 10.1093/nar/18.14.4269. [DOI] [PMC free article] [PubMed] [Google Scholar]
- Goytain A, Hines RM, El-Husseini A, Quamme GA. NIPA1 (SPG6), the basis for autosomal dominant form of hereditary spastic paraplegia, encodes a functional Mg2+ transporter. J Biol Chem. 2007;282:8060–8068. doi: 10.1074/jbc.M610314200. [DOI] [PubMed] [Google Scholar]
- Hedera P, Eldevik OP, Maly P, Rainier S, Fink JK. Magnetic resonance imaging analysis of the spinal cord atrophy in autosomal dominant hereditary spastic paraplegia. Neuroradiology. 2005;47:730–734. doi: 10.1007/s00234-005-1415-3. [DOI] [PubMed] [Google Scholar]
- Jin Y. Transformation. In: Hope IA, editor. C. elegans: a practical approach. New York: Oxford UP; 1999. pp. 69–95. [Google Scholar]
- Kaneko S, Kawarai T, Yip E, Salehi-Rad S, Sato C, Orlacchio A, Bernardi G, Liang Y, Hasegawa H, Rogaeva E, St George-Hyslop P. Novel SPG6 mutation p.A100T in a Japanese family with autosomal dominant form of hereditary spastic paraplegia. Mov Disord. 2006;21:1531–1533. doi: 10.1002/mds.21005. [DOI] [PubMed] [Google Scholar]
- Kim SJ, Zhang Z, Hitomi E, Lee YC, Mukherjee AB. Endoplasmic reticulum stress-induced caspase-4 activation mediates apoptosis and neurodegeneration in INCL. Hum Mol Genet. 2006;15:1826–1834. doi: 10.1093/hmg/ddl105. [DOI] [PubMed] [Google Scholar]
- Marciniak SJ, Ron D. Endoplasmic reticulum stress signaling in disease. Physiol Rev. 2006;86:1133–1149. doi: 10.1152/physrev.00015.2006. [DOI] [PubMed] [Google Scholar]
- Otsuka AJ, Jeyaprakash A, García-Añoveros J, Tang LZ, Fisk G, Hartshorne T, Franco R, Born T. The C. elegans unc-104 gene encodes a putative kinesin heavy chain-like protein. Neuron. 1991;6:113–122. doi: 10.1016/0896-6273(91)90126-k. [DOI] [PubMed] [Google Scholar]
- Rainier S, Chai JH, Tokarz D, Nicholls RD, Fink JK. NIPA1 gene mutations cause autosomal dominant hereditary spastic paraplegia (SPG6) Am J Hum Genet. 2003;73:967–971. doi: 10.1086/378817. [DOI] [PMC free article] [PubMed] [Google Scholar]
- Reed JA, Wilkinson PA, Patel H, Simpson MA, Chatonnet A, Robay D, Patton MA, Crosby AH, Warner TT. A novel NIPA1 mutation associated with a pure form of autosomal dominant hereditary spastic paraplegia. Neurogenetics. 2005;6:79–84. doi: 10.1007/s10048-004-0209-9. [DOI] [PubMed] [Google Scholar]
- Reid E. Science in motion: common molecular pathological themes emerge in the hereditary spastic paraplegias. J Med Genet. 2003;40:81–86. doi: 10.1136/jmg.40.2.81. [DOI] [PMC free article] [PubMed] [Google Scholar]
- Ross CA, Poirier MA. Opinion: what is the role of protein aggregation in neurodegeneration? Nat Rev Mol Cell Biol. 2005;6:891–898. doi: 10.1038/nrm1742. [DOI] [PubMed] [Google Scholar]
- Soderblom C, Blackstone C. Traffic accidents: molecular genetic insights into the pathogenesis of the hereditary spastic paraplegias. Pharmacol Ther. 2006;109:42–56. doi: 10.1016/j.pharmthera.2005.06.001. [DOI] [PubMed] [Google Scholar]
- Tessitore A, del P Martin M, Sano R, Ma Y, Mann L, Ingrassia A, Laywell ED, Steindler DA, Hendershot LM, d'Azzo A. GM1-ganglioside-mediated activation of the unfolded protein response causes neuronal death in a neurodegenerative gangliosidosis. Mol Cell. 2004;15:753–766. doi: 10.1016/j.molcel.2004.08.029. [DOI] [PubMed] [Google Scholar]
- Wang X, Shaw WR, Tsang HTH, Reid E, O'Kane CJ. Drosophila spichthyin inhibits BMP signaling and regulates synaptic growth and axonal microtubules. Nat Neurosci. 2007;10:177–185. doi: 10.1038/nn1841. [DOI] [PMC free article] [PubMed] [Google Scholar]
- Wharton SB, McDermott CJ, Grierson AJ, Wood JD, Gelsthorpe C, Ince PG, Shaw PJ. The cellular and molecular pathology of the motor system in hereditary spastic paraparesis due to mutation of the spastin gene. J Neuropathol Exp Neurol. 2003;62:1166–1177. doi: 10.1093/jnen/62.11.1166. [DOI] [PubMed] [Google Scholar]
- Zhao L, Longo-Guess C, Harris BS, Lee JW, Ackerman SL. Protein accumulation and neurodegeneration in the woozy mutant mouse is caused by disruption of SIL1, a cochaperone of BiP. Nat Genet. 2005;37:974–979. doi: 10.1038/ng1620. [DOI] [PubMed] [Google Scholar]
- Züchner S. The genetics of hereditary spastic paraplegia and implications for drug therapy. Expert Opin Pharmacother. 2007;8:1433–1439. doi: 10.1517/14656566.8.10.1433. [DOI] [PubMed] [Google Scholar]