

Abstract
It is well known that ethanol preexposure sensitizes the liver to LPS hepatotoxicity. The mechanisms by which ethanol enhances LPS-induced liver injury are not completely elucidated but are known to involve an enhanced inflammatory response. Ethanol exposure also increases the metabolic rate of the liver, and this effect of ethanol on liver is mediated, at least in part, by the sympathetic hormone, epinephrine. However, whether or not the sympathetic nervous system also contributes to the sensitizing effect of ethanol preexposure on LPS-induced liver damage has not been determined. The purpose of this study was therefore to test the hypotheses that 1) epinephrine preexposure enhances LPS-induced liver damage (comparable to that of ethanol preexposure) and that 2) the sympathetic nervous system contributes to the sensitizing effect of ethanol. Accordingly, male C57BL/6J mice were administered epinephrine for 5 days (2 mg/kg per day) via osmotic pumps or bolus ethanol for 3 days (6 g/kg per day) by gavage. Twenty-four hours later, mice were injected with LPS (10 mg/kg ip). Both epinephrine and ethanol preexposure exacerbated LPS-induced liver damage and inflammation. Concomitant administration of propranolol with ethanol significantly attenuated the sensitizing effect of ethanol on LPS-induced liver damage. These data support the hypothesis that the sympathetic nervous system contributes, at least in part, to the mechanism of the sensitizing effect of ethanol. These results also suggest that sympathetic tone may contribute to the initiation and progression of alcoholic liver disease.
Keywords: adrenaline, endotoxemia, two-hit model, hepatotoxicity
It is now well understood that stimuli before an inflammatory insult can alter the response of liver to that second insult. For example, some preexposures protect liver against inflammatory liver injury (e.g., ischemic preconditioning) (27). Conversely, hepatic steatosis exacerbates inflammatory liver injury caused by a second hit, such as LPS (30). There are also preexposures that both blunt and enhance hepatotoxicity owing to a second insult, depending on the amount of time that passes between these two events. For example, bolus ethanol administered within a few hours before LPS injection has been shown to protect liver from LPS-induced hepatotoxicity in rats and mice (11, 20). In contrast, the same bolus dose of ethanol enhances liver damage if administered 24 h before LPS (i.e., “priming”) (11). Although the mechanisms of this temporal pleiotropism of ethanol on liver injury owing to LPS are not completely elucidated, they appear to involve, at least in part, alterations of the macrophage-mediated response to LPS (10, 13, 14).
Another important component in the host response to LPS-induced stress is the sympathetic nervous system. For example, sympathetic hormones protect the host against vasoactive shock induced by severe sepsis/endotoxemia (19). In addition to systemic protection against LPS, adrenergic stimulation has also been shown to negatively regulate inflammation via increasing IL-10 and decreasing TNF-α production (7, 18). There is evidence suggesting that ethanol and the sympathetic nervous system interact with and partially mimic each other. For example, acute alcohol intoxication increases plasma levels of adrenaline and noradrenaline (15). Furthermore, ethanol causes a hypermetabolic state in liver that is abolished by adrenalectomy or by adrenoceptor blockade (5, 31). Repeated administration of ethanol to rats has also been shown to increase plasma catecholamines and gene expression of enzymes for catecholamine synthesis in the adrenal medulla (23).
Although these links between the metabolic effects of ethanol and epinephrine are known, whether or not epinephrine contributes to the sensitizing effect of ethanol preexposure to LPS has not been studied. In contrast, most studies have focused on the effects of epinephrine during concomitant exposure to LPS and not with epinephrine preexposure (7, 18). The latter paradigm has clinical relevance in sepsis/endotoxemia after a stressful event that stimulates the sympathetic nervous system. In the present study, it was hypothesized that 1) preexposure to epinephrine, similar to ethanol, will enhance endotoxin-induced inflammation and that 2) the sympathetic nervous system contributes to the sensitizing effect of ethanol. These hypotheses were tested in a mouse model of bolus LPS-induced liver injury.
MATERIALS AND METHODS
Animals and treatments
Male C57BL/6J mice (4–6 wk) were purchased from Jackson Laboratory (Bar Harbor, ME). Mice were housed in a pathogen-free barrier facility accredited by the Association for Assessment and Accreditation of Laboratory Animal Care, and procedures were approved by the University of Louisville Institutional Animal Care and Use Committee. Food and tap water were adlibitum. Doses of drugs/toxins administered are all based on published studies (32) and were validated by pilot experiments in this laboratory. Mice were administered epinephrine (2 mg/kg per day sc, in saline) via an osmotic pump (Alzet, Cupertino, CA) surgically implanted in the dorsal area of the mice. The control group underwent sham surgery. Owing to the very short half-life of epinephrine, the hormone was infused instead of injected to maintain a low-grade elevated plasma level over a prolonged period, which better mimics the effect of ethanol (15). Another group of mice was administered bolus ethanol (6 g/kg per day ig) or isocaloric maltose/dextrin for 3 days. Additionally, some mice received either (S)-(-)- propranolol (30 mg/kg per day ip; Sigma-Aldrich, St. Louis, MO) or vehicle (acidified saline) 30 min before every ethanol gavage. Five days after pump implantation or 24 h after the last gavage of ethanol, mice were injected with a bolus dose of LPS (10 mg/kg ip) or vehicle (saline). All concentrations were based on literature. Later (1,8, and 24 h) after LPS exposure, mice were anesthetized by injection of a ketamine HCl/xylazine solution (100/15 mg/kg im, Sigma-Aldrich). Blood was collected from the vena cava just before euthanasia by exsanguination, and citrated plasma was stored at −80°C for further analysis. Portions of liver tissue were frozen immediately in liquid nitrogen, whereas others were fixed in 10% neutral buffered formalin or frozen-fixed for subsequent sectioning and mounting on microscope slides.
Clinical analyses and histology
Plasma levels of aminotransferases (AST) were determined with standard kits (Thermotrace, Melbourne, Australia). Paraffin sections of liver (5 µm) were stained with hematoxylin and eosin (H+E). Neutrophil accumulation in the livers was assessed by staining tissue sections for chloroacetate esterase, a marker for neutrophils, using the napthol AS-D chloroacetate esterase kit (Sigma) (12). Apoptosis was assessed by TdT-mediated dUTP nick-end labeling (TUNEL) employing a commercially available kit (Chemicon, Temecula, CA). TUNEL-positive nuclei and chloroacetate esterase staining (CAE)-positive cells were quantitated by counting (per 1,000 hepatocytes) in randomly selected fields (×400 final magnification). Pathology was scored in a blinded manner by a trained pathologist by counting the number of necrotic or inflammatory foci in a low power (×40) field; the maximal score was 4.
RNA isolation and real-time RT-PCR
Total RNA was extracted from liver tissue samples by a guanidium thiocyanate-based method (Tel-Test, Austin, TX). RNA concentrations were determined spectrophotometrically, and 1 µg total RNA was reverse transcribed using an apical membrane vesicle reverse transcriptase kit (Promega, Madison, WI) and random primers. Polymerase chain reaction was carried out as described previously (3). Primers were either designed using Primer 3 (Whitehead Institute for Biomedical Research, Cambridge, MA; see Table 1) or purchased from Applied Biosystems [Foster City, CA; suppressor of cytokine signaling (SOCS-1), SOCS-3, IL-10 and IL-6]. The comparative cycle threshold method was used to determine fold differences between samples, and the purity of PCR products was verified by gel electrophoresis.
Table 1.
Primers and probes used for real-time RT-PCR detection of expression
| Forward (3′−5′) | Reverse (3′−5′) | Probe (3′−5′) | |
|---|---|---|---|
| PAI-1 | CTCCGCCCTCACCAACATAT | CAGGCATGCCCAACTTCTCC | CCAGGCTGCCCCGCCTCC TC |
| TNF-α | CATCTTCTCAAAATTCGACTGACA | CCTCCACTTGGTGGTTTGCT | CCTGTAGCCCACGTCG |
| β-actin | GGCTCCCAGCACCATGAA | AGCCACCGATCCACACAGA | AAGATCATTGCTCCTCCTGAGCGCAAGTA |
PAI-1, plasminogen activator inhibitor 1.
Immunoblots
Frozen liver samples were homogenized in radioimmunoprecipitation assay buffer [20 mM MOPS (pH 7.0), 150 mM NaCl, 1 mM EDTA, 1% (vol/vol) Nonidet P-40, 1% (wt/vol) sodium deoxycholate, and 0.1% (wt/vol) SDS] containing protease, tyrosine phosphatase, and serine-threonine phosphatase inhibitor cocktails (Sigma). Protein concentrations were determined with the DC Protein Assay (Bio-Rad, Hercules, CA); appropriate amounts of total protein were mixed with 2× SDS sample loading buffer [125 mM Tris, 4% (wt/vol) glycine, 0.2% (wt/vol) bromophenol blue, and 10 mM DTT] and incubated at 95°C for 5 min. Samples were then loaded onto SDS-polyacrylamide gels containing 10% (wt/vol) acrylamide, followed by electrophoresis and Western blotting onto PVDF membranes (Amersham, Piscataway, NJ). Primary antibodies against phosphorylated and total JNK (Cell Signaling, Danvers, MA) were used. Horseradish peroxidase-coupled secondary antibodies and chemiluminescence detection reagents were from Pierce (Rockford, IL). The signals were detected employing Hyperfilm enhanced chemiluminescence (Amersham). Quantification was performed with Scion Image analysis software (Scion, Frederick, MD).
Myeloperoxidase activity assay
Mouse liver pieces were weighed and homogenized in 0.1 M potassium phosphate buffer, pH 6.0. Homogenates were centrifuged at 30,000 g for 60 min at 4°C. The resulting pellet was suspended in phosphate buffer containing 0.5% hexadecyltrimethylammonium bromide. Colorimetric assessment of enzyme activity was carried out employing a reaction buffer composed of 1.6 mM 3,3′,5,5′ tetramethylbenzidine and 0.1 M potassium phosphate buffer (pH 6.0) containing 0.1% DMSO and 3 mM hydrogen peroxide. Results were calibrated to purified myeloperoxidase (Sigma) and normalized to weight.
Statistical analyses
Results are reported as means ± SE (n = 4–6). ANOVA with Bonferroni’s post hoc test, or Mann-Whitney Rank Sum test were used for the determination of statistical significance among treatment groups, as appropriate. A P value <0.05 was selected before the study as the level of significance.
RESULTS
Epinephrine enhances LPS-induced liver damage similar to ethanol
The effect of epinephrine and ethanol preexposure on LPS-induced liver damage was assessed by H+E (Fig. 1; for pathology scores see Fig. 3) and (Fig. 2). Hepatic histology was normal in animals in the absence of epinephrine and LPS (Fig. 1 and Fig. 2, top, left, respectively; Fig. 3). Infusion of epinephrine for 5 days (in the absence of LPS injection) caused no dramatic changes in hepatic histology compared with controls (Fig. 3). As expected, injection of LPS caused mild inflammation (Fig. 1 and Fig. 2, middle left; Fig. 3, middle); in contrast, infusion with epinephrine dramatically enhanced liver damage caused by LPS with some necroinflammatory foci and enhanced neutrophil infiltration (Fig. 1 and Fig. 2, bottom, left; Fig. 3). No differences in parameters of liver damage were observed between chow-fed and maltose/dextrin-fed mice (e.g., AST ∼45 in controls and ∼110, 24 h after LPS injection); data with chow-fed mice are thus shown to represent both groups (Fig. 1–Fig. 6). Administration of ethanol dramatically enhanced LPS-induced liver damage (Fig. 1 and Fig. 2, top, right; Fig. 3), and this was blunted by propranolol (Fig. 1 and Fig. 2, middle, right; Fig. 3).
Fig. 1.
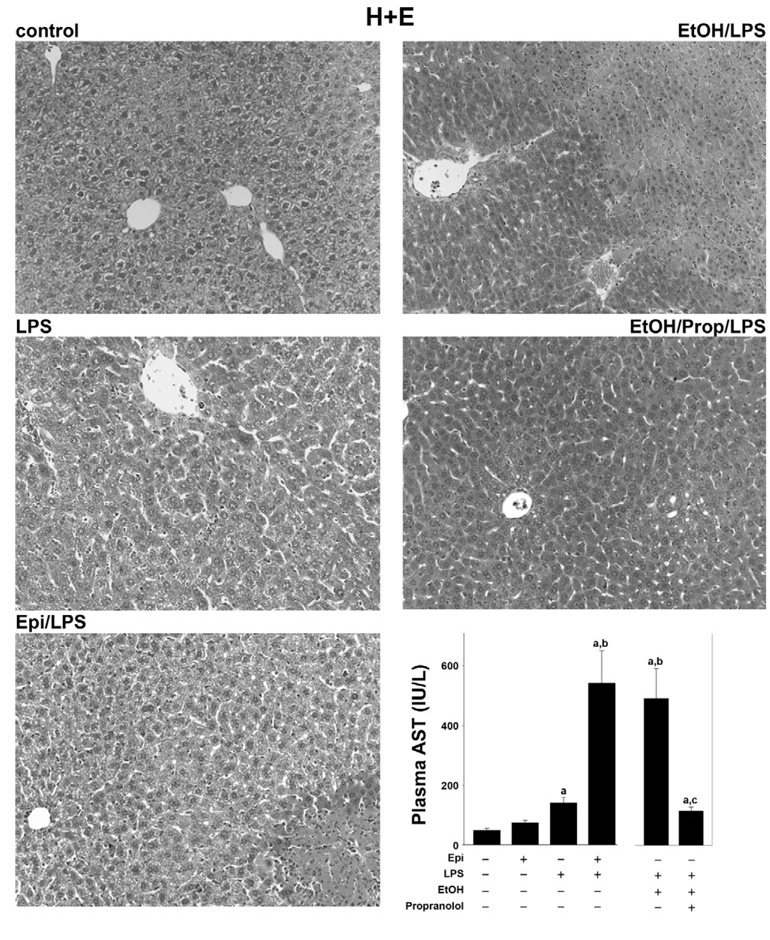
Effect of epinephrine and ethanol preexposure on liver histology caused by LPS. Male C57BL/6J mice were adminis-tered epinephrine (Epi) (2 mg/kg per day sc) for 5 days via osmotic pumps or ethanol (EtOH) (6 g/kg per day ig) for 3 days and then stimulated with a bolus injection of LPS (10 mg/kg ip). The effect of epinephrine or ethanol and LPS (24 h after injection) on liver histology was assessed by hematoxylin and eosin staining (H+E, ×200). Representative photomicrographs are shown. The bar diagram depicts the alterations in aminotransferases (AST) after each exposure. Data are means ± SE, n = 4–7. asignificant (P < 0.05) effect of LPS; bsignificant (P < 0.05) effect of epinephrine or ethanol; csignificant (P < 0.05) effect of propranolol (Prop).
Fig. 3.

Epinephrine and ethanol preexposure enhance inflammation and necrosis caused by LPS. Top and middle: scoring of necrotic and inflammatory areas as seen with H+E staining (24 h after LPS injection). Bottom: number of CAE-positive cells per 1,000 hepatocytes. Data are means ± SE, n = 4–7; asignificant (P < 0.05) effect of LPS; bsignificant (P < 0.05) effect of epinephrine or ethanol; csignificant (P < 0.05) effect of propranolol.
Fig. 2.

Effect of epinephrine and ethanol preexposure on markers of inflammation enhanced by LPS. The effect of epinephrine or ethanol and LPS (24 h after injection) on neutrophil accumulation was assessed by chloroacetate esterase staining (CAE, ×400). Representative photomicrographs are shown. The bar diagram shows hepatic MPO activity determined as described under MATERIALS AND METHODS. Data are means ± SE, n = 4–7; asignificant (P < 0.05) effect of LPS; bsignificant (P < 0.05) effect of epinephrine or ethanol; csignificant (P < 0.05) effect of propranolol. n.d., Not detectable.
Fig. 6.

Epinephrine blunts the increase in TdT-mediated dUTP nick-end labeling (TUNEL) staining caused by LPS. Markers of apoptosis were assessed by TUNEL staining (24 h after LPS injection). Representative photomicro graphs (×200) are shown. The bar diagram shows the number of TUNEL-positive cells per 1,000 hepatocytes. Data are means ± SE, n = 4–7; asignificant (P < 0.05) effect of LPS; bsignificant (P < 0.05) effect of epinephrine.
The above described effects of epinephrine and ethanol on hepatic injury caused by LPS were also reflected by plasma activity of transaminases (Fig. 1, bottom, right). Epinephrine infusion alone for 5 days did not significantly increase plasma AST levels compared with control animals. LPS alone progressively increased plasma transaminases, peaking 24 h after injection with values approximately twofold greater than control. Preexposure to epinephrine significantly enhanced the increase in AST caused by LPS by a factor of ∼4. Preexposure to ethanol enhanced LPS-induced increase in AST by a factor of ∼6, and administration of propranolol blunted the enhancing effect of ethanol. The increase in number of CAE-positive cells (Fig. 3, bottom) caused by LPS was significantly increased both by epinephrine and ethanol, and the effect of ethanol was blunted by propranolol. The infiltration of neutrophils was both sinusoidal and parenchymal with a ratio of ∼2 to 1. The increase in hepatic myeloperoxidase activity caused by LPS was enhanced to a similar extent as CAE-positive cells (Fig. 2, bottom, right).
Induction of TNF-α, IL-6, and PAI-1 after LPS exposure; effect of epinephrine preexposure
As mentioned above, concomitant administration of epinephrine and LPS is known to reduce the proinflammatory response caused by LPS (7,18). In contrast, the results shown here indicate that epinephrine exposure before LPS enhanced inflammatory liver damage (Fig. 2 and Fig. 3). The effect of LPS and epinephrine on the expression of key proinflammatory genes [TNF-α, IL-6, and plasminogen activator inhibitor 1 (PAI-1)] was therefore analyzed by realtime RT-PCR 1, 8, and 24 h after LPS injection (Fig. 4, left). The time points were selected by preliminary studies to represent early (1 h), intermediate (8 h), and late (24 h) induction responses to LPS. LPS alone stimulated the expression of all three genes as early as 1 h after injection; the expression of TNF-α and IL-6 decreased progressively after this time point, whereas the expression of PAI-1 continued to increase, peaking 8 h after injection. Although epinephrine pretreatment alone did not significantly affect the expression of any of these genes, it significantly enhanced the increase in expression of all three genes caused by LPS but with different patterns. Specifically, the induction of PAI-1 (Fig. 4, bottom, left) caused by LPS was already significantly enhanced greater than twofold by epinephrine already at the 1-h time point but not after 8 h. Whereas the peak expression of TNF-α (top, left) and IL-6 (middle, left) 1 h after LPS was not enhanced by epinephrine preexposure, the levels of these genes were significantly elevated compared with LPS alone at the 8-h time point. Twenty-four hours after LPS injection, all three mRNA levels were returning to basal levels with no significant difference between the LPS and the epinephrine/LPS groups.
Fig. 4.

Effect of epinephrine on the expression of inflammatory genes caused by LPS. Expression of hepatic mRNA was determined by real-time RT-PCR (see MATERIALS AND METHODS). Data are expressed as fold of sham (means ± SE, n = 6–9); asignificant (P < 0.05) effect of LPS; bsignificant (P < 0.05) effect of epinephrine. SOCS, suppressor of cytokine signaling; PAI-1, plasminogen activator inhibitor 1.
Induction of IL-10, SOCS-1, and SOCS-3 after epinephrine combined with LPS exposure
Enhancement of inflammation caused by LPS may be mediated not only by increasing the production of proinflammatory cytokines (Fig. 4, left), but also by impairing the expression of anti-inflammatory genes (25). The effect of epinephrine preexposure on the induction of key anti-inflammatory genes (IL-10, SOCS-1, and SOCS-3) in liver was therefore determined (Fig. 4, right). Epinephrine infusion alone had no significant effect on the expression of any of these genes compared with sham-treated controls. Injection of LPS caused an increase in all three parameters. The expressions of IL-10 and SOCS-3 were maximally induced by LPS 1 h after injection, whereas the induction of SOCS-1 peaked 8 h after LPS. Epinephrine enhanced the increase in expression of all three genes. Specifically, the induction of SOCS-1 expression caused by LPS was significantly enhanced by epinephrine 1 h after injection approximately fourfold but had no significant effect at later time points. In contrast, the increase in expression of IL-10 and SOCS-3 was enhanced 8 h after LPS. There was no significant effect of epinephrine on the induction of any of these genes 24 h after LPS injection.
Reduced JNK activation by LPS after epinephrine preexposure
LPS is known to not only induce alterations in gene expression, but also to effect protein modification by phosphorylation. It was shown that LPS induces phosphorylation of several MAPKs. Previously Koteish et al. (16) demonstrated that JNK phosphorylation is impaired in a model of sensitization to LPS caused by ethanol. Here, a similar sensitizing effect of epinephrine preexposure on LPS-induced liver injury was observed. Therefore, the effect of LPS and epinephrine on the phosphorylation status of several MAPKs was determined by Western blot analysis. Whereas epinephrine did not affect LPS-induced ERK1/2 signaling, it blunted LPS-induced JNK activation (Fig. 5), analogous to previous findings with ethanol (16). Epinephrine administration alone did not alter JNK phosphorylation compared with sham-treated controls. LPS increased phosphorylation of JNK 1 h after injection; this effect was significantly impaired by epinephrine preexposure by ∼70%. The phosphorylation status of JNK was similar between all groups 8 h after LPS injection.
Fig. 5.

Epinephrine followed by LPS leads to a decrease of pJNK (phosphor-ylated JNK) in the liver. Phosphorylation of JNK was assessed by Western blotting employing specific antibodies. A representative Western blot for the 1-h time point is shown here. The bar diagram depicts the image analysis of the Western blot analysis of JNK phosphorylation. Data are expressed as fold of sham (means ± SE, n = 4–7); asignificant (P < 0.05) effect of LPS; bsignificant (P < 0.05) effect of epinephrine. pERK, phosphorylated ERK.
Epinephrine blunts LPS-induced apoptosis
It is well known that JNK activity contributes to apoptosis (4, 6, 22, 26, 28). Previously it was shown that, coupled with impaired JNK phosphorylation, ethanol preexposure also decreased apoptosis (favoring necrosis) after LPS injection (16). Since a similar effect on JNK phosphorylation was observed here with epinephrine preexposure (Fig. 5), the effect of epinephrine and LPS on an index of apoptosis (TUNEL staining) was therefore determined. Figure 6 shows photomicrographs of TUNEL staining and image analysis. Epinephrine infusion alone did not increase TUNEL-positive cells. LPS injection caused a robust increase in the number of TUNEL-positive cells. Despite increasing plasma AST values (Fig. 1), epinephrine preexposure blunted the increase in TUNEL-positive cells caused by LPS by approximately twofold, analogous to previous findings with ethanol (16).
DISCUSSION
Salient points of the work shown here are that preexposure to epinephrine enhanced liver damage caused by LPS, analogous to those of ethanol preexposure. Furthermore, this sensitization by epinephrine shares similar effects (i.e., decreased JNK activation, decreased apoptosis, and increased necrosis) to that of ethanol preexposure (16). Lastly, sensitization to LPS-induced liver injury caused by ethanol could be blunted with the β-blocker propranolol. The increase in damage caused by epinephrine under these conditions is also characterized by a more robust inflammatory response. Previous studies have demonstrated a similar effect of the sympathetic nervous system in enhancing hepatic fibrogenesis (e.g., Ref. 21), suggesting that sympathetic tone may modulate many aspects of liver disease.
As mentioned above, previous studies have shown that epinephrine administration protects liver and liver cells against concomitant LPS stimulation (7, 18). However, whether or not epinephrine preexposure will enhance LPS-induced liver damage (as was shown here) has not been determined. These results suggest that the modulation of inflammation caused by epinephrine may depend on whether or not the stimulus is concomitant (protective) or prior (damaging) to the inflammatory stimulus. As mentioned before, other compounds can both tolerize and prime the hepatic inflammatory response, depending on the separation between the two exposures. For example, concomitant ethanol exposure protects against LPS-induced liver damage, whereas preexposure enhances the damaging effect of LPS (see also Fig. 1–Fig. 3) (8). The mechanisms by which ethanol mediates these effects are not completely understood.
It has been known for over 50 years that acute ethanol rapidly increases plasma catecholamine levels (15); in mice this effect peaks within 1 h of ethanol exposure (33). Yuki and Thurman (32) first described an acute hypermetabolic state [swift increase in alcohol metabolism (SIAM)] in the perfused liver after in vivo exposure to alcohol. This hypermetabolic state is characterized by increases in ethanol metabolism, oxygen extraction, and hepatic hypoxia (1, 32). Subsequent studies by that group demonstrated that the SIAM could be mimicked by catecholamines and could be inhibited by propranolol (31), indicating a role of the sympathetic nervous system in this process. Importantly, doses of ethanol that cause this acute hypermetabolic state also sensitize liver to LPS injected >20 h after ethanol exposure (e.g., Ref. 8). Although it is not known whether or not SIAM plays a causal role in the sensitization to LPS caused by ethanol, previous studies have shown that drugs that protect against SIAM (24) also protect against the enhancement of LPS-induced liver damage caused by ethanol (9). It was shown here that propranolol prevents sensitization to LPS caused by ethanol if the β-blocker is given concomitant with ethanol (Fig. 1 and Fig. 2), analogous to the regimen required to prevent SIAM (31).
Propranolol belongs to the group of nonselective β-blockers, which inhibits both β1- and β2-signaling. Thus the obtained results do not clarify whether the observed effect of propranolol under these conditions is mediated via β1 or β2 adrenoceptors. Propranolol also causes vasodilation, which in principle may indirectly mediate some of the protection observed with this drug under these conditions. Last, the bioavailability of propranolol is strongly regulated by the liver, and hepatic impairment due to ethanol/LPS-induced liver damage might increase the relative concentration and therefore further enhance the beneficial effects of the β-blocker. Nevertheless, these data support a role of the acute surge of catecholamines in the sensitizing effect of ethanol to LPS. These data also indirectly lend support to the hypothesis that SIAM contributes to this sensitizing effect of ethanol.
The sensitization of the liver to a second “hit” (such as LPS) either implicates exacerbation of the proinflammatory response or an inhibition of the anti-inflammatory response. Although mRNA expression of proinflammatory genes such as TNF-α, IL-6, and PAI-1 (Fig. 4) was enhanced, this effect was moderate (i.e., changes in expression approximately twofold) and was maximal 8 h after LPS injection, which is relatively late in the response to LPS. In contrast, previous studies in other models have shown a much earlier and more robust effect on the production of proinflammatory cytokines [e.g., in ob/ob mice exposed to LPS (30)]. This result is also in line with the observation that ERK phosphorylation, which is known to be induced by inflammatory cytokines, is only enhanced at the 8-h time point in this study (see Fig. 5). This activation could be mediated by an increase in SOCS1, which was recently shown to enhance MAPK phosphorylation via interaction with growth factor receptors (2, 29). The data shown here therefore suggest that, although epinephrine enhances inflammation caused by LPS, this effect is likely via an indirect mechanism (see below).
One possible mechanism by which inflammation could be indirectly increased by epinephrine/LPS is via increased necrotic cell death. Interestingly, the increase in necrosis (see also Fig. 3) observed here occurred in the absence of detectable increases in indices of apoptosis (e.g., Fig. 6); indeed, the amount of detectable apoptotic cells caused by LPS actually decreased with epinephrine preexposure. The inhibition of apoptosis under these conditions may be mediated by impairment of proapoptotic signaling cascades caused by epinephrine. Specifically, the activation of JNK caused by LPS was almost completely blunted by epinephrine preexposure under these conditions (see Fig. 4). JNK activation is a key mediator of apoptotic cell death in many cell types, including liver (17, 28). The previous results are in line with a study of Koteish et al. (16), in which ethanol preexposure blunted LPS-induced JNK phosphorylation together with a reduction in apoptosis.
In summary, the results here demonstrate that epinephrine preexposure enhances liver damage caused by LPS. Although infiltration of inflammatory cells is increased, this effect of epinephrine preexposure appears to be independent of robust increases in proinflammatory cytokine signaling but concurs with a likely secondary inflammatory response mediated by switch from apoptotic to necrotic cell death. These results support the hypothesis that sensitization to LPS caused by epinephrine shares similar mechanisms to those of ethanol. Indeed, it was demonstrated that sensitization to LPS caused by ethanol could be blunted with propranolol. Beyond ethanol, these results suggest that stressful events that increase catecholamine release may enhance normal tissue damage caused by a subsequent inflammatory event (e.g., endotoxemia).
Acknowledgments
GRANTS
This work was supported, in part, by the National Institute of Alcohol Abuse and Alcoholism. Grant AA003624 (G.E. Arteel).
REFERENCES
- 1.Arteel GE, Raleigh JA, Bradford BU, Thurman RG. Acute alcohol produces hypoxia directly in rat liver tissue in vivo: role of Kupffer cells. Am J Physiol Gastrointest Liver Physiol. 1996;271:G494–G500. doi: 10.1152/ajpgi.1996.271.3.G494. [DOI] [PubMed] [Google Scholar]
- 2.Ben Zvi T, Yayon A, Gertler A, Monsonego-Ornan E. Suppressors of cytokine signaling (SOCS) 1 and SOCS3 interact with and modulate fibroblast growth factor receptor signaling. J Cell Sci. 2006;119:380–387. doi: 10.1242/jcs.02740. [DOI] [PubMed] [Google Scholar]
- 3.Bergheim I, Guo L, Davis MA, Lambert JC, Beier JI, Duveau I, Luyendyk JP, Roth RA, Arteel GE. Metformin prevents alcohol-induced liver injury in the mouse: critical role of plasminogen activator inhibitor-1. Gastroenterology. 2006;130:2099–2112. doi: 10.1053/j.gastro.2006.03.020. [DOI] [PMC free article] [PubMed] [Google Scholar]
- 4.Bonny C, Oberson A, Negri S, Sauser C, Schorderet DF. Cell-permeable peptide inhibitors of JNK: novel blockers of beta-cell death. Diabetes. 2001;50:77–82. doi: 10.2337/diabetes.50.1.77. [DOI] [PubMed] [Google Scholar]
- 5.Bravo IR, Acevedo CG, Gallardo V. Acute effects of ethanol on liver blood circulation in the anesthetized dog. Alcohol Clin Exp Res. 1980;4:248–253. doi: 10.1111/j.1530-0277.1980.tb04809.x. [DOI] [PubMed] [Google Scholar]
- 6.Cheng HL, Steinway ML, Xin X, Feldman EL. Insulin-like growth factor-I and Bcl-X(L) inhibit c-jun N-terminal kinase activation and rescue Schwann cells from apoptosis. J Neurochem. 2001;76:935–943. doi: 10.1046/j.1471-4159.2001.00110.x. [DOI] [PubMed] [Google Scholar]
- 7.Deng J, Muthu K, Gamelli R, Shankar R, Jones SB. Adrenergic modulation of splenic macrophage cytokine release in polymicrobial sepsis. Am J Physiol Cell Physiol. 2004;287:C730–C736. doi: 10.1152/ajpcell.00562.2003. [DOI] [PubMed] [Google Scholar]
- 8.Enomoto N, Ikejima K, Bradford BU, Rivera CA, Kono H, Brenner DA, Thurman RG. Alcohol causes both tolerance and sensitization of rat Kupffer cells via mechanisms dependent on endotoxin. Gastroenterology. 1998;115:443–451. doi: 10.1016/s0016-5085(98)70211-2. [DOI] [PubMed] [Google Scholar]
- 9.Enomoto N, Ikejima K, Yamashina S, Hirose M, Shimizu H, Kitamura T, Takei Y, Sato AN, Thurman RG. Kupffer cell sensitization by alcohol involves increased permeability to gut-derived endotoxin. Alcohol Clin Exp Res. 2001;25:51S–54S. doi: 10.1097/00000374-200106001-00012. [DOI] [PubMed] [Google Scholar]
- 10.Fleming S, Toratani S, Shea-Donohue T, Kashiwabara Y, Vogel SN, Metcalf ES. Pro- and anti-inflammatory gene expression in the murine small intestine and liver after chronic exposure to alcohol. Alcohol Clin Exp Res. 2001;25:579–589. [PubMed] [Google Scholar]
- 11.Frost RA, Nystrom G, Burrows PV, Lang CH. Temporal differences in the ability of ethanol to modulate endotoxin-induced increases in inflammatory cytokines in muscle under in vivo conditions. Alcohol Clin Exp Res. 2005;29:1247–1256. doi: 10.1097/01.alc.0000171935.06914.5d. [DOI] [PubMed] [Google Scholar]
- 12.Guo L, Richardson KS, Tucker LM, Doll MA, Hein DW, Arteel GE. Role of the renin-angiotensin system in hepatic ischemia reperfusion injury in rats. Hepatology. 2004;40:583–589. doi: 10.1002/hep.20369. [DOI] [PubMed] [Google Scholar]
- 13.Hill DB, D’Souza NB, Lee EY, Burikhanov R, Deaciuc IV, de Villiers WJ. A role for interleukin-10 in alcohol-induced liver sensitization to bacterial lipopolysaccharide. Alcohol Clin Exp Res. 2002;26:74–82. [PubMed] [Google Scholar]
- 14.Honchel R, Ray MB, Marsano L, Cohen D, Lee E, Sheldofsky S, McClain CJ. Tumor necrosis factor in alcohol enhanced endotoxin liver injury. Alcohol Clin Exp Res. 1992;16:665–669. doi: 10.1111/j.1530-0277.1992.tb00656.x. [DOI] [PubMed] [Google Scholar]
- 15.Kingman GI, Goodall M. Urinary epinephrine and levarterenol excretion during acute sublethal alcohol intoxication in dogs. J Pharmacol Exp Ther. 1957;121:313–318. [PubMed] [Google Scholar]
- 16.Koteish A, Yang S, Lin H, Huang X, Diehl AM. Chronic ethanol exposure potentiates lipopolysaccharide liver injury despite inhibiting Jun N-terminal kinase and caspase 3 activation. J Biol Chem. 2002;277:13037–13044. doi: 10.1074/jbc.M101632200. [DOI] [PubMed] [Google Scholar]
- 17.Liedtke C, Plumpe J, Kubicka S, Bradham CA, Manns MP, Brenner DA, Trautwein C. Jun kinase modulates tumor necrosis factor-dependent apoptosis in liver cells. Hepatology. 2002;36:315–325. doi: 10.1053/jhep.2002.34615. [DOI] [PubMed] [Google Scholar]
- 18.Muthu K, Deng J, Gamelli R, Shankar R, Jones SB. Adrenergic modulation of cytokine release in bone marrow progenitor-derived macrophage following polymicrobial sepsis. J Neuroimmunol. 2005;158:50–57. doi: 10.1016/j.jneuroim.2004.08.003. [DOI] [PubMed] [Google Scholar]
- 19.Myburgh JA. An appraisal of selection and use of catecholamines in septic shock—old becomes new again. Crit Care Resusc. 2006;8:353–360. [PubMed] [Google Scholar]
- 20.Nishiyama D, Ikejima K, Honda H, Hirose M, Takei Y, Sato N. Acute ethanol administration down-regulates toll-like receptor-4 in the murine liver. Hepatol Res. 2002;23:130–137. doi: 10.1016/s1386-6346(01)00168-1. [DOI] [PubMed] [Google Scholar]
- 21.Oben JA, Roskams T, Yang S, Lin H, Sinelli N, Li Z, Torbenson M, Thomas SA, Diehl AM. Norepinephrine induces hepatic fibrogenesis in leptin deficient ob/ob mice. Biochem Biophys Res Commun. 2003;308:284–292. doi: 10.1016/s0006-291x(03)01360-3. [DOI] [PubMed] [Google Scholar]
- 22.Park HS, Lee JS, Huh SH, Seo JS, Choi EJ. Hsp72 functions as a natural inhibitory protein of c-Jun N-terminal kinase. EMBO J. 2001;20:446–456. doi: 10.1093/emboj/20.3.446. [DOI] [PMC free article] [PubMed] [Google Scholar]
- 23.Patterson-Buckendahl P, Kubovcakova L, Krizanova O, Pohorecky LA, Kvetnansky R. Ethanol consumption increases rat stress hormones and adrenomedullary gene expression. Alcohol. 2005;37:157–166. doi: 10.1016/j.alcohol.2005.09.007. [DOI] [PubMed] [Google Scholar]
- 24.Rivera CA, Bradford BU, Seabra V, Thurman RG. Role of endotoxin in the hypermetabolic state after acute ethanol exposure. Am J Physiol Gastrointest Liver Physiol. 1998;275:G1252–G1258. doi: 10.1152/ajpgi.1998.275.6.G1252. [DOI] [PubMed] [Google Scholar]
- 25.Song Z, Joshi-Barve S, Barve S, McClain CJ. Advances in alcoholic liver disease. Curr Gastroenterol Rep. 2004;6:71–76. doi: 10.1007/s11894-004-0029-y. [DOI] [PubMed] [Google Scholar]
- 26.Takada E, Toyota H, Suzuki J, Mizuguchi J. Prevention of anti-IgM-induced apoptosis accompanying G1 arrest in B lymphoma cells overexpressing dominant-negative mutant form of c-Jun N-terminal kinase 1. J Immunol. 2001;166:1641–1649. doi: 10.4049/jimmunol.166.3.1641. [DOI] [PubMed] [Google Scholar]
- 27.Teoh NC, Farrell GC. Hepatic ischemia reperfusion injury: pathogenic mechanisms and basis for hepatoprotection. J Gastroenterol Hepatol. 2003;18:891–902. doi: 10.1046/j.1440-1746.2003.03056.x. [DOI] [PubMed] [Google Scholar]
- 28.Tournier C, Hess P, Yang DD, Xu J, Turner TK, Nimnual A, Bar-Sagi D, Jones SN, Flavell RA, Davis RJ. Requirement of JNK for stress-induced activation of the cytochrome c-mediated death pathway. Science. 2000;288:870–874. doi: 10.1126/science.288.5467.870. [DOI] [PubMed] [Google Scholar]
- 29.Wang D, Li Z, Messing EM, Wu G. The SPRY domain-containing SOCS box protein 1 (SSB-1) interacts with MET and enhances the hepatocyte growth factor-induced Erk-Elk-1-serum response element pathway. J Biol Chem. 2005;280:16393–16401. doi: 10.1074/jbc.M413897200. [DOI] [PubMed] [Google Scholar]
- 30.Yang SQ, Lin HZ, Lane MD, Clemens M, Diehl AM. Obesity increases sensitivity to endotoxin liver injury: implications for the pathogenesis of steatohepatitis. Proc Natl Acad Sci USA. 1997;94:2557–2562. doi: 10.1073/pnas.94.6.2557. [DOI] [PMC free article] [PubMed] [Google Scholar]
- 31.Yuki T, Bradford BU, Thurman RG. Role of hormones in the mechanism of the swift increase in alcohol metabolism in the rat. Pharmacol Biochem Behav. 1980;13:67–71. doi: 10.1016/s0091-3057(80)80011-6. [DOI] [PubMed] [Google Scholar]
- 32.Yuki T, Thurman RG. The swift increase in alcohol metabolism: time course for the increase in hepatic oxygen uptake and the involvement of glycolysis. Biochem J. 1980;186:119–126. doi: 10.1042/bj1860119. [DOI] [PMC free article] [PubMed] [Google Scholar]
- 33.Zgombick JM, Erwin VG, Cornell K. Ethanol-induced adrenomedullary catecholamine secretion in LS/Ibg and SS/Ibg mice. J Pharmacol Exp Ther. 1986;236:634–640. [PubMed] [Google Scholar]