

Introduction
Antidepressant medications are among the most widely prescribed drugs in both psychiatric and general medical practice [Zineh et al., 2006]. Despite the wide use of antidepressant medications, meta-analyses of outcome studies of antidepressant treatment have concluded that less than 50% of depressed subjects treated in clinical trials experience a complete remission of their symptoms [Thase et al., 2005]. One objective of pharmacogenomic testing is to identify subjects who will respond to a specific medication.
Variations in the promoter region of SLC6A4 (serotonin transporter gene) have been reported to be associated with differential remission rates following selective serotonin reuptake inhibitor (SSRI) medication treatment [Serretti and Artioli 2004; Serretti et al., 2007]. The long form (L allele) of the indel promoter variant has 43 or 44 more nucleotides than the short form (S allele) [Hu et al., 2006]and has been shown to drive transcription levels to more than twice the level of the S allele [Lesch et al., 1996]. In some previous studies, European subjects homozygous for the L allele of the indel promoter variant have been reported to benefit more from treatment with medications that block serotonin reuptake than subjects without the L allele [Serretti and Artioli 2004]. More recently, two subtypes of the long allele have been described [Hu et al., 2005]. The long variant with an adenosine at SNP rs25531 (LA) has been reported to have higher activity than the long variant with a guanine at rs25531 (LG) [Hu et al., 2006]. It has also been demonstrated that the variable number of tandem repeats (VNTR) region within intron 2 is a transcriptional regulatory domain that enhances activity [Lovejoy et al., 2003]. The nine copy allele appears to be associated with a higher level of expression than the 10- or 12-copy VNTR alleles.
The multi-site clinical trial entitled “Sequenced Treatment Alternatives to Relieve Depression” (STAR*D) aimed to determine, prospectively, the effectiveness of different sequential treatment algorithms for patients with Major Depressive Disorder (MDD). Pharmacogenomic studies of subjects in the STAR*D level 1 sample have included analyses of the serotonin transporter with respect to remission and response following citalopram treatment [Hu et al., 2007; Kraft et al., 2007; McMahon et al., 2006]. Kraft and others [2007] genotyped nine tagging SNPs and two previously studied variants, but failed to detect an association with citalopram response. McMahon et al. [2006] selected 768 markers in 68 candidate genes and reported an association between a specific variant in the serotonin 2A receptor gene and remission. In a subgroup of white Hispanics and white non-Hispanics they found subjects with the “A” allele of a SNP at rs7997012 in the second intron of HTR2A had a 16% to 18% reduction in absolute risk of being a “non-responder” to citalopram. This association with rs7997012 was not demonstrated in the black sample. McMahon et al. [2006] did not detect an association between remission and any of the four SLC6A4 markers they investigated. A recent paper by Hu et al. [2007], analyzed side effect burden associations with the triallelic HTTLPR locus. They reported that subjects carrying the low-expression S or Lg alleles were more likely to experience citalopram adverse effects. They found no associations between remission or response and the promoter variant.
This report presents the relationships between variations in the sequence of SLC6A4 and remission of depressive symptoms in white non-Hispanic subjects treated with citalopram, based on analyses of the STAR*D level 1 sample. This paper also reports the results of the resequencing of informative segments of SLC6A4, which identified 18 haplotype tag SNPs. Exploratory analyses of the possible association of these SNPs with remission are described.
Methods
Study design and participants
The rationale and design of the STAR*D study have been described in detail by others [Fava et al., 2003; Rush et al., 2004; Trivedi et al., 2006]. In summary, all participants provided written informed consent, were between 18 and 75 years of age and met DSM-IV criteria for non-psychotic MDD. Symptomatic status was measured using the QIDS-C16, which rates all nine criterion symptom domains of MDD [Rush et al., 2003; Rush et al., 2006; Trivedi et al., 2004]. Our analyses of the STAR*D study data were approved by the Mayo Clinic Institutional Review Board.
The three major outcomes of the Star*D trial were 1) remission of depression, 2) response to treatment and 3) tolerance of the patient to citalopram. The definitions for all three outcomes were established in advance of these analyses after discussion with a team of collaborators involved in subsequent pharmacogenomic investigations using data derived from the STAR*D study. The analyses reported here focus exclusively on the remission of depression as this is the primary goal of treatment. Remission was defined as a score of ≤5 on the 16-item Quick Inventory of Depressive Symptomatology—Clinician Rating (QIDS-C16) scale at the last clinic visit [Rush et al., 2003; Rush et al., 2006; Trivedi et al., 2004].
Blood samples were collected from 1,953 of the 4,041 enrolled subjects in the STAR*D Study. Previous papers have documented differences between the subjects who contributed DNA and those who did not [Rush et al., 2006]. Subjects in the genetics sample were more likely to be white, married, older, have more years of education and come from primary care clinics. They also had more depressive episodes with longer time of illness [Kraft et al., 2007; McMahon et al., 2006]. 1,926 of these 1953 DNA samples were received from Rutgers Cell Repository and genotyped at the Mayo Clinic. Twelve subjects were dropped from analyses due to missing and discrepant data. Consequently, the “valid genotyped sample” contained 1914 subjects as shown by the CONSORT (Consolidated Standards of Reporting Trials) diagram in Figure 1.
Fig 1.
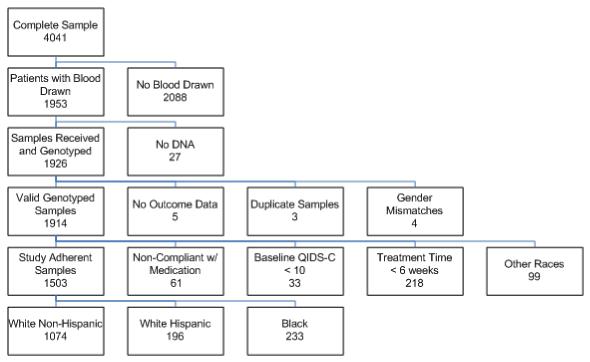
An analysis plan was determined a priori to maximize the power of finding an effect on remission that was attributed to genetic variation. Our inclusion/exclusion criteria for analysis were similar to those used in the previous publications [Kraft et al., 2007; McMahon et al., 2006]. Specifically, 312 subjects did not meet the criteria necessary to assess remission and were excluded for the following reasons: 1) 33 subjects did not have sufficient depressive symptoms to meet the severity criteria for inclusion in the study at baseline which was defined a priori as having a baseline QIDS-C16 of greater or equal to 10, 2) 218 subjects did not have an adequate trial as defined as discontinuing citalopram treatment within the first six weeks, 3) 61 subjects were determined to be non-compliant with taking the medication based on a global rating of compliance. Additionally, 99 ethnically diverse subjects consisting of Asian, multi-racial, Pacific Islander and unspecified racial subgroups were excluded from the genetic association analyses.
The STAR*D remission analysis sample (n = 1503) was analyzed in racially homogenous categories based on subject self-report. Racial categories were designated as white, black, and other. Additionally, Hispanic ethnicity was determined by self-report. Using these responses three groups were defined for analysis: white non-Hispanic, white Hispanic and black.
Demographic characteristics of the study sample are summarized in Table 1. Means and standard deviations are reported for continuous variables and percentages for categorical variables. The observed distributions of these demographic variables concur with previously published reports based on the STAR*D sample [Hu et al., 2006; Kraft et al., 2007; McMahon et al., 2006]. Groups of subjects were compared using Kruskal-Wallis tests for continuous variables and chi-square tests for categorical variables. The Kruskal-Wallis test was used to compare age, education, and household income between racial and ethnic groups because Shapiro-Wilk tests for normality showed that these variables were not normally distributed. Results in Table 1 reveal significant differences between ethnic groups in terms of age, education, household income, gender, employment status, medical insurance, and marital status.
Table 1.
Demographic characteristics of subjects in the remission analysis subset
| White non- Hispanic |
White Hispanic | Black | ||
|---|---|---|---|---|
| N=1074 | N=196 | N=233 | p | |
| Mean (± SD) age (years) |
42.7±13.4 | 41.9±12.75 | 44.2±12.6 | <.0001 |
| Mean (± SD) education (years) |
14.3±2.8 | 11.3±4.3 | 13.0±2.6 | <.0001 |
| Mean (± SD) household income (mo) |
3067±3867.3 | 1656±1823.8 | 1609±1679.9 | <.0001 |
| Gender | <0.001 | |||
| Female | 58.8% | 78.6% | 61.8% | |
| Male | 41.2% | 21.4% | 38.2% | |
| Employment | <0.001 | |||
| Employed | 61.1% | 50.5% | 45.1% | |
| Retired | 7.4% | 3.1% | 6.0% | |
| Unemployed | 31.5% | 46.4% | 48.9% | |
| Medical Insurance |
<0.001 | |||
| No Insurance | 29.7% | 33.9% | 41.0% | |
| Private | 60.5% | 39.6% | 36.2% | |
| Public | 9.8% | 26.5% | 22.7% | |
| Marital Status |
<0.001 | |||
| Divorced | 23.7% | 25.5% | 31.8% | |
| Married | 46.1% | 45.4% | 33.0% | |
| Never | 26.9% | 23.5% | 29.6% | |
| Widowed | 3.3% | 5.6% | 5.6% | |
Demographic variables presented in Table 1 were also compared between the 1503 subjects in the remission analysis sample and the 411 subjects excluded from the remission analyses. The excluded subjects had a significantly lower number of years of education (p < 0.0001), lower household income (p = 0.0004), and were more likely to be unemployed (p = 0.0054). Subjects who discontinued treatment prior to the sixth week were excluded from analyses as they had not been treated long enough to know whether they would ultimately achieve remission. When early dropout is non-random and is related to a potential predictor and the study outcome, excluding patients that dropout early can introduce bias. Among the white non-Hispanic subjects, there was no significant association between the indel promoter genotype or the rs25531 SNP genotype and exclusion from the remission analysis. However, there was a significant association between the VNTR genotype and exclusion from the remission analysis (p=0.01), with a higher early dropout rate observed among subjects carrying the 9/12 VNTR genotype. The difference in early response (QIDS-C16 scores during the first 6 weeks of treatment) between those that dropped out early and those that continued treatment beyond 6 weeks did not reach statistical significance (p = 0.075 for a repeated measures analysis). Nonetheless, to test the robustness of our findings to the effects of excluding the subset of patients with an inadequate treatment trial, we performed an intent-to-treat analysis that included all subjects that had been genotyped. We further address this issue in the discussion section when considering the results of this study.
Initial SLC6A4 resequencing
The SLC6A4 gene was resequenced to identify novel polymorphisms and study the frequencies of their occurrence in four ethnic groups. DNA samples were obtained from the Coriell Cell Repository. Subjects analyzed were 60 Caucasian-American (CA), 60 African-American (AA), 60 Han Chinese-American (HCA) and 60 Mexican-American (MA). These DNA samples had been obtained and anonymized by NIGMS prior to deposit. PCR amplifications were performed on each of 240 DNA samples in the areas which were to be resequenced. The sequences of all primers used to perform these amplifications are available upon request.
DNA analysis and resolution of the STAR*D sample
Genotyping of the indel promoter region of the STAR*D sample was performed using two independent methods. Discrepant and failed results were further analyzed by sequencing in both directions. Ten samples continued to yield ambiguous data after sequencing, and these were dropped from the analysis. PCR amplification was initially performed using an Agilent microfluidics 1000 base pair kit. As a measure of quality control, the indel in the 5′-FR was further analyzed using an ABI 3730XL DNA sequencer and GeneMapper software to detect the fragment length polymorphisms. An internal size standard was used to calibrate each capillary. This method was also used to determine the length of the VNTR in intron 2. The single nucleotide polymorphisms, with exception of rs25531, were genotyped using the SNPstream method. Multiplex PCR and SBE were carried out following the SNPstream protocol [Denomme and Van Oene 2005]. Primer sets for PCR and tagged SBE reactions were designed using the web-based design site http://www.autoprimer.com. The SNPstream tag array plates were imaged using the SNPstream Imager. The raw image data were analyzed automatically through SNPstream Software Suite. The genotype calls were made based on the relative fluorescent intensities of each spot and were reviewed by graphical cluster and Hardy-Weinberg equilibrium analysis before uploading to the SNPstream database. Individual sample genotype data were generated on the basis of the relative fluorescent intensities for each SNP and computer processed for graphical review. Controls included two genomic DNAs, each with 8 replicates per 384 well plate and 6 no DNA template wells. When SNPstream analysis failed, the samples were genotyped using Pyrosequencing. Single stranded DNA was purified using the Pyrosequencing vacuum workstation. Genotyping of rs25531 was performed by DNA sequencing of the repeat region in the 5′FR (5HTTLPR) in the forward direction [Kraft et al., 2005].
Statistical analysis
Genetic association tests were performed within three ethnic groups: white non-Hispanic, white Hispanic, and black. Allele frequencies were compared between ethnic sub-groups using chi-square tests (or Fisher’s exact tests for rare alleles). Chi-square tests of Hardy-Weinberg Equilibrium were carried out for all genetic variants within the ethnically homogeneous subgroups. For the three SLC6A4 genetic variants of primary interest, remission rates were compared across genotypes for each of the ethnic groups using Fisher’s exact tests. In the case of an overall significant group effect, pair-wise comparisons were performed between groups. P-values were corrected for the number of pair-wise comparisons performed for each polymorphism using a Bonferroni correction for the number of independent genotype tests. More detailed analyses were limited to the white non-Hispanic subgroup. Logistic regression models were used to assess the effects of polymorphisms on remission after accounting for the effects of other significantly associated variants in the region, as well as to assess genetic effects on remission while accounting for potentially important covariate effects. Score tests proposed by Shaid et al., [2002] were used to assess haplotype effects.
Based on the results of a meta-analysis performed by Seretti et al. [2007], remission rates following SSRI treatment are higher among Caucasian patients with LL and LS genotypes at the 5HTTLPR polymorphism. Using the pooled results of the studies evaluated in this meta-analysis, we estimated that with our remission analysis sample of 1074 Caucasians, we had >99.9% power to detect the dominant effect of the L allele. For this power analysis we used a significance level of 0.025 to adjust for the fact that both dominant and recessive effects of the two alleles at 5HTTLPR would be investigated. Power analyses for the other ethnic subgroups and other polymorphisms were not carried out since reliable estimates of the genetic effects in these populations were not available a priori.
Exploratory analyses of each of the additional 18 tag SNPs were also conducted using the white non-Hispanic patient subset. An Armitage trend test and a Fisher’s exact test of genotype frequencies were performed for each of these SNPs.
Results
SLC6A4 gene resequencing
The resequencing of the SLC6A4 gene involved the analysis of approximately 13,284 base pairs for each of the 240 DNA samples from the Coriell Cell Repository. All of the resequencing data for SLC6A4 have been deposited in the NIH-supported database PharmGKB with accession number PS206433. A total of 51 polymorphisms were observed, including 49 SNPs and two insertion-deletion events.
There were large ethnic variations in both allele frequencies and types with 31 polymorphisms in the AA DNA, 21 polymorphisms in the CA DNA, 10 polymorphisms in the HCA DNA, and 19 polymorphisms in the MA DNA. Eighteen polymorphisms were observed only in AA subjects, 4 in HCA subjects, 5 in MA subjects, and 9 in CA subjects. Of the polymorphisms identified, 40 had not been reported previously and 19 were “common”, having an allele frequency of greater than 1% in at least one ethnic group. All polymorphisms observed were in Hardy-Weinberg equilibrium.
Five nonsynonymous SNPs, polymorphisms that altered the encoded amino acids, were observed: Gly41Ala, Gly56Ala, Phe465Leu, Val488Met, and Lys605Asn. Two of these polymorphisms, Gly41Ala and Lys605Asn, were observed only in the HCA samples. The Phe465Leu and Val488Met polymorphisms were observed only in AA samples and the Gly56Ala polymorphism was observed in only CA samples. Two were common with frequencies of greater than 1%, including Gly56Ala in CA samples (3.3% frequency) and Lys605Asn in HCA samples (2.5% frequency). The gene resequencing data demonstrated large allele (Table 2) and variant allele frequency differences between ethnic groups, supporting the decision to analyze ethnic subgroups separately.
Table 2.
Frequency of Variant Allele among ethnic groups for the resequencing subjects
| Frequency of Variant Allele | ||||||
|---|---|---|---|---|---|---|
| Location | Nucleotide | Sequence Change |
African- America n |
Caucasia n |
Han Chinese America n |
Mexican America n |
| 5′FR | -3745 | T-->A | 0.042 | 0.000 | 0.000 | 0.000 |
| 5′FR | -3636 | T-->C | 0.110 | 0.000 | 0.000 | 0.000 |
| 5′FR | -3631 | G-->A | 0.025 | 0.050 | 0.000 | 0.042 |
| 5′FR | -2063 to - 1714 |
44 bp deletion |
0.377 | 0.404 | 0.712 | 0.644 |
| 5′FR | -1090 | A-->T | 0.017 | 0.000 | 0.000 | 0.000 |
| 5′FR | -1089 | A-->T | 0.373 | 0.067 | 0.060 | 0.050 |
| 5′FR | -859 | A-->C | 0.083 | 0.000 | 0.000 | 0.000 |
| 5′FR | -482 | T-->C | 0.083 | 0.075 | 0.150 | 0.058 |
| 5′FR | -469 | C-->T | 0.000 | 0.042 | 0.000 | 0.000 |
| Intron 1b | -45 | C-->A | 0.475 | 0.800 | 0.900 | 0.868 |
| Intron 1b | -25 | G-->A | 0.000 | 0.025 | 0.000 | 0.000 |
| 5′UTR | -185 | A-->C | 0.325 | 0.200 | 0.108 | 0.125 |
| 5′UTR | -149 | C-->A | 0.108 | 0.000 | 0.000 | 0.025 |
| Intron 1a | 28 | G-->A | 0.000 | 0.033 | 0.000 | 0.000 |
| Exon 2 | 303 | T-->C | 0.025 | 0.008 | 0.000 | 0.000 |
| Intron 2 | VNTR -9 | 0.000 | 0.018 | 0.000 | 0.000 | |
| VNTR -10 | 0.319 | 0.436 | 0.070 | 0.276 | ||
| VNTR -12 | 0.681 | 0.545 | 0.930 | 0.724 | ||
| Intron 4 | -100 | G-->A | 0.108 | 0.000 | 0.000 | 0.008 |
| Intron 7 | 83 | C-->T | 0.017 | 0.025 | 0.000 | 0.008 |
| Exon 8 | 1149 | C-->T | 0.000 | 0.000 | 0.000 | 0.033 |
| Intron 11 | -131 | C-->T | 0.066 | 0.000 | 0.000 | 0.000 |
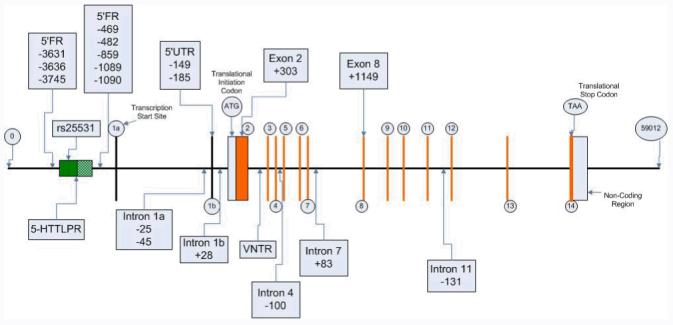
Of the polymorphisms identified through the sequence analysis, 18 haplotype tag SNPs were chosen for exploratory analysis in the STAR*D sample. The locations of these 18 variants and three previously reported polymorphisms (the indel promoter variant, the intron 2 VNTR and the rs25531 SNP) are shown in Figure 2. SLC6A4 polymorphisms within exons and in the 5′ and 3′ untranslated regions were numbered by designating the ‘A’ in the translation initiation codon for the cDNA encoding the 70-kDa isoform as position (+1). cDNA nucleotides located 5′ to that position were assigned negative numbers, whereas those located 3′ were assigned positive numbers. Positions within introns were numbered relative to splice junctions, with the initial 5′ nucleotide in the intron designated (+1).
Fig 2.
Allelic and genotype distributions
Departures from Hardy-Weinberg Equilibrium (HWE) were assessed using all genotyped subjects within the white non-Hispanic, white Hispanic, and Black sub-groups. In the white non-Hispanic and Black groups, no deviations from HWE were detected for the three polymorphisms. In the white Hispanic subset, the VNTR and indel promoter polymorphism genotypes conformed to HWE expectations, but genotypes at the rs25531 SNP showed some deviation from HWE (p = 0.042).
The remission analysis subset (n = 1503), was determined prior to genotyping and consisted of subjects who had an initial QIDS-C16 that indicated depression was evident at the time of enrollment, remained in the study for at least six weeks, and complied with the medication regime.
In the first set of analyses, the three polymorphic sites previously reported to be associated with response to SSRIs were analyzed. Of the 1503 subjects in the remission analysis sample, valid genotypes were obtained for the VNTR variation in the second intron of SLC6A4 for 1467 subjects, for the indel promoter polymorphism for 1494 subjects, and for the rs25531 single nucleotide polymorphism for 1502 subjects. The allelic distributions of the racial groups are summarized in Table 3. Significant variations in allele frequency among races/ethnic groups were observed for the intron 2 VNTR (p < .0001), indel promoter polymorphism region ( p < .0001) and the rs25531 single nucleotide polymorphism (p < .0001).
Table 3.
Distribution of allelic variation by race/ethnicity
| Distribution of Alleles N=1503 | |||
|---|---|---|---|
| White non- Hispanic n=1074 |
White Hispanic n=196 |
Black n=233 |
|
| VNTR | |||
| 9 | 1.6% (34) | 0.5% (2) | 0% (0) |
| 10 | 38.5% (803) | 32.6% (127) | 28.3% (129) |
| 11 | 0.1% (2) | 0% (0) | 0% (0) |
| 12 | 59.8% (1249) | 66.9% (261) | 71.7% (327) |
| Indel promoter polymorphism | |||
| L | 58.2% (1242) | 51.8% (203) | 78.9% (363) |
| S | 41.8% (894) | 48.2% (189) | 21.1% (97) |
| rs25531 | |||
| A | 92.9% (1995) | 93.9% (368) | 74.6% (346) |
| G | 7.1% (153) | 6.1% (24) | 25.4% (118) |
Two instances of the rare intron 2 VNTR 11 repeat allele [Lesch et al., 1994] were identified. The subjects having an 11 repeat allele were heterozygous 10/11 and 11/12 and were both white non-Hispanic. These subjects were excluded from the statistical analysis of remission. Genotyping of the indel promoter region revealed the common long and short variants as well as thirteen instances of extra long variants [Nakamura et al., 2000]. These extra long variants were observed in eleven black subjects, one Pacific Islander subject and one Asian subject and were classified as long alleles.
Association of remission with the Intron 2 VNTR
Among white non-Hispanic subjects in the remission analysis subset, the VNTR genotype was associated with rate of remission (p=0.041). Pair-wise comparisons were performed for each genotype compared to the remaining pooled genotypes. P-values were corrected for the fact that multiple pair-wise comparisons were performed. These pair-wise comparisons revealed that subjects with the 12/12 genotype had a remission rate of 44.1% as compared to 51.9% of the subjects with the remaining genotypes (p = 0.017, pcorrected = 0.069). Subjects who had one copy of the 9 allele [Lovejoy et al., 2003], and the 12 allele had a remission rate of 70.6% as compared to 48.7% for those subjects with any other VNTR genotype (p = 0.088, pcorrected = 0.353) (See Table 4). There were no statistically significant associations between VNTR genotypes and remission in either the black or the white Hispanic groups.
Table 4.
Genotype analyses in relation to remission defined by QIDS-C16<5
| White non-Hispanic | White Hispanic | Black | ||||||||||
|---|---|---|---|---|---|---|---|---|---|---|---|---|
| Intron 2 VNTR |
Remission | N | P- Value(2)) |
P- Value(3)) |
Remission | N | P- Value(2)) |
P- Value(3)) |
Remission | N | P- Value(2)) |
P- Value(3)) |
| 9/10 | 52.9% | 17 | 0.810 | 1.000 | 0% | 1 | 1.000 | 1.000 | ||||
| 9/12 | 70.6% | 17 | 0.088 | 0.353 | 100% | 1 | 0.374 | 1.000 | ||||
| 10/10 | 55.7% | 158 | 0.070 | 0.282 | 29.2% | 24 | 0.500 | 1.000 | 35.3% | 17 | 1.000 | 1.000 |
| 10/12 | 49.9% | 469 | 0.619 | 1.000 | 38.5% | 78 | 0.880 | 1.000 | 37.9% | 95 | 1.000 | 1.000 |
| 12/12 | 44.1% | 381 | 0.017 | 0.069 | 38.5% | 91 | 0.882 | 1.000 | 37.9% | 116 | 1.000 | 1.000 |
| Global P- Value(1)) |
0.041 | 0.670 | 1.000 | |||||||||
| Indel Promoter |
Remission | N | P- Value(2)) |
P- Value(3)) |
Remission | N | P- Value(2)) |
P- Value(3)) |
Remission | N | P- Value(2)) |
P- Value(3)) |
| L/L | 53.7% | 369 | 0.012 | 0.024 | 31.7% | 60 | 0.267 | 0.533 | 37.8% | 143 | 0.780 | 1.000 |
| L/S | 45.2% | 504 | 0.058 | 0.115 | 39.8% | 83 | 0.656 | 1.000 | 41.6% | 77 | 0.567 | 1.000 |
| S/S | 46.2% | 195 | 0.527 | 1.000 | 41.5% | 53 | 0.512 | 1.000 | 30% | 10 | 0.744 | 1.000 |
| Global P- Value(1)) |
0.039 | 0.490 | 0.787 | |||||||||
| rs25531 | Remission | N | P- Value(2)) |
P- Value(3)) |
Remission | N | P- Value(2)) |
P- Value(3)) |
Remission | N | P- Value(2)) |
P- Value(3)) |
| A/A | 47.6% | 925 | 0.134 | 0.267 | 38.5% | 174 | 0.644 | 1.000 | 38.9% | 126 | 0.893 | 1.000 |
| A/G | 54.5% | 145 | 0.129 | 0.259 | 35% | 20 | 1.000 | 1.000 | 38.3% | 94 | 1.000 | 1.000 |
| G/G | 50% | 4 | 1.000 | 1.000 | 0% | 2 | 0.528 | 1.000 | 33.3% | 12 | 1.000 | 1.000 |
| Global P- Value(1)) |
0.287 | 0.752 | 0.975 | |||||||||
Fisher’s exact test comparing remission rates across all genotypes.
Fisher’s exact test comparing each genotype versus all others in a 2x2 table; not corrected for multiple testing.
Corrected for multiple testing by multiplying Fisher’s P-value by the number of independent genotype tests.
Association of remission with the Indel Promoter Variant
White non-Hispanic subjects in the remission analysis subset had a significantly greater likelihood of remission when carrying two copies of the more active long form of the indel variation (p= 0.012, pcorrected = 0.024). Subjects who were homozygous for the more active long form of this variant had a remission rate of 53.7% as compared to 45.5% of subjects with either the homozygous short form or the heterozygous long form/short form of this genotype (See Table 4). No significant associations between remission and the indel promoter genotypes were found in either the black or the white Hispanic groups.
Association of remission with the rs25531 SNP
We found no evidence of association between genotype at the rs25531 SNP and remission in any of the three ethnic groups (Table 4).
Exploratory analyses of multi-locus association
Further exploratory analyses using the white non-Hispanic sub-sample focused on multi-locus effects. Logistic regression models were used to assess the joint effects of the three candidate polymorphisms. As shown in Table 4, post-hoc analysis of the indel promoter variant association with remission suggested that the S allele had a dominant effect on remission, where carriers of the S allele had a lower remission rate. Further analysis also showed that the 12 allele of the VNTR appears to have an additive effect on remission. Logistic regression analysis of the combined effects of the indel promoter variant and the intron 2 VNTR revealed that the dominant effect of the indel promoter variant was not significant after accounting for the additive effect of the VNTR 12 allele (p= 0.10), while the additive effect of the VNTR 12 allele remained significant even after accounting for the dominant effect of the S indel allele (p=.04). Thus, these results are not able to confirm independent contribution of these two variants to the likelihood of remission. However, they suggest that the observed effect of the indel promoter variant may be attributable to the linkage disequilibrium (LD) between the indel promoter variant and the VNTR.
Next, association of remission with haplotypes composed of the three candidate polymorphisms was evaluated. Consistent with earlier reports [Kraft et al., 2005] we observed that the “g” allele of rs25531 occurs very rarely on haplotypes with the S version of the indel promoter variation. We also found that, contrary to the results of Hu et al. [2005] LG haplotypes did not show effects similar to haplotypes carrying the S indel promoter allele.
For the haplotype composed of all three variations, the additive model global score statistic [Schaid et al., 2002] simulation p-value was 0.064. The most strongly associated haplotype was S-a-12, with a simulation p-value of 0.0024 and a maximum statistic simulation p-value of 0.021. Under a dominant model (Table 5) the corresponding maximum statistic simulation p-value was 0.0031, and the global test p-value was 0.04. These results indicate that carriers of the S-a-12 haplotype have significantly lower probability of remission when treated with citalopram than non-carriers of this haplotype. Since SNP rs25531 did not appear to have much effect on remission, and did not appear to vary on haplotypes carrying the S allele, we also considered haplotypes composed only of the indel promoter variant and VNTR variations. Consistent with the above results, the haplotype was significantly associated with remission in the white non-Hispanic patient population. Under an additive model, the global score statistic p-value was 0.023, and the maximum statistic simulation p-value of 0.028 indicated that the S-12 haplotype was associated with significantly lower chances of remission. Under the dominant model the global test p-value was 0.024, while the maximum statistic p-value for the S-12 haplotype was 0.0076.
Table 5.
Haplotype analyses of remission in white non-Hispanic subset under a dominant model. Only haplotypes with frequency > 1% are shown
| Haplotype | Haplotype Frequency | Haplotype Simulation p-value |
Maximum statistic simulation p |
||
|---|---|---|---|---|---|
| WNH | WNH Non-remitters |
WNH Remitters |
|||
| S-a-12 | .330 | .363 | .297 | .0007 | .0031 |
| L-a-12 | .215 | .215 | .213 | .98 | |
| L-g-12 | .052 | .048 | .057 | .32 | |
| S-a-10 | .085 | .074 | .097 | .23 | |
| L-a-10 | .291 | .279 | .304 | .14 | |
Exploratory analysis of SLC6A4 tag SNPs
Exploratory analyses of the 18 tag SNPs revealed that nine had a minor allele frequency (MAF) greater than 0.01 and only two had MAF>0.05. Thus, association analyses of these SNPs had limited power. There were no significant deviations from HWE for any of these SNPs. Except for SNP 5FR-469_TC which showed deviation in the white subset (p < .0001). Only one of the 18 polymorphisms, the intron 7-83-TC SNP, showed some evidence of association with remission (p = 0.018 for a Fisher’s exact test of genotypes; not corrected for multiple testing). This association may be due to LD between this SNP and the intron 2 VNTR. Logistic regression models were therefore used to assess the joint effects of these polymorphisms.
The intron 7-83-TC genotype was not significantly associated with remission after accounting for the effect of the intron 2 VNTR (p=0.11), whereas the intron 2 VNTR effect showed a trend for association with remission even after accounting for the effect of intron 7-83-TC (p=0.06). Thus, although the effects of these two polymorphisms on remission are strongly related and may not be easily disentangled, it seems plausible that the intron 7-83-TC SNP is associated with remission only as a result of the LD between this SNP and the intron 2 VNTR.
Discussion
These analyses provide additional insight into the association of genetic variation and remission of depression in the citalopram treatment phase of the STAR*D sample. Although one of the tag SNPs, intron 7-83-TC, showed evidence of association with remission at the .05 significance level, this association is not significant after correction for the fact that 18 tag SNPs were tested in this exploratory portion of our analyses. In the white non-Hispanic sub-sample, the intron 2 VNTR and the indel promoter polymorphism were both associated with remission following citalopram treatment (point-wise p= 0.041 and 0.039 for the intron 2 VNTR and indel promoter variant, respectively). Remission rates were lower among individuals homozygous for the 12 allele of the VNTR and those carrying at least one copy of the S allele at the indel promoter variant. The relationship between response to SSRIs and allelic variation at the indel promoter has been studied fairly extensively, and several studies have addressed the association between the intron 2 VNTR and SSRI response. However, there have been no reported investigations of the relationship between haplotypes composed of these two polymorphisms and antidepressant response. Results presented in this paper suggest that consideration of these haplotypes may be informative as a predictor of SSRI response. Notably, the haplotype composed of the indel promoter variant and VNTR variations was associated with remission, with carriers of the S-12 haplotype having significantly lower rates of remission (maximum statistic simulation p-value = .0076 under dominant model).
Our analysis of the white non-Hispanic subset revealed that patients with the LL indel promoter genotype had higher odds of remission compared to carriers of the S allele, with an odds ratio of 1.39 (95% CI 1.07-1.80). Our odds ratio estimate agrees very well with the OR of 1.37 (95%CI 0.93-2.0) for the same comparison reported by (Serretti et al. [2007] based on a meta-analysis of studies in Caucasian populations. However, Serretti et al. [2007] also reported a larger OR of 2.37 (95% CI: 1.56-3.58) for the comparison of carriers of the L allele (homozygous LL and heterozygous LS combined) with SS homozygotes, which we did not detect in the STAR*D sample.
Given the modest genetic effect sizes detected here and in a recent meta-analysis [Serretti et al., 2007], it is not surprising that studies of the association between variation in SLC6A4 and response to SSRIs have been somewhat inconsistent. McMahon et al. [2006] did not identify an association between SLC6A4 variants and remission in their analyses of the STAR*D sample. However, as they noted [McMahon et al., 2006], their split-sample analysis of 768 SNPs, including four markers in SLC6A4, may have been underpowered to detect association with this gene.
Genetic analyses of the STAR*D sample conducted by Kraft et al. [2007], specifically included an analysis of variations in SLC6A4. These analyses differed in several ways from the analyses in this report. First, a different method was used to determine remission. In the study by Kraft et al. [2007], subjects were categorized as remitters if they achieved at least a fifty-percent reduction in symptoms at study exit and went into remission at any point in the study. This included early remitters who subsequently developed higher depression scores. The remission analysis group, as defined by Kraft et al. [2007], included a small number of subjects who had baseline QIDS-C16 score of less than ten, as well as a few medication non-compliant subjects. In the analyses in this report, subjects were classified as remitters only if they remained in remission at study exit. This resulted in 93 white non-Hispanic subjects who temporarily achieved QIDS-C16 scores of 5 or less to be classified as remitters in the Kraft et al. [2007] study. In our analysis, these subjects with only temporary improvement were included in the nonremitter group. Secondly, the white non-Hispanic sub-sample was not studied separately in the Kraft et al. [2007] paper. Instead, all white subjects were analyzed as a single group. There was no association between SLC6A4 variation and remission when white Hispanic and white non-Hispanic subjects were combined into one group. The pooling of these two ethnic groups had the effect of obscuring the positive association in the white non-Hispanic sub-sample. A third difference is that Kraft et al. [2007] used a self report measure (QIDS-SR16) rather than a clinician specified measure (QIDS-C16). While these two measures are highly correlated, clinician assessment provides a more standardized method of assessing symptom severity. Finally, a fourth difference was that the alpha threshold for significance was set at 0.01 by Kraft et al. [2007] as many comparisons were conducted.
Further analyses of SLC6A4 using the STAR*D sample were conducted by Hu et al. [2007]. Associations between side effect burden and SLC6A4 indel promoter variants were reported for the entire sample and for the white non-Hispanic sub-sample. However, no association between the indel variants and remission was detected. In these analyses, subjects were excluded if their QIDS-C16 study exit score fell between 6 - 9, which they defined as “undetermined”.
Additionally, subjects who were rated as intolerant or probably intolerant were not included in the non-remission group. The specific results of the analyses of the SLC6A4 indel promoter variant and remission for the white non-Hispanic group were not reported.
The analyses reported in this paper focus primarily on the white non-Hispanic sub-sample. Due to the potential of spurious associations in genetic studies of ethnically mixed populations, ethnic groups are often analyzed separately. In this analysis, the white patient population was subdivided based on Hispanic ethnicity. Our analyses of Coriell samples demonstrated differences in SLC6A4 allele and haplotype frequencies between the Caucasian-American and Mexican-American populations. Allele frequencies at SLC6A4 polymorphisms also differed between the white non-Hispanic and white Hispanic patients in the STAR*D sample, and some departure from HWE was detected at the rs25531 SNP in the Hispanic sample. Furthermore, previous studies have suggested that genetic predictors may vary in different racial or ethnic groups. For instance, some studies of Asian populations have reported that the S allele of the indel promoter polymorphism was associated with a better clinical response to SSRIs [Serretti and Artioli 2004]. In previous research, subjects of European origin have generally done better when treated with SSRIs than other races. This difference has been appropriately discussed within environmental and cultural contexts as well as considering genetic variations. In reviewing the STAR*D results reported in this paper, this finding is replicated, despite the considerable variability within the cohort that self identified themselves as white non-Hispanic. Due to the differences in allele frequencies and remission rates between the different ethnic groups, separation of the sample into ethnically homogenous subgroups was important to avoid potentially spurious association findings as a result of population stratification. Previous studies that included groups of African Americans, European Americans and Hispanics, have shown that self-reported ethnicity corresponds closely to genetic marker-based classifications, and that self-reported ethnicity can play an important role in controlling for population stratification [Liu et al., 2006; Tang et al., 2005].
It is expected that important covariates, such as initial depression severity, length of treatment (days in study) and dose may play an important role in remission. We therefore repeated our genetic association analyses while adjusting for potentially important covariates using logistic regression models (detailed results not shown). We found that age and gender were not significantly associated with remission, while baseline QIDS-C16, days in study, and final dose were. With adjustment for the effects of these covariates, the genetic effects of the indel promoter variant and the intron 2 VNTR remained statistically significant (p<0.05).
These findings must be interpreted cautiously given the sample selection criteria. Specifically, the sample may have an unspecified shift towards patients who may be more likely to respond to citalopram treatment, because some patients who had been unsuccessfully treated with citalopram in the past were excluded. Also, the main analyses in this paper were based on a subset of patients that completed at least 6 weeks in the study for whom there was no evidence of non-compliance. Because of the study exclusion criteria and the exclusion of subjects from analysis, absolute remission rates in the analyzed subset may be higher than what could be achieved in the general population of patients with MDD. However, this sampling bias should not significantly bias measures of genotype-remission association unless probability of early dropout is related to remission, and the genotype itself is related to early dropout. To test the robustness of our findings we subsequently performed an intent-to-treat analysis (detailed results not shown) that included all white non-Hispanic subjects that initiated citalopram treatment and were available for genotyping. In the intent-to treat analyses we again compared genotype and allele frequencies between remitters and non-remitters, and performed logistic regression analyses to assess genetic effects while taking into account potentially important covariates, including baseline QIDS-C16, days in study, and final citalopram dose. Analysis of the whole set of white non-Hispanic subjects did not show significant association between remission and the indel promoter polymorphism or SNP rs25531, whether we adjusted for covariates or not (with covariate adjustment, p = 0.11 for indel promoter, p = 0.17 for rs25531). Although without adjusting for covariates, association with the VNTR was not statistically significant (p = 0.09), association with remission became evident after accounting for initial depression severity (baseline QIDS-C16), days in study, and final dose (p = 0.031). Furthermore, in this full set of white non-Hispanic subjects, we still detected association with SLC6A4 haplotypes. Again, the S-a-12 haplotype was found to be associated with lower rates of remission (maximum statistic simulation p-value = 0.038).
One weakness of this study relates to the fact that the full patient cohort was not genotyped, and therefore only about half the patients were included in the genetic analyses. Although the subset of patients that provided blood samples for genotyping were similar to the entire STAR*D cohort, there were also slight differences that reached statistical significance because of the large sample size (see “methods” for details). As McMahon et al.[2006] noted, these differences are unlikely to affect the genetic association results that are based on the genotyped sample. However, they may limit the generalizability of the findings. Other limitations of the STAR*D study include the fact that analyses did not adjust for certain potential confounders, such as medication use prior to study entry, concomitant medication use, medication compliance, and Axis II Disorders. Data on use of antidepressant medications prior to study entry were not available. Although concomitant medications were allowed in this study, subjects could not be taking other antidepressant, antipsychotic or mood stabilizing medications. Data on concomitant medications and Axis II Disorders were not available. Serum levels were not obtained from subjects and compliance was not rigorously monitored. However, a global measure of compliance that was available for most subjects was used to exclude non-compliant patients from the primary analyses.
Conclusion
These analyses demonstrate an association between remission of depressive symptoms and both the VNTR12/12 genotype in intron 2 and the indel promoter variant in white non-Hispanic subjects who have been treated with citalopram. These findings support previously reported positive associations between variations of SLC6A4 and positive response to other SSRIs in subjects of European origin.
Acknowledgments
The STAR*D study was funded by the National Institute of Mental Health, National Institutes of Health, under Contract N01MH90003 to UT Southwestern Medical Center at Dallas (P.I.: A.J.Rush).
Genetic analyses were funded by an NIH grant U01 GM61388 (“The Pharmacogenomics Research Network”), a PhRMA Foundation “Center of Excellence in Clinical Pharmacology Award” (P.I.: R.M. Weinshilboum), and the Cooper Family Foundation.
We would like to thank Linda Pelleymounter, Ross Aleff, Irene Moon, and Arly Mae Rand for the SLC6A4 gene resequencing studies and Anthony Batzler and Susanna Stevens for their statistical support.
The content of this publication does not necessarily reflect the views or policies of the Department of Health and Human Services, nor does mention of trade names, commercial products, or organizations imply endorsement by the U.S. Government.
References
- Denomme GA, Van Oene M. High-throughput multiplex single-nucleotide polymorphism analysis for red cell and platelet antigen genotypes. Transfusion. 2005;45(5):660–6. doi: 10.1111/j.1537-2995.2005.04365.x. [DOI] [PubMed] [Google Scholar]
- Fava M, Rush AJ, Trivedi MH, Nierenberg AA, Thase ME, Sackeim HA, Quitkin FM, Wisniewski S, Lavori PW, Rosenbaum JF. and others.Background and Rationale for the Sequenced Treatment Alternatives to Relieve Depression (STAR*D) Study Psychiatr Clin North Am 200326457–494. [DOI] [PubMed] [Google Scholar]
- Hu XZ, Lipsky RH, Zhu G, Akhtar LA, Taubman J, Greenberg BD, Xu K, Arnold PD, Richter MA, Kennedy JL. and others. Serotonin transporter promoter gain-of-function genotypes are linked to obsessive-compulsive disorder American Journal of Human Genetics 2006785815–26. [DOI] [PMC free article] [PubMed] [Google Scholar]
- Hu XZ, Oroszi G, Chun J, Smith TL, Goldman D, Schuckit M. An Expanded Evaluation of the Relationship of Four Alleles to the Level of Response to Alcohol and the Alcoholism Risk. Alcoholism. Clinical and Experimental Research. 2005;29(1):8–16. doi: 10.1097/01.alc.0000150008.68473.62. [DOI] [PubMed] [Google Scholar]
- Hu XZ, Rush AJ, Charney D, Wilson AF, Sorant AJ, Papanicolaou GJ, Fava M, Trivedi MH, Wisniewski SR, Laje G. and others. Association between a functional serotonin transporter promoter polymorphism and citalopram treatment in adult outpatients with major depression Archives of General Psychiatry 2007647783–92. [DOI] [PubMed] [Google Scholar]
- Kraft JB, Peters EJ, Slager SL, Jenkins GD, Reinalda MS, McGrath PJ, Hamilton SP. Analysis of association between the serotonin transporter and antidepressant response in a large clinical sample. Biological Psychiatry. 2007;61(6):734–42. doi: 10.1016/j.biopsych.2006.07.017. [DOI] [PubMed] [Google Scholar]
- Kraft JB, Slager SL, McGrath PJ, Hamilton SP. Sequence Analysis of the Serotonin Transporter and Associations with Antidepressant Response. Biological Psychiatry. 2005;58(5):374–381. doi: 10.1016/j.biopsych.2005.04.048. [DOI] [PubMed] [Google Scholar]
- Lesch KP, Balling U, Gross J, Strauss K, Wolozin BL, Murphy DL, Riederer P. Organization of the human serotonin transporter gene. Journal of Neural Transmission - General Section. 1994;95(2):157–62. doi: 10.1007/BF01276434. [DOI] [PubMed] [Google Scholar]
- Lesch KP, Bengel D, Heils A, Sabol SZ, Greenberg BD, Petri S, Benjamin J, Muller CR, Hamer DH, Murphy DL. Association of anxiety-related traits with a polymorphism in the serotonin transporter gene regulatory region. Science. 1996;274(5292):1527–31. doi: 10.1126/science.274.5292.1527. [DOI] [PubMed] [Google Scholar]
- Liu X-Q, Paterson AD, John EM, Knight JA. The role of Self-Defined Race/Ethnicity in Population Structure Control. Annals of Human Genetics. 2006;70(4):496–505. doi: 10.1111/j.1469-1809.2005.00255.x. [DOI] [PubMed] [Google Scholar]
- Lovejoy EA, Scott AC, Fiskerstrand CE, Bubb VJ, Quinn JP. The serotonin transporter intronic VNTR enhancer correlated with a predisposition to affective disorders has distinct regulatory elements within the domain based on the primary DNA sequence of the repeat unit. European Journal of Neuroscience. 2003;17(2):417–20. doi: 10.1046/j.1460-9568.2003.02446.x. [DOI] [PubMed] [Google Scholar]
- McMahon FJ, Buervenich S, Charney D, Lipsky R, Rush AJ, Wilson AF, Sorant AJM, Papanicolau GJ, Laje G, Fava M. and others. Variation in the Gene Encoding the Serotonin 2A Receptor Is Associated with Outcome of Antidepressant Treatment The American Journal of Human Genetics 200678804–814. [DOI] [PMC free article] [PubMed] [Google Scholar]
- Nakamura M, Ueno S, Sano A, Tanabe H. The human serotonin transporter gene linked polymorphism (5-HTTLPR) shows ten novel allelic variants. Molecular Psychiatry. 2000;5(1):32–38. doi: 10.1038/sj.mp.4000698. [DOI] [PubMed] [Google Scholar]
- Rush A, Fava M, Wisniewski S, Lavori P, Trivedi M, Sackeim H, Thase M, Nierenberg A, Quitkin F, Kashner T. and others. Sequenced treatment alternatives to relieve depression (STAR*D): rationale and design Control Clin Trials 2004251119–42. [DOI] [PubMed] [Google Scholar]
- Rush A, Trivedi M, Ibrahim H, Carmody T, Arnow B, Klein D, Markowitz J, Ninan P, Kornstein S, Manber R. and others. The 16-Item Quick Inventory of Depressive Symptomatology (QIDS), clinician rating (QIDS-C), and self-report (QIDS-SR): a psychometric evaluation in patients with chronic major depression Biol Psychiatry 2003545573–83. [DOI] [PubMed] [Google Scholar]
- Rush AJ, Bernstein IH, Trivedi MH, Carmody TJ, Wisniewski SR, Mundt JC, Shores-Wilson K, Biggs MM, Woo A, Nierenberg AA. and others. An evaluation of the quick inventory of depressive symptomatology and the hamilton rating scale for depression: a sequenced treatment alternatives to relieve depression trial report Biological Psychiatry 2006596493–501. [DOI] [PMC free article] [PubMed] [Google Scholar]
- Schaid DJ, Rowland CM, Tines DE, Jacobson RM, Poland GA. Score tests for association between traits and haplotypes when linkage phase is ambiguous. Am J Hum Genet. 2002;70(2):425–34. doi: 10.1086/338688. [DOI] [PMC free article] [PubMed] [Google Scholar]
- Serretti A, Artioli P. The pharmacogenomics of selective serotonin reuptake inhibitors. The pharmacogenomics journal. 2004;4(4):233–44. doi: 10.1038/sj.tpj.6500250. [DOI] [PubMed] [Google Scholar]
- Serretti A, Kato M, De Ronchi D, Kinoshita T. Meta-analysis of serotonin transporter gene promoter polymorphism (5-HTTLPR) association with selective serotonin reuptake inhibitor efficacy in depressed patients. Molecular Psychiatry. 2007;12(3):247–257. doi: 10.1038/sj.mp.4001926. [DOI] [PubMed] [Google Scholar]
- Tang H, Quertermous T, Rodriguez B, Kardia S, Zhu X, Brown A, Pankow JS, Province MA, Hunt SC, Boerwinkle E. and others. Genetic Structure, Self-Identified Race/Ethnicity, and Confounding in Case-Control Association Studies American Journal of Human Genetics 200576268–275. [DOI] [PMC free article] [PubMed] [Google Scholar]
- Thase ME, Haight BR, Richard N, Rockett CB, Mitton M, Modell JG, VanMeter S, Harriett AE, Wang YC. Remission rates following antidepressant therapy with bupropion or selective serotonin reuptake inhibitors: a meta-analysis of original data from 7 randomized controlled trials. J Clin Psychiatry. 2005;66(8):974–81. doi: 10.4088/jcp.v66n0803. [DOI] [PubMed] [Google Scholar]
- Trivedi M, Rush A, Wisniewski S, Nierenberg A, Warden D, Ritz L, Norquist G, Howland R, Lebowitz B, McGrath P. and others. Evaluation of Outcomes With Citalopram for Depression Using Measurement-Based Care in STAR*D: Implications for Clinical Practice The American Journal of Psychiatry 2006163128. [DOI] [PubMed] [Google Scholar]
- Trivedi MH, Rush AJ, Ibrahim HM, Carmody TJ, Biggs MM, Suppes T, Crismon ML, Shores-Wilson K, Toprac MG, Dennehy EB. and others. The Inventory of Depressive Symptomatology, Clinician Rating (IDS-C) and Self-Report (IDS-SR), and the Quick Inventory of Depressive Symptomatology, Clinician Rating (QIDS-C) and Self-Report (QIDS-SR) in public sector patients with mood disorders: a psychometric evaluation Psychol Med 200434173–82. [DOI] [PubMed] [Google Scholar]
- Zineh I, Pebanco GD, Aquilante CL, Gerhard T, Beitelshees AL, Beasley BN, Hartzema G. Discordance between availability of pharmacogenetics studies and pharmacogenetics-based prescribing information for the top 200 drugs. Ann Pharmacother. 2006;40(4):639–44. doi: 10.1345/aph.1G464. [DOI] [PubMed] [Google Scholar]