

Abstract
Obtaining validation data and comparison metrics for segmentation of magnetic resonance images (MRI) are difficult tasks due to the lack of reliable ground truth. This problem is even more evident for images presenting pathology, which can both alter tissue appearance through infiltration and cause geometric distortions. Systems for generating synthetic images with user-defined degradation by noise and intensity inhomogeneity offer the possibility for testing and comparison of segmentation methods. Such systems do not yet offer simulation of sufficiently realistic looking pathology. This paper presents a system that combines physical and statistical modeling to generate synthetic multi-modal 3D brain MRI with tumor and edema, along with the underlying anatomical ground truth, Main emphasis is placed on simulation of the major effects known for tumor MRI, such as contrast enhancement, local distortion of healthy tissue, infiltrating edema adjacent to tumors, destruction and deformation of fiber tracts, and multi-modal MRI contrast of healthy tissue and pathology. The new method synthesizes pathology in multi-modal MRI and diffusion tensor imaging (DTI) by simulating mass effect, warping and destruction of white matter fibers, and infiltration of brain tissues by tumor cells. We generate synthetic contrast enhanced MR images by simulating the accumulation of contrast agent within the brain. The appearance of the the brain tissue and tumor in MRI is simulated by synthesizing texture images from real MR images. The proposed method is able to generate synthetic ground truth and synthesized MR images with tumor and edema that exhibit comparable segmentation challenges to real tumor MRI. Such image data sets will find use in segmentation reliability studies, comparison and validation of different segmentation methods, training and teaching, or even in evaluating standards for tumor size like the RECIST (Response Evaluation Criteria in Solid Tumors) criteria.
Keywords: Brain MRI, segmentation validation, tumor simulation, simulation of tumor infiltration, diffusion tensor imaging, ground truth, gold standard
1 Introduction
The segmentation of brain tumor from magnetic resonance (MR) images is a vital process for treatment planning, monitoring of therapy, examining efficacy of radiation and drug treatments, and studying the differences of healthy subjects and subjects with tumor. The process of automatically extracting tumors from MR images is a challenging process. This leads to many different approaches for automatic tumor segmentation (Clark et al., 1998; Kaus et al., 2001; Prastawa et al., 2004). The usual standard used for validating segmentation results of the automatic methods is the manual segmentation results done by human experts. However, different investigators are likely to employ different image acquisition parameters and different manual segmentation techniques. A compounding issue is that any manual segmentation method suffers from lack of reliability and reproducibility. Even if a rich set of manual segmentations are available, they may not reflect the ground truth and the true gold standard may need to be estimated (Warfield et al., 2004). Furthermore, validation is typically not performed for the segmentations of non-tumor structures since manual segmentations of edema and the healthy brain tissue are very challenging tasks and have a high degree of variability.
Brain MRI exhibiting tumor is difficult to segment due to a combination of the following factors:
The deformation of brain tissue due to tumor mass effect or volume expansion.
The infiltration of brain tissue by tumor and edema (swelling). Edema appears around tumor mainly in the white matter regions and may also contain infiltrative tumor cells.
The gradual transition between tumor, edema, and surrounding brain tissue. This results in the ambiguity of the structural boundaries.
The T1w MRI with contrast enhancement, typically using a gadolinium agent, is the standard modality for identifying tumors. This modality results in active tumor tissue appearing with bright intensity. Unfortunately, blood vessels also appear bright while parts of tumor that are necrotic do not have higher levels of intensity. Therefore, the information provided by the intensities in this modality is not always consistent, and it is generally impossible to segment the tumor by thresholding the intensities in this image modality.
In order to provide objective assesments of segmentation performace, there is a need for an objective 3D ground truth with associated MR images that exhibit the same major segmentation challenges as that of common, realistic scans of a tumor patient. A database of real brain tumor MR images, along with their segmentations, may provide the means to measure the performance of an algorithm by comparing the results against the variability of the expert raters’ judgements. However, an objective evaluation to systematically compare different methodologies also needs a ground truth with little or no variability. An example of such a ground truth is the synthetic brain MRI database provided by the Montreal Neurological Institute 1 that is currently considered to be the common standard for evaluating the segmentations of healthy brain MR images. For this purpose, we propose a method that generates realistic looking MR images with the associated ground truth by approximating the brain tumor generation process.
Rexilius et al.(Rexilius et al., 2004) proposed a framework for generating digital brain phantoms with tumor. They used a biomechanical linear elastic finite element model to simulate the tumor mass effect. In their method, the MRI of a healthy subject is deformed and a tumor structure from a real subject is inserted into the MRI. Their model for edema is computed from the distances to the tumor boundary and the white matter mask. This is insufficient to simulate real edema infiltration properties since infiltration can occur in regions away from tumor. Such regions are typically connected through white matter fibers. The framework of Rexilius et al. only considered contrast enhancement inside tumors, without contrast enhancement of blood vessels.
Models for brain tumor expansion and edema have been proposed by Nagashima et al.(Nagashima et al., 1990a), Clatz et al.(Clatz et al., 2004, 2005), and Mohamed et al.(Mohamed and Davatzikos, 2005; Mohamed et al., 2006). More recently, Clatz et al. developed a realistic tumor growth model that explicitly simulates the main effects of tumor growth (mass effect and infiltration) using simple computational models. Clatz et al. used a linearized biomechanical finite element model to simulate mass effect and they used a reaction-diffusion process that is modulated by the diffusion tensor field to simulate the infiltration by tumor cells and edema. The simple computational models used by Clatz et al. are ideal for generating realistic tumor models in an efficient manner. We propose a method for generating new pathological ground truth by applying their mass effect and infiltration model to a well defined ground truth for normal brains. Additionally, we propose to extend the Clatz et al. model by using random pressure directions, and by simulating the effect of volume expansion on the white matter fibers by warping the diffusion tensors and making them more isotropic depending on the magnitude of local deformations.
We develop a method for generating realistic-appearing contrast enhanced T1 weighted MR images (a standard modality for diagnosis) by simulating the accumulation of contrast agents in the brain. The corresponding multi-modal MR images (contrast enhanced T1w, T1w, and T2) are generated from the simulated ground truth and from textures that are synthesisized using samples of real tumor MRI data. Figure 1 shows an overview of the proposed method. Our method is capable of generating 3D whole brain ground truth that exhibits the primary effects of tumor on normal brains, along with simulated multimodal MR images that are challenging to segment.
Fig. 1.

Overview of the generation of validation data. A well defined ground truth for normal brains is modified following a tumor and edema generation model that includes deformation and infiltration of normal tissue. The normal brain ground truth contains the probabilities for white matter, gray matter, and csf drawn from the BrainWeb data. The healthy tissue probabilities are modified to take into account mass effect and infiltration and new pathological probabilities are added (tumor and edema). The modified ground truth is then used to create the synthetic multi-modal MR images. The pathological simulation is described in Figure 2 and the MRI simulation is described in Figure 5.
The proposed method does not attempt to simulate the complete process of real tumor growth and the true MR image generation process. Instead, our aim is to generate a database of synthetic brain tumor MR images that have similar challenges for segmentation as in real tumors, along with the associated anatomical ground truth. The simulated brain tumor MR images can function as test data for any segmentation method and the ground truth can provide the means for objective assessment of segmentation performance. We do not aim to create a database of simulated brain tumor MR images that are indistinguishable from real brain tumor MR images. Such an effort requires the faithful modeling of the anatomical, chemical, and vascular changes in the brain due to tumor. It would also require the exact formulation of what neuroradiologists and neurosurgeons define as tumor. Currently, this definition involves a large degree of intuition and cannot be formulated algorithmically. Our simulated data provides a standard benchmark for different tumor segmentation methods that is currently not available to the community.
2 Generation of Pathological Ground Truth
Tumor and edema growth involves many concurrently occurring processes. As proposed by Wasserman et al.(Wasserman et al., 1996), the growth model may involve biomechanics, nutrient distribution, and metabolic processes. Since our goal is not to model tumor growth per se, we have chosen to simplify the model and use three separate sequential processes for efficiency, as shown in Figure 2. First, we simulate the deformation that is due to tumor mass effect using a biomechanical model. It is then followed by the simulation of the infiltration process using reaction-diffusion. Finally, we compute the deformation that is due to tumor infiltration of brain tissue and the mass effect of edema. The BrainWeb dataset (Cocosco et al., 1997), which contains multimodal MR images along with spatial probabilities of normal brain structures, is used as the healthy brain ground truth that is transformed into a pathological ground truth. Figure 3 shows subject 04 from a collection of 20 normals from the BrainWeb datasets (Aubert-Broche et al., 2006), which is used as the initial anatomical model for generating the results shown in this paper. The dataset of subject 04 includes spatial probabilities for each voxel being white matter, gray matter, cerebrospinal fluid, and blood vessel.
Fig. 2.
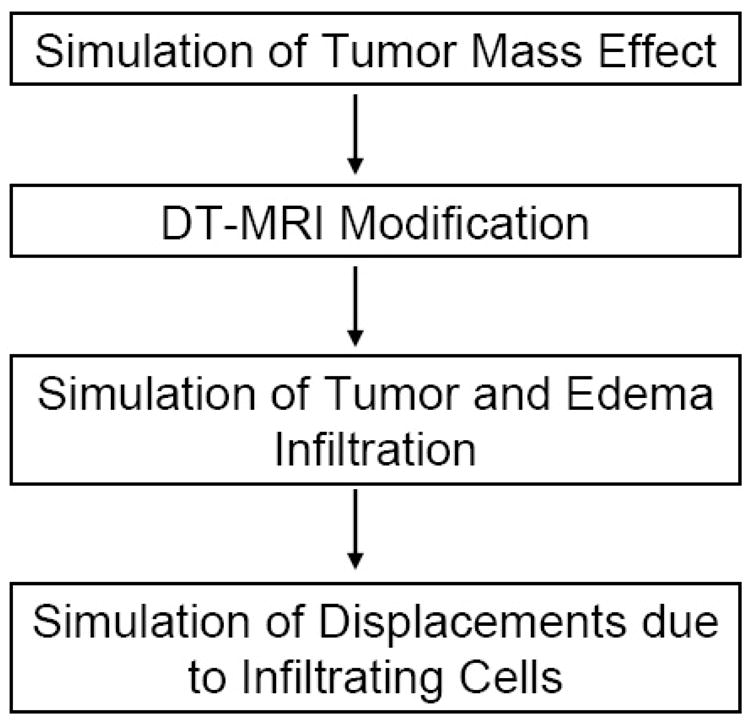
Overview of the simplified tumor and edema growth model. The model is composed of four sequential processes, where we simulate the deformation due to tumor expansion, the modification of DT-MRI due to the deformation, the infiltration of brain tissue by tumor cells and edema, and the displacements due to the infiltrating cells.
Fig. 3.

Axial views of subject 04 from the BrainWeb dataset of twenty normals, which provides a standard for validation of normal brain MRI segmentation. From left to right: the T1w image and the spatial probabilities for white matter, gray matter, csf, and blood vessels.
2.1 Mass Effect
The effect of tumor volume expansion on surrounding tissues is modeled using continuum mechanics (Gurtin, 1981). The initial tumor region is defined manually and then deformed to simulate mass effect. This initialization can also be done automatically given some prior knowledge of the spatial distribution, configuration, and image intensity characteristics of various brain tumor types. Meningiomas, for example, tend to be uniformly enhancing, to posses smooth borders, and to originate from meningothelial cells associated with the arachnoid and dura mater. Glioblastomas, on the other hand, tend to be ring enhancing with irregular borders and almost always arise within the white matter. Metastatic lesions tend to be solidly or ring enhancing, are often relatively spherical, and can appear in any location. The current work described in this paper provides examples of tumors that might likely represent metastatic lesions or small glioblastomas, but the approach is generalizable to any tumor type.
In the initial tumor region, the tumor probabilities are set to one, ptumor(x) = 1, and tissue or fluid probabilities are set to zero. The set of spatial probabilities for healthy tissue, along with the new tumor probabilities, are deformed according to the biomechanical model of brain tissue.
Brain deformation is modeled using the classic linear elasticity model. The constitutive equation that relates stress and strain is
| (1) |
and the corresponding linear strain-displacement equation is
| (2) |
where σ denotes the stress tensor, E denotes the elasticity tensor, ε denotes strain, and u denotes the displacement. Following Clatz et al.(Clatz et al., 2005), we use the linearized homogeneous version of the constitutive equation proposed by Miller (Miller, 2002) where brain tissue (white and gray matter) is assigned the value of 694 Pa for the Young modulus and 0.4 for the Poisson ratio. The falx cerebri, the fold of dura matter that divides the left and right bran hemispheres, is considered to be a sti3 material with the value of 200, 000 Pa for the Young modulus and 0.4 for the Poisson ratio. The skull is considered fixed and we assume brain tissue slides along contact with it.
The volume expansion due to tumor mass effect is simulated by using a homogeneous pressure that is applied to tissues surrounding tumor (Kyriacou et al., 1999; Mohamed and Davatzikos, 2005; Wasserman et al., 1996). The displacement field solution satisfies the static equilibrium equation
| (3) |
with fext being the external forces applied to the model. The external forces that act on the tumor surface is formulated as follows
| (4) |
where P is the constant pressure (in Pa), A is the surface area, and
 ℳℱ(n, κ) is a direction drawn randomly from the von Mises-Fisher distribution with mean direction n and concentration parameter κ (Mardia and Jupp, 2000). The von Mises-Fisher distribution can be considered as the directional analogue to the multivariate normal distribution, where we use the surface normal n as the mean direction and we use κ as the parameter that is inversely proportional to the spread or variability of the directions. The use of randomly generated directions increases the variability of the generated tumor shape and thus presents more challenges in segmenting the brain tumor. With regard to the displacements u, the following boundary conditions are applied:
- Sliding boundary condition in the regions where brain tissue contacts the skull,
where n is the normal direction for the element boundary (Miga et al., 1999b). The pressure inside the ventricular system is considered negligible relative to the pressure induced by tumor on the brain tissue, so the ventricular nodes are allowed to move freely.
The biomechanical problem is discretized using the finite element method, similar to the approaches used by Ferrant et al. (Ferrant et al., 2001) for interoperative registration and Kyriacou et al.(Kyriacou et al., 1999) for tumor mass effect simulation. We use the method proposed by Persson and Strang (Persson and Strang, 2004) to generate the tetrahedral mesh. The tetrahedral mesh generation is described in Appendix A. The displacement solution for the linear elastic model is computed by minimizing the potential energy,
| (5) |
details are available in (Clatz et al., 2005; Hughes, 2000). The displacement solutions are computed by taking into account the boundary conditions (Axelsson and Barker, 1984). The linearized growth process tends to result in slow deformations so the model solution is computed iteratively and integrated until the volume of the expanded tumor exceeds a particular threshold.
2.2 Modification of Diffusion Tensors
Tumor infiltration and edema generally occurs along white matter fibers, where diffusion is more likely. The properties of the white matter fiber within the brain is reflected in diffusion tensor MR images (DT-MRI). Since the BrainWeb data (Cocosco et al., 1997; Aubert-Broche et al., 2006) does not contain average diffusion tensor images, we generate the average tensors from 5 normal subjects. The subjects are drawn at random from a dataset that contains 100 subjects, designed to study differences across age groups (Mortamet et al., 2005) (age range is 18 – 74 years). We registered the 5 DT-MR images to the T2w image provided by BrainWeb by matching the associated mean diffusivity (MD) images to the T2w image using affine transformation and mutual information (Maes et al., 1997). The tensors are mapped and reoriented following the finite strain reorientation strategy proposed by Alexander et al.(Alexander et al., 2001). The average tensors at each voxel are computed using the efficient log-Euclidean tensor framework proposed by Arsigny et al.(Arsigny et al., 2005). Given image coordinate x, the average diffusion tensor is
| (6) |
where Exp is the matrix exponential function and Log is the matrix logarithm function. The Log function linearizes the space allowing us to use efficient linear operations to manipulate the tensors. The Exp function maps the result of the linear operations back to the original space of diffusion tensors.
We have found that registration and reorientation of DT-MRI may not be sufficient to generate edema that appears realistic. White matter fibers around a tumor tend to be displaced, and as observed by Lu et al.(Lu et al., 2003) in regions near the tumor the mean diffusivity (MD) tends to be increased while the fractional anisotropy (FA) tends to be decreased. This observations can be attributed to the destruction of white matter fibers due to tumor growth, which makes tensors more isotropic. Therefore, it was desirable to reflect this destruction in the simulator. To the best of our knowledge, the interactions between tumor growth and diffusion tensors are not fully understood, so we make the following assumptions:
Local volume expansion reduces tensor coherence and results in more isotropic tensors. Tumor tend to destroy white matter fibers so water is no longer restricted to flow in specific directions.
Local volume compression or shrinking does not modify tensor information. We have observed that in real tumor DT-MRI some fibers can appear condensed without being destroyed.
The influence of tumor mass effect on DT-MRI is modeled using a combination of image warping and nonlinear interpolation. The displacement of white matter fibers is simulated by warping the DT-MRI following the strategy described in (Alexander et al., 2001), where a rigid rotation is applied to each individual tensor. The rigid rotation is computed based on the local warping property. Given the displacement field u, we compute the local affine transform F = I3×3 + ∇u. This transform is decomposed into a rigid rotation component R and a linear deformation component W, F = RW. The reoriented tensor D is obtained using the following equation
| (7) |
where D0 is the resampled original tensor. The destruction of tensor information is modeled as a nonlinear interpolation between the original tensor and an isotropic version of the tensor. The isotropic version of a given tensor D is formulated as the identity matrix multiplied by the scaled determinant value of the original tensor:
| (8) |
A scale factor of 2 is used to increase the determinant of the tensor. This value is found through repeated experiments to find sufficiently realistic looking MD images with tumor. The transformed diffusion tensor is computed as follows (see (Arsigny et al., 2005) for details):
| (9) |
The interpolation weight α is inversely proportional to the amount of volume expansion
| (10) |
where J is the Jacobian matrix of coordinate mapping function and sJ reflects the amount of expansion that results in significant destruction of fibers. In regions with high amount of volume expansion (low values of α), the tensors become homogenized and no longer have preferred directions for diffusion. In regions with local volume compression, the determinant of the Jacobian is less than one and the original tensor is maintained since α = 1. This behavior is chosen to simulate destruction of white matter fibers due to expansive mass effect while ignoring compression effects. An example application of this model to a registered DT-MRI is shown in Figure 4.
Fig. 4.

Visualization of diffusion tensor MRI by axial views of 3D Mean Diffusivity (MD) and Fractional Anisotropy (FA) scalar images. The modified DT-MRI has higher MD and lower FA in the regions surrounding tumor, which models the destruction of the fibers. The MD image shows that the ventricle near the tumor is slightly deformed. The FA image shows that the white matter fibers near the tumor region are pushed away.
2.3 Tumor Infiltration
In order to simulate the growth and spreading of tumor cells following the preferred diffusion directions in the brain, the spatial probability that a particular location is infiltrated by pathological cells or fluid (edema) is evolved using a reaction-diffusion model guided by the modified DT-MRI (Clatz et al., 2005). More precisely, the change for pinfiltrated = φ in time is governed by
| (11) |
where cd is the diffusion rate, D′ is the diffusion tensor that has been modified using the method described in section 2.2, and cr is the reaction rate. The diffusion rate cd depends on the local tissue type. White matter is more likely to be infiltrated than gray matter, while csf is not likely to be infiltrated at all. The reaction rate or growth term cr is a constant. The diffusion tensors D′ are normalized so that the trace of the tensors is within the range of [0, 1]. The initial probability of tissue being infiltrated with tumor is chosen to be the probability of tumor after mass effect deformation: φ (x, t = 0) = pmass−effect(x). This probability is obtained by applying Gaussian smoothing to the manually defined tumor seed region after deformation, which simulates the margin of uncertainty for the tumor boundaries. The evolution is stopped when the volume of infiltrated brain regions exceeds a predefined fraction of the brain tissue volume.
The infiltrating tumor cells and edema also tend to displace nearby tissue. This results in a secondary mass effect that is coupled with the infililtration process. The effect of the infiltrating tumor cells is modeled using the equilibrium equation (Clatz et al., 2005)
| (12) |
where λ is the coupling factor that describes the contribution of an infiltrating tumor to the internal forces. The equilibrium equation can be interpreted as the application of body forces −λ∇φ to the classic linear elastic model, which models the outward forces proportional to the concentration of tumor cells.
Brain tissue can be infiltrated by edema (swelling) and/or tumor cells. Since edema regions can also contain tumor cells, it is difficult to classify or separate the infiltrating component into distinct tumor and edema regions. We approximate the distinction of non-enhancing edema by assigning the regions formed early in the infiltration process as tumor and assigning the regions formed later in the infiltration process as edema-like regions. This approximation is chosen since the concentration of tumor cells typically goes lower at locations further away from the main tumor bodys, and regions marked by clinicians as edema typically have low tumor cell count. Using this approach, we use the following spatial probability functions for the tumor and edema:
| (13) |
where pmass−effect is the deformed initial tumor probability according to the mass effect model, ptissue is the probability of brain tissue (white matter or gray matter), tfinal is the time where the infiltration process is stopped, and tearly is a fraction of the total time that indicates when we expect concentration of tumor cells would drop and infiltration would be dominated by fluid. The probability for infiltrated tissue is modeled as the probability that a location is both infiltrated and part of brain tissue. The choice for the value of tearly depends on the type of tumor being modeled. For example, an appropriate model for gliomas would typically have a large tearly since the active tumor cells in gliomas tend to infiltrate large regions. Alternatively, an appropriate model for menigiomas with large surrounding edema would involve a small value for tearly since most of the infiltrating regions should be attributed as edema. The proposed approach does not model edema in the strict biological sense. However, this distinction is necessary to determine regions with significant tumor presence against regions with mostly fluid as these two types of regions have very different appearances.
In summary, the creation of a new pathological ground truth that contain brain tumor and edema is performed through the following steps:
Manual definition of an initial tumor seed region in the space of a healthy ground truth data (e.g., the BrainWeb data).
Simulation of deformation of brain tissue due to tumor mass effect, given the anatomical description (the BrainWeb classification), the initial seed region, and the constant pressure value P at the tumor surface. The deformation is modeled as a linear biomechanical equation and computed iteratively to mimic the possible non-linear deformations.
Warping the average diffusion tensor MR images using the tumor mass effect displacements. Destruction of white matter fibers due to tumor is simulated by making tensors more isotropic depending on the magnitude of deformation.
Simulation of tissue infiltration using the DT-MRI guided reaction-diffusion equation (Equation 11) to account for infiltration of tissue by tumor cells and edema.
Simulation of deformation of brain tissue due to edema mass effect, given the infiltration probabilities and the value of λ for Equation 12.
3 Generation of MR Images
For the purpose of validating segmentation methods, we need a set of synthetic MR images that appear reasonably realistic and that correspond to the 3D pathological ground truth. These images serve as test data for the evaluation of segmentation methods. The generation of synthetic tumor MRI involves the simulation of two processes: contrast enhancement in T1w MRI due to the use of contrast agents (the standard modality for tumor diagnosis), and generation of intensity patterns similar to those observed in real MRI. These processes are detailed in the following two subsections. Contrast enhancement is simulated using a model of the accumulation of contrast agent in the brain, while the generation of realistic MRI intensity patterns is accomplished using texture synthesis. A conceptual view of the combination of the two processes for generating a synthetic contrast enhanced T1w image is shown in Figure 5.
Fig. 5.
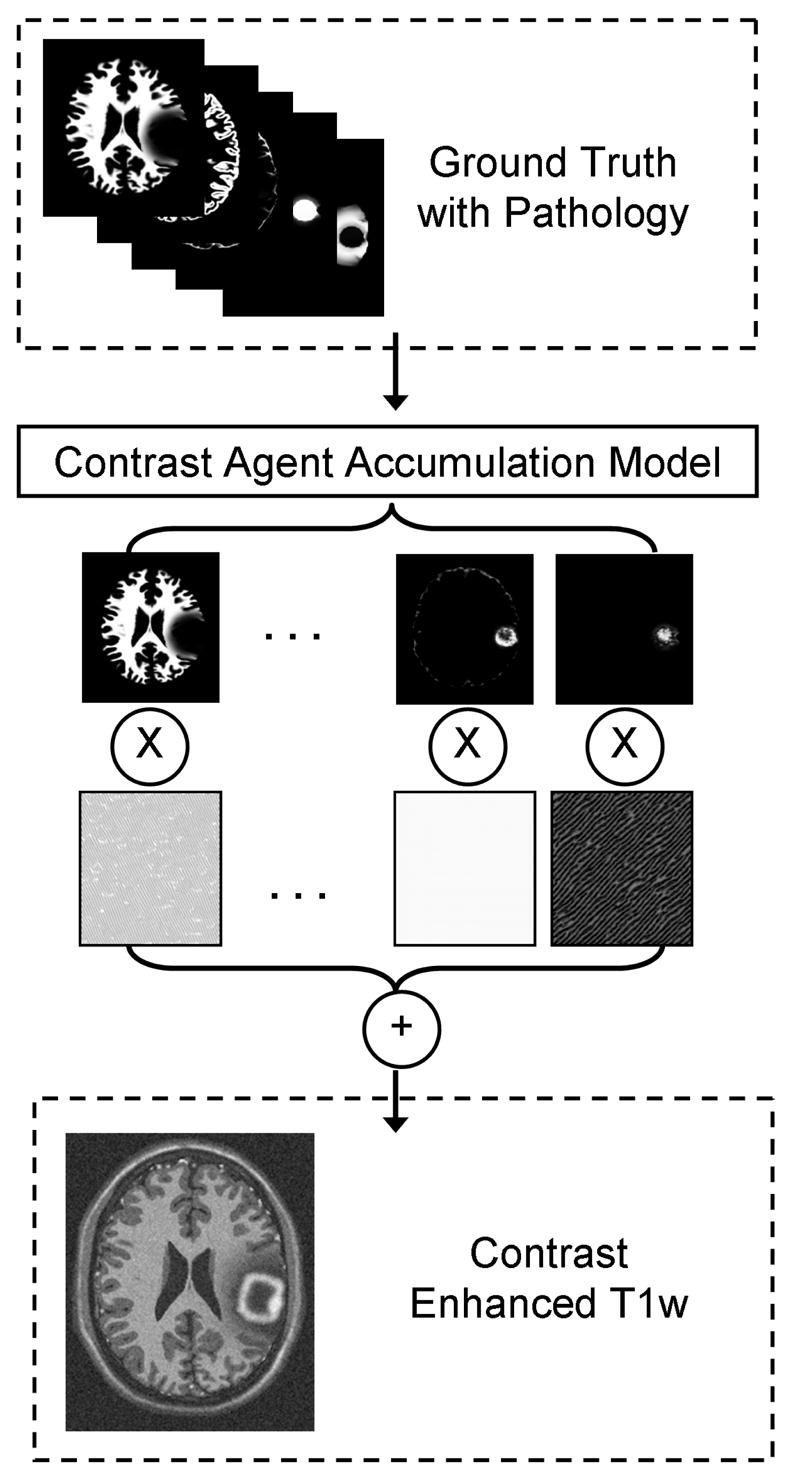
Generation of a synthetic contrast enhanced T1w image. The modified ground truth (the probabilities for white matter, gray matter, csf, tumor, and edema) is first used to determine where contrast agent is likely to accumulate. This is then followed by a combination of synthesized textures modulated by the spatial probabilities. In this figure we only show the probabilities and textures for white matter, non-highlighted tumor, and highlighted tumor and blood vessel regions. For generating the T1w and T2w modalities without contrast enhancement, the contrast agent accumulation is not simulated and the texture combination is done directly using the simulated ground truth.
3.1 Contrast Agent Accumulation
One of the particular challenges in segmenting brain tumor MRI are inconsistencies in the contrast enhanced T1w image, which can be attributed to biological processes such as tumor formation, blood flow, and cell death. The contrast agent is generally accumulated in regions other than the active tumor regions. Particularly, the blood vessels within the brain are almost always enhanced. Brain tissue may also appear enhanced if there is leakage of contrast agent due to the breakdown of the blood-brain barrier. Conversely, the contrast agent does not accumulate in the necrotic parts of the tumor at all, which are generally found in the core tumor regions.
We explicitly model the accumulation of the contrast agent in active tumor tissue and blood vessel regions in order to generate inconsistent contrast enhanced T1w images that are more challenging to segment. The spatial probability for the accumulation of contrast agent, paccum = γ, is evolved using a reaction-diffusion equation that models the spread of contrast agent within blood vessel and tumor regions while excluding necrotic regions:
| (14) |
Here, each I is an indicator function, ad is the diffusion rate for the contrast agent, asource is the source coefficient, and asink is the sink coefficient. The value of ad depends on the structure type at location x. We assign higher values of ad in blood vessel regions, moderate values of ad in tumor tissue, and very low values of ad in healthy tissue. The selection of the values of ad for each class models the fact that contrast agent is more likely to spread in blood vessel regions than in tumor tissue and is not likely to spread to healthy tissue at all. This corresponds to the actual biological process, where contrast agent is injected intravenously and then transported to the active tumor regions through the brain arteries. Healthy brain tissue generally does not accumulate contrast agent due to the blood-brain barrier. Conversely, there tends to be a higher accumulation of the contrast agent within and around tumor structures due to increased tumor metabolism and possible leakage of the blood-brain barrier.
Xsource and Xsink in Equation 14 are sets of points that act as sources or sinks, respectively. The source points Xsource are chosen at random from a probability function that indicates likely blood vessel regions or likely tumor regions that are close to the tumor boundary. These source regions correspond to regions that likely accumulate contrast agent and thus appear enhanced.
This provides an approximation of the accumulation of contrast agent through blood flow. The sink points Xsink are chosen at random from a probability function that indicates likely tumor regions that are close to the tumor core. The internal tumor regions are typically necrotic and thus do not accumulate contrast agent. The probability that a location is at the boundary or the core regions is computed using the distance maps and expressed as half-normal distributions. For example, when drawing points that are at the tumor border the following probability function is used:
| (15) |
where ψtumor(x) indicates the distance from a location x to the nearest tumor boundary point. ℋ
 (z, ω) denotes the half-normal distribution with parameter ω, which is defined as follows:
| (16) |
For a parameter value ω, ℋ
(z, ω) is a distribution with mean
and variance
. The border extent of the active tumor region or the standard deviation for ℋ
(ψtumor(x), ω) is a user-specified parameter value that is inversely proportional to ω. Tumors with nearly uniform enhancement can be simulated by drawing source pointsfrom a uniform distribution (within tumor), as opposed to a half-normal distribution, while non-enhancing tumors can be simulated by replacing the tumor source pointswith an empty set.
We initialize γ so that tumor and blood vessel regions have random probability of accumulating contrast agent: γ(x, t = 0) =
 (0, 1) × (ptumor(x)+ pvessel(x)). The initialization using the random variables
(0, 1) drawn from the uniform probability in [0, 1] ensures that the reaction-diffusion process is capable of generating complex patterns of enhancement. The probability that a location x would appear highlighted in the contrast enhanced T1w image is the probability that the structure in that location is either tumor or blood vessel and that it has accumulated contrast agent,
(0, 1) × (ptumor(x)+ pvessel(x)). The initialization using the random variables
(0, 1) drawn from the uniform probability in [0, 1] ensures that the reaction-diffusion process is capable of generating complex patterns of enhancement. The probability that a location x would appear highlighted in the contrast enhanced T1w image is the probability that the structure in that location is either tumor or blood vessel and that it has accumulated contrast agent,
| (17) |
Figure 6 shows an example of the generated contrast enhancement probabilities, while Figure 7 provides a comparison between real and synthetic contrast enhanced T1w MRI. The enhancement probabilities are generated using the method discussed in this subsection, and the synthetic MRI is generated using the method covered in the next subsection. The proposed contrast agent model accounts for the fact that blood vessel and active tumor regions are highlighted and that the necrotic regions are not highlighted. However, the model only accounts for the deformation of healthy blood vessels and does not account for the fact that new blood vessels can be formed inside and around the tumor regions (angiogenesis). The model does not explicitly model the ingrowth of new vessels into the tumor, however it uses reaction-diffusion to model the enhancing tumor regions. The proposed method only generates enhancement patterns inside the tumor and existing blood vessels without an explicit angiogenesis model for the formation of new blood vessels outside of the tumor.
Fig. 6.

Example probabilities generated for simulating contrast enhancement (axial view). Left: probability for highlighted blood vessel or tumor. Center: probability for non-highlighted tumor. Right: probability for white matter, included for anatomical context. Tumor periphery and blood vessel regions are the regions most likely to appear highlighted in the contrast enhanced T1w modality.
Fig. 7.

Sagittal view of the contrast enhanced T1w MRI for a real tumor (left) and a synthetic tumor (right) generated using the new method described in this paper. Both images show contrast enhancement in the superior sagittal sinus and the anterior cerebral artery. The tumor is located in the right posterior region and is not visible in this sagittal view.
3.2 Texture Synthesis
Deterministic simulation of the image generation process in MR is difficult, particularly with fuzzy tissue probabilities, so we have chosen to use a stochastic image generation model where images are drawn from a probability distribution. We use a database of texture samples (intensities within a neighborhood) from real tumor MR images to generate the intensity patterns for the different anatomical structures following the texture synthesis algorithm proposed by Wei and Levoy (Wei and Levoy, 2000). This approach only relies on samples from actual tumor MRI scans and does not make restrictive assumptions on the intensity distributions. The algorithm starts with an image that contains random noise (Matsumoto and Nishimura, 1998) and then proceeds to modify the image by finding neighborhood matches in the input texture. The neighborhood search is done deterministically across scales and is made efficient by clustering the texture neighborhood features. Rather than performing the search by comparing a random neighborhood with all the data samples, their method uses the Tree Structured Vector Quantization (TSVQ) technique to efficiently limit the search to the relevant clusters by constructing and making use of a tree structure that represents the texture samples.
The synthetic MR images are generated by linearly combining the texture synthesis results for each structure. To simulate partial voluming and the ambiguity in the boundary, the textures are weighed by the soft/fuzzy class probabilities. For a modality k, the synthetic MR intensity for each location x is
| (18) |
where c indexes the NCk different classes for the modality k. For the T1w and T2w modality, the set of brain structure classes is composed of white matter, gray matter, csf, tumor, and edema. For the contrast enhanced T1w modality, the set of brain structure classes is composed of white matter, gray matter, non-enhancing tumor, edema, and the class for all contrast enhanced structures. The contrast between different classes is adjusted via the user-specified coefficients mc, k, which are chosen to generate realistic-appearing MRI. As an example, a higher value of m1, k is chosen for white matter (e.g., 1.2) and a lower value of m2, k is chosen for gray matter (e.g., 0.7) when generating T1w images with good white-gray matter difference. The probabilities from the pathological ground truth are represented by pc. The images Tc, k are generated using texture synthesis from actual tumor MRI samples. Noise in the image data is simulated using
0,σk, which is randomly generated from a normal distribution with zero mean and standard deviation σk that is voxelwise independent.
4 Results
We generated five synthetic MR datasets with varying tumor location, tumor count, levels of tumor expansion, and extent of edema. Figures 8 and 9 show MR images of observed clinical cases that demonstrate the true variations of tumor appearance. The five synthetic brain tumor MRI datasets with similar variations are shown in Figures 10 and 11. SimTumor001 shows a tumor with significant mass effect and large surrounding edema. SimTumor002 shows a tumor that displaces the right ventricle from below and a moderate extent of edema. SimTumor003 shows a large tumor that compresses the left ventricle. SimTumor004 shows two tumors that displace the left ventricle from the internal regions. SimTumor005 shows a small tumor in the anterior region with no contrast enhancement, which is shown most clearly in the T2w image. In both the real and synthetic MRI there are deformations of the surrounding healthy tissue due to tumor and there are ambiguities in the definition of the boundaries between tumor and the surrounding structure (edema or tissue). In all cases, tumor deforms other structures and edema infiltrates brain tissue. The contrast enhanced T1w images for SimTumor001, SimTumor002, and SimTumor004 show complex patterns of highlighted intensities; contrast enhancement occurs mainly at active tumor regions in the tumor periphery and the blood vessel regions. We also simulate other patterns of enhancement for tumor, as shown in SimTumor003 with a nearly uniform pattern of enhancement and in SimTumor005 with no enhancement. The blood vessels appear higlighted in all simulated cases, similar to images typically observed in the clinic.
Fig. 8.

Axial views of real MR images with varying brain tumor appearances. From top to bottom: Tumor020, Tumor031, Tumor049, Tumor087, Tumor033. From left to right: contrast enhanced T1w, T1w, and T2w images.
Fig. 9.

Coronal views of real MR images with varying brain tumor appearances. From top to bottom: Tumor020, Tumor031, Tumor049, Tumor087, Tumor033. From left to right: contrast enhanced T1w, T1w, and T2w images.
Fig. 10.

Axial views of the MR images of the synthetic dataset. From top to bottom: SimTumor001, SimTumor002, SimTumor003, SimTumor004, and SimTumor005 MRI datasets. From left to right: contrast enhanced T1w, T1w, and T2w images.
Fig. 11.

Coronal views of the MR images of the synthetic dataset. From top to bottom: SimTumor001, SimTumor002, SimTumor003, SimTumor004, and SimTumor005 MRI datasets. From left to right: contrast enhanced T1w, T1w, and T2w images.
The simulated images for SimTumor001, SimTumor003, SimTumor004, and SimTumor005 are generated using relatively spherical seed regions with radius ranging from 2 – 5 mm. The large, elongated tumor in SimTumor002 is generated using a block seed with dimensions that are roughly 10×10×30 mm. For all the cases, we use pressure values that range from 2 – 5 kPa for simulating the mass effect at each iteration.
The associated ground truth for all cases is shown in Figures 12 and 13. The ground truth is represented as a set of spatial probability maps for tissue and pathology. This provides advantage over binary data or class membership data since this allows the validation to use probabilistic statistical analysis rather than simple volume comparison.
Fig. 12.

Axial views of the ground truth for the 3D synthetic brain tumor MRI data sets. From top to bottom: spatial probabilities for SimTumor001, SimTumor002, SimTumor003, SimTumor004, and SimTumor005 datasets. From left to right: class probabilities for white matter, gray matter, csf, edema, and tumor.
Fig. 13.

Coronal views of the ground truth for the 3D synthetic brain tumor MRI data sets. From top to bottom: spatial probabilities for SimTumor001, SimTumor002, SimTumor003, SimTumor004, and SimTumor005 datasets. From left to right: class probabilities for white matter, gray matter, csf, edema, and tumor.
Qualitative comparisons between the real tumor MR images and the simulated MR images demonstrate that the images present similar segmentation challenges. In order to verify that the synthetic MR images and the synthetic ground truth match human perception and high level knowledge, we performed a limited quantitative comparison of the simulated tumor volumes.
A human rater segments the tumor from the simulated tumor MRI manually via slice-by-slice painting, and a second rater segments the tumor using a user guided semi-automatic segmentation method based on level set evolution (Ho et al., 2002; Yushkevich et al., 2006) 2. Following standard practice, the segmentations were primarily driven by the contrast enhanced T1w images. An exception is the segmentation for the small non-enhancing tumor in SimTumor005, which is done by outlining the tumor boundary in the T2w image. The segmented tumor volumes from both human raters are then compared against the computed ground truth for each case. The measures used for comparison are the volume overlap metric and the average surface distances, generated using the VALMET validation tool (Gerig et al., 2001). The volume overlap metric we use is the Dice similarity coefficient (DSC) (Dice, 1945). For a given pair of segmentation volumes A and B, the measured overlap is 2(A ∩ B)/(|A| + |B|). The volumetric values for tumor and edema are shown in Table 1. Volumes are measured as the integral of the spatial probabilities of the relevant structure. Table 2 shows the quantitative comparison results between the synthetic ground truth and the manually drawn segmentations, while Table 3 shows the quantitative comparison results between the synthetic ground truth and the semi automated segmentations. The inter-rater variability for the human raters are shown in Table 4. The surface distances typically differ less than 1 mm, for both the comparison against the manual drawings and against the semi-automatic method. Manual segmentation of the small non-enhancing tumor in SimTumor005 has the worst performance, which is expected since segmentation of small structures require fine details that are difficult to obtain using slice-by-slice painting. The difference between the user-guided segmentation results and the synthetic ground truth is mainly in the definition of the extent of tumor boundaries. The definition of tumor extent is generally ambiguous due to surrounding edema. Compared to the manual segmentation results, the semi-automatic segmentation results more closely resemble the simulated ground truth as the level set evolution generates more detailed tumor contours in full 3D. The comparisons of the human segmentations show that the computed ground truth matches the definition of tumors perceived by the human raters.
Table 1.
Volumes of the tumor and edema structures in the synthetic datasets.
| Dataset | Tumor Volume (mm3) | Edema Volume (mm3) |
|---|---|---|
| SimTumor001 | 32015.514 | 121811.878 |
| SimTumor002 | 98575.875 | 28258.482 |
| SimTumor003 | 18806.871 | 42037.153 |
| SimTumor004 | 101698.173 | 124429.275 |
| SimTumor005 | 15578.792 | 490.047 |
Table 2.
Comparison of the synthetic ground truth to the segmentations drawn by a human expert for the simulated brain tumor MRI datasets.
| Dataset | DSC (%) | Average surface distance (mm) |
|---|---|---|
| SimTumor001 | 0.922 | 0.691 |
| SimTumor002 | 0.940 | 0.717 |
| SimTumor003 | 0.908 | 0.661 |
| SimTumor004 | 0.915 | 0.824 |
| SimTumor005 | 0.776 | 1.460 |
Table 3.
Comparison of the synthetic ground truth to semi-automatic segmentations for the simulated brain tumor MRI datasets.
| Dataset | DSC (%) | Average surface distance (mm) |
|---|---|---|
| SimTumor001 | 0.965 | 0.324 |
| SimTumor002 | 0.956 | 0.623 |
| SimTumor003 | 0.929 | 0.573 |
| SimTumor004 | 0.933 | 0.823 |
| SimTumor005 | 0.876 | 0.941 |
Table 4.
Comparison of the semi-automatic segmentations to the segmentations drawn manually by a human expert for the simulated brain tumor MRI datasets, indicating the inter-rater variability.
| Dataset | DSC (%) | Average surface distance (mm) |
|---|---|---|
| SimTumor001 | 0.917 | 0.738 |
| SimTumor002 | 0.928 | 0.873 |
| SimTumor003 | 0.886 | 0.815 |
| SimTumor004 | 0.906 | 0.957 |
| SimTumor005 | 0.820 | 1.151 |
5 Discussion and Conclusions
We presented a new method for generating modified ground truth with tumor and edema from a normal brain ground truth, along with a method for generating synthetic multi-modal MR images that present similar segmentation challenges as real tumor MRI. The process for generating a synthetic brain tumor dataset is summarized in Figure 14. Our proposed simulation scheme introduces a tensor model for the warping and desctruction of white matter fibers (demyelination). The scheme also introduces a contrast enhancement simulation using vascular information that can simulate different patterns of enhancement that are typically observed in real tumor MRI (ring enhancement, uniform enhancement, and no enhancement).
Fig. 14.

Summary of the generation of synthetic brain tumor ground truth together with the associated brain tumor MRI (here only the contrast enhanced T1 image is shown).
We have performed a limited validation by comparing the synthetic ground truth with the tumor segmentations done by human raters. The results verify that there is a satisfactory level of agreement between the tumors perceived within the synthetic MRI and the synthetic ground truth. The synthetic brain tumor MRI along with the associated ground truth provide the means for performing objective validation of different brain tumor MRI segmentation frameworks. Objective evaluation of different segmentation methods can be done by using a set of synthetic images with variations of tumor size, location, extent of surrounding edema, and contrast enhanced regions. Given a segmentation framework for brain tumor MRI, it can be tested using the synthetic multimodal brain tumor MRI as input images. A user can then measure its performance by comparing the segmentation results and the synthetic ground truth. Compared to validation against manual segmentations, this approach has the advantage of having consistent, known ground truth for the whole brain, which includes white matter, gray matter, csf, and edema. This capability is novel as most validations done so far were focused on tumor only and not performed on the infiltrated and deformed healthy tissue.
It is important to note that our goal is to generate sufficiently realistic MR images that are challenging to segment. The accurate modeling of tumor growth and MR image synthesis are beyond the scope of our current work. Accurate tumor modeling would require the formulation of the complex interactions between the deformation process, the infiltration process, the nutrient and chemical interactions, along with blood vessel formations. For example, Zheng et al. (Zheng et al., 2005) proposed a more detailed model for 2D data. However, a full 3D implementation of their model for the whole brain would be a significant challenge. The generation of MR images involves complex modeling of MR pulse sequences and nuclear magnetic resonance properties of different structures. These are significant challenges as healthy tissue, tumor, and edema are modeled as fuzzy probabilistic quantities that can have intricate interactions. In this paper, we focus on the generation of test images that empirically exhibits pathology seen in real images, with the main purpose to use the simulated images and ground truth for validation and cross-comparison of different image segmentation methods. Our synthetic brain tumor MR images are not designed to deceive neuroradiologists and neurosurgeons, and we do not claim that improved segmentation procedures resulting from such simulations would finally result in improved outcome of tumor treatment. These images are designed to be used as a standard benchmark for a variety of tumor segmentation methods, similar to the way the BrainWeb data are used for comparing healthy brain segmentations. While the BrainWeb images and our simulated brain tumor images do not appear completely realistic, we believe that they can function as good performance benchmarks because they provide practical segmentation challenges. To our knowledge, a public database for segmentation benchmarks is currently not available for brain tumor MR images.
Brain tumor growth is a very complex process and it is extremely challenging to account for all the variables that govern the process. One possible extension to the method proposed in this paper is the simulation of the formation of new blood vessels (angiogenesis). Tumor cells are known to generate biological signals that induce formation of blood vessels to supply additional energy for the increased metabolism. Bullitt et al. (Bullitt et al., 2003) also observed that vessels in and around the tumor tend to have larger variability in the curve angles and become more tortuous. Simulating blood vessel formation and shape changes will allow for the generation of more realistic mass effect and infiltration models and improve the appearance of the synthetic contrast enhanced T1w image. The simulation of the deformation due to tumor mass effect could be improved by using more complex computational model such as the biphasic models proposed by Miga et al. (Miga et al., 1999a,b) and Nagashima et al. (Nagashima et al., 1990b). Another possible extension is a more detailed modeling of the changes in csf volume and flow. If the intracranial pressure is high, there tends to be a loss of csf volume (which may not be restricted to the ventricles). If brain tumor blocks ventricular outflow, the csf volume can increase.
The method described in this paper can also be extended to other cases that deviate from normal adult MRI. One direct extension is in the simulation of lesions in cases of vascular strokes and multiple sclerosis. These cases typically present multiple regions with tissue infiltration and small scale deformation that can be generated using our method. Other possible extensions are developments of new growth models for the validation of segmentations in age related studies, where there is a lack of well defined ground truth in the very young (newborn infants) and the elderly age groups (older than 70 years). In both age groups, there is very low differentiation between white matter and gray matter. In the case of newborn infants, the white matter undergoes a growth process called myelination which is mainly an infiltrative process. The lack of reliable ground truth for this age group makes validation difficult, and a typical solution is to restrict the validation to only a part of the 3D volume (Prastawa et al., 2005). In elderly subjects, the ventricles are typically enlarged. However, the increase of ventricular volume may be governed by the loss of tissue integrity (i.e., a change in tissue elasticity) and not by an increased ventricular pressure, so a biomechanical model with expansion due to ventricular pressure similar to the one described in this paper may not be appropriate.
The methodology for generating synthesized tumor MRI could be further developed into web-accessible system where a user could interactively select locality, size, shape, and type of tumors by setting some variables (similar to the BrainWeb interface (Cocosco et al., 1997)). Image datasets generated by the tool might find use in validation of segmentation methods, comparison of different segmentation and registration strategies, and training and teaching. For example, the effect of voxel size and slice thickness on tumor volume estimates might be studied systematically. Moreover, a series of images with embedded tumors of various size and shape might be used to evaluate well-established standards for tumor size measurements like the one-dimensional RECIST (Response Evaluation Criteria in Solid Tumors) (Therasse et al., 1999) criterion, which uses the maximum diameter of the structure measured only in axial cross-sections. Systematic studies and evaluations would eventually lead to improved assessment metrics.
The simulation software for generating synthetic brain tumor MR images and example datasets are available for download at http://www.ucnia.org under “Software and Data”. We are aiming to make available a range of real clinical brain tumor MR images, with annotated tumor regions, available on the web in the near future. A database of real brain tumor images would be complementary to our proposed method. However, this database has some limitations compared to the synthetic database. The segmentations were done primarily by one human expert and lack objective ground truth, and they are limited to the tumor regions. Thus, any analysis performed using this database of real brain tumor MR images, as opposed to the synthetic database, will be biased and subjective. A range of healthy brain MR images that was acquired in a similar fashion is already publically available at http://hdl.handle.net/1926/594.
Acknowledgments
The authors would like to thank Sarang Joshi (University of Utah) and Stephen Pizer (University of North Carolina) for providing useful feedback on parts of the manuscript, and the maintainers and contributors of the open source packages Insight Toolkit (Kitware, 2008a) and Visualization Toolkit (Kitware, 2008b) for providing the framework for the software system described in this paper.
This work was supported by the NIH NIBIB under grant R01 EB000219.
Appendix A: Mesh Generation
The tetrahedral mesh is generated using the method proposed by Persson and Strang (Persson and Strang, 2004). The advantage of this method is that the implementation is relatively simple and can be generalized to any number of dimensions, provided a corresponding Delaunay tessellation implementation. The results presented in this paper uses the Qhull software package (Barber et al., 1996). The mesh generation process is composed of three steps: selection of points, tessellation of the points, and adjustment of the point locations. After the tessellation process, the points are adjusted so that edge lengths are optimal and that edge lengths do not cross the external boundary or the internal structural boundaries. The edge lengths in the 3D tetrahedral mesh are optimal when they match a distribution function. For an edge that connects two points x and y, the ideal edge length is proportional to the distribution function evaluated at the edge midpoint . We have chosen to use the following function,
| (.1) |
Where ψ(z) is the distance from z to the closest structural boundary. Assuming that the distance functions ψc for each structural class c is defined to be positive inside the relevant structure and zero otherwise, ψ(z) = mincψc(z). Using this function results in smaller tetrahedra near structural boundaries and larger tetrahedra in the internal regions. This behavior is desirable since brain structures typically have complex and detailed shapes at the boundaries that can be better interpolated using small-sized tetrahedra. In order to avoid mesh distortions when computing the deformations, we recompute the Delaunay triangulation for the mesh at each deformation iteration.
Appendix B: Inversion of Displacement Fields
In order to generate realistic tumor MRI, we simulate the expansion process. However, the inverse of the expansive deformation is required to resample the probability images and the average DT image. A true inverse may not exist since the expansive deformation may not be smooth and invertible, so we estimate inverse of the deformation field using an iterative process. Given a displacement field u that maps x to y, y = x + u(x), we compute u−1 where x = y + u−1(y). This is done by estimating the inverse mapping for y, denoted by x̂. The vector x̂ must minimize the residual difference
| (.2) |
which expresses the distance between the forward map of the inverse estimate and the current location. The ideal value of x̂ is computed by doing iterative minimizations (e.g., by Newton’s method) at each location y in the target image. For an ideal inverse mapping, d(x̂, y) should be close to zero at any given y. The inverse displacement field u−1 is obtained directly from the x̂ estimate, u−1(y) = x̂ − y.
Footnotes
BrainWeb: http://www.bic.mni.mcgill.ca/brainweb
ITK-SNAP: http://www.itksnap.org
Publisher's Disclaimer: This is a PDF file of an unedited manuscript that has been accepted for publication. As a service to our customers we are providing this early version of the manuscript. The manuscript will undergo copyediting, typesetting, and review of the resulting proof before it is published in its final citable form. Please note that during the production process errors may be discovered which could affect the content, and all legal disclaimers that apply to the journal pertain.
References
- Alexander DC, Pierpaoli C, Basser PJ, Gee JC. Spatial transformations of diffusion tensor magnetic resonance images. IEEE Trans Med Imaging. 2001;20(11):1131–1139. doi: 10.1109/42.963816. [DOI] [PubMed] [Google Scholar]
- Arsigny V, Fillard P, Pennec X, Ayache N. Fast and simple calculus on tensors in the log-euclidean framework. Proc MICCAI 2005 LNCS. 2005;3749:115–122. doi: 10.1007/11566465_15. [DOI] [PubMed] [Google Scholar]
- Aubert-Broche B, Griffin M, Pike GB, Evans AC, Collins DL. Twenty new digital brain phantoms for creation of validation of image data bases. IEEE Trans Med Imaging. 2006 November;25(11):1410–1416. doi: 10.1109/TMI.2006.883453. [DOI] [PubMed] [Google Scholar]
- Axelsson O, Barker VA. Finite element solution of boundary value problems. Academic Press; 1984. [Google Scholar]
- Barber CB, Dobkin DP, Huhdanpaa H. The Quickhull algorithm for convex hulls. ACM Trans on Mathematical Software. 1996;22(4):469–483. [Google Scholar]
- Bullitt E, Gerig G, Pizer SM, Aylward SR. Measuring tortuosity of the intracerebral vasculature from MRA images. IEEE Trans Med Imaging. 2003;22:1163–1171. doi: 10.1109/TMI.2003.816964. [DOI] [PMC free article] [PubMed] [Google Scholar]
- Clark MC, Hall LO, Goldgof DB, Velthuizen R, Murtagh FR, Silbiger M. Automatic tumor-segmentation using knowledge-based techniques. IEEE Trans Med Imaging. 1998;117:187–201. doi: 10.1109/42.700731. [DOI] [PubMed] [Google Scholar]
- Clatz O, Bondiau P-Y. Hervé Delingette Grégoire Malandalin, Maxme Sermesant, S. K. W., Ayache, N., 2004. In silico tumor growth: Application to glioblastomas. Proc MICCAI. 2004;3217:337–345. [Google Scholar]
- Clatz O, Sermesant M, Bondiau PY, Delingette H, Warfield SK, Malandain G, Ayache N. Realistic simulation of the 3D growth of brain tumors in MR images including diffusion and mass effect. IEEE Trans Med Imaging. 2005 October;24(10):1344–1346. doi: 10.1109/TMI.2005.857217. [DOI] [PMC free article] [PubMed] [Google Scholar]
- Cocosco CA, Kollokian V, Kwan R-S, Evans AC. BrainWeb: Online interface to a 3D MRI simulated brain database. NeuroImage. 1997;5(4) [Google Scholar]
- Dice LR. Measures of the amount of ecologic association between species. Ecology. 1945 July;26(3):297–302. [Google Scholar]
- Ferrant M, Nabavi A, Macq B, Jolesz FA, Kikinis R, Warfield SK. Registration of 3D interoperative MR images of the brain using finite element biomechanical model. IEEE Trans Med Imaging. 2001;20(12):1384– 1397. doi: 10.1109/42.974933. [DOI] [PubMed] [Google Scholar]
- Gerig G, Jomier M, Chakos M. Proc MICCAI LNCS 2208. Springer Verlag; VALMET: A new validation tool for assessing and improving 3d object segmentation. [Google Scholar]
- Gurtin ME. An introduction to continuum mechanics. Academic Press; 1981. [Google Scholar]
- Ho S, Bullitt E, Gerig G. Level set evolution with region competition: Automatic 3-D segmentation of brain tumors. In: Katsuri R, Laurendeau D, Suen C, editors. Proc 16th International Conference on Pattern Recognition. IEEE Computer Society; Aug, 2002. pp. 532–535. [Google Scholar]
- Hughes TJR. The finite element method: linear static and dynamic finite element analysis. Dover; 2000. [Google Scholar]
- Kaus M, Warfield S, Nabavi A, Black PM, Jolesz FA, Kikinis R. Automated segmentation of MR images of brain tumors. Radiology. 2001;218(2):586–591. doi: 10.1148/radiology.218.2.r01fe44586. [DOI] [PubMed] [Google Scholar]
- Kitware. Insight toolkit. 2008a World Wide Web electronic publication. URL http://www.itk.org.
- Kitware. Visualization toolkit. 2008b World Wide Web electronic publication. URL http://www.itk.org.
- Kyriacou SK, Davatzikos C, Zinreich SJ, Bryan RN. Nonlinear elastic registration of brain images with tumor pathology using a biomechanical mode. IEEE Trans Med Imaging. 1999;18(7):580–592. doi: 10.1109/42.790458. [DOI] [PubMed] [Google Scholar]
- Lu S, Ahn D, Johnson G, Cha S. Peritumoral diffusion tensor imaging of high-grade gliomas and metastatic brain tumors. AJNR. 2003 May;24(5):937–941. [PMC free article] [PubMed] [Google Scholar]
- Maes F, Collignon A, Vandermeulen D, Marchal G, Suetens P. Multimodality image registration by maximization of mutual information. IEEE Trans Med Imaging. 1997 April;16(2):187–198. doi: 10.1109/42.563664. [DOI] [PubMed] [Google Scholar]
- Mardia KVM, Jupp PE. Directional Statistics. John Wiley and Sons; 2000. [Google Scholar]
- Matsumoto M, Nishimura T. Mersenne twister: A 623-dimensionally equidistributed uniform pseudorandom number generator. ACM Trans on Modeling and Computer Simulation. 1998 January;8(1):3–30. [Google Scholar]
- Miga M, Paulsen K, Kennedy FE, Hartov A, Roberts D. Proc MICCAI. Vol. 1999. Springer-Verlag; 1999a. Model-updated image guided neurosurgery using the finite element method: incorporation of the falx cerebri; p. 1679. [DOI] [PMC free article] [PubMed] [Google Scholar]
- Miga MI, Paulsen KD, Lemery JM, Eisner SD, Hartov A, Kennedy FEWRD. Model-updated image guidance: initial clinical experience with gravity induced brain deformation. IEEE Trans Med Imaging. 1999b;18:866–874. doi: 10.1109/42.811265. [DOI] [PubMed] [Google Scholar]
- Miller K. PhD thesis. Warsaw Univ. Technol.; Warsaw, Poland: 2002. Biomechanics of brain for computer integrated surgery. [Google Scholar]
- Mohamed A, Davatzikos C. Proc MICCAI 2005. Vol. 3749. 2005. Finite element modeling of brain tumor mass-effect from 3D medical images; pp. 400–408. [DOI] [PubMed] [Google Scholar]
- Mohamed A, Zacharaki EI, Shen D, Davatzikos C. Deformable registration of brain tumor images via a statistical model of tumor-induced deformation. Medical Image Analysis. 2006;10:752–763. doi: 10.1016/j.media.2006.06.005. [DOI] [PubMed] [Google Scholar]
- Mortamet B, Zeng D, Gerig G, Prastawa M, Bullitt E. Effects of healthy aging measured by intracranical compartment volumes using a designed MR brain database. Proc MICCAI 2005. 2005;3749:383–391. doi: 10.1007/11566465_48. [DOI] [PMC free article] [PubMed] [Google Scholar]
- Nagashima T, Horwitz B, Rapoport SI. A mathematical model for vasogenic brain edema. Adv Neurol. 1990a;52:317–326. [PubMed] [Google Scholar]
- Nagashima T, Tada Y, Hamano S, Sakakura M, Masaoka K, Tamaki N, Matsumoto S. The finite element analysis of brain oedema associated with intracranial meningiomas. Acta Neurochir Suppl. 1990b;51:155–157. doi: 10.1007/978-3-7091-9115-6_52. [DOI] [PubMed] [Google Scholar]
- Persson PO, Strang G. A simple mesh generator in MATLAB. SIAM Review. 2004;46(2):329–345. [Google Scholar]
- Prastawa M, Bullitt E, Ho S, Gerig G. A brain tumor segmentation framework based on outlier detection. Med Image Analysis. 2004;8:275–283. doi: 10.1016/j.media.2004.06.007. [DOI] [PubMed] [Google Scholar]
- Prastawa M, Gilmore JH, Lin W, Gerig G. Automatic segmentation of MR images of the developing newborn brain. Medical Image Analysis. 2005;9:457–466. doi: 10.1016/j.media.2005.05.007. [DOI] [PubMed] [Google Scholar]
- Rexilius J, Hahn HK, Schlüter M, Kohle S, Bourquain H, Böttcher J, Peitgen H-O. A framework for the generation of realistic brain tumor phantoms and applications. Proc MICCAI 2004. 2004;3217:243–250. [Google Scholar]
- Therasse P, Arbuck SG, Eisenhauer EA, Wanders J, Kaplan RS, Rubinstein L, et al. New guidelines to evaluate the response to treatment in solid tumors. J Nat Cancer Inst. 1999;91:523–528. doi: 10.1093/jnci/92.3.205. [DOI] [PubMed] [Google Scholar]
- Warfield SK, Zou KH, Wells WM. Simultaneous truth and performance level estimation (STAPLE): an algorithm for the validation of image segmentation. IEEE Trans Med Imaging. 2004;23(7):903–921. doi: 10.1109/TMI.2004.828354. [DOI] [PMC free article] [PubMed] [Google Scholar]
- Wasserman R, Acharya R, Sibata C, Shin KH. A patient-specific in vivo tumor model. Mathematical Biosciences. 1996;136:111–140. doi: 10.1016/0025-5564(96)00045-4. [DOI] [PubMed] [Google Scholar]
- Wei L-Y, Levoy M. Proc SIGGRAPH 2000. 2000. Fast texture synthesis using tree-structured vector quantization; pp. 479–488. [Google Scholar]
- Yushkevich PA, Piven J, Hazlett HC, Smith RG, Ho S, Gee JJ, Gerig G. User-guided 3D active contour segmentation of anatomical structures: significantly improved efficiency and reliability. NeuroImage. 2006 January; doi: 10.1016/j.neuroimage.2006.01.015. In print. [DOI] [PubMed] [Google Scholar]
- Zheng X, Wise SM, Cristini V. Nonlinear simulation of tumor necrosis, neo-vascularization and tissue invasion via and adaptive finite-element/level-set method. Bulletin of Mathematical Biology. 2005;67:211–259. doi: 10.1016/j.bulm.2004.08.001. [DOI] [PubMed] [Google Scholar]