

Abstract
Background
Recent studies have shown associations between size and body proportions at birth and health outcomes throughout the life cycle, but there are few data on how neonatal phenotype varies in different populations around the world.
Methods
Data from the UK, Finland, India, Sri Lanka, China, DR Congo, Nigeria and Jamaica (N=22 067) were used to characterise geographical differences in phenotype in singleton, liveborn newborns. Measurements included birthweight, placental weight, length, head, chest, abdominal and arm circumferences and skinfolds.
Results
Neonates in Europe were the largest, followed by Jamaica, East Asia (China), then Africa and South Asia. Birthweight varied widely (mean values 2730g to 3570g), but in contrast, head circumference was similar in all except China (markedly smaller). The main difference in body proportions between populations was the head to length ratio, with small heads relative to length in China and large heads relative to length in South Asia and Africa.
Conclusions
These marked geographical differences in neonatal phenotype need to be considered when investigating determinants of fetal growth, and optimal phenotype for short-term and long-term outcomes.
Keywords: Size at birth, body proportions, neonatal anthropometry, worldwide variation, fetal origins of adult disease
Introduction
There are associations between size at birth and both short and long term health outcomes. Small size at birth has been associated with increased morbidity in infancy and childhood, and susceptibility to coronary heart disease and associated disorders in later life (1). Body proportions at birth predict adult coronary heart disease, high blood pressure, glucose intolerance and insulin resistance (1). These relationships vary across populations, for example in the UK and Finland, a low ponderal index (birthweight/birth length3) predicted an increased risk of developing adult type 2 diabetes (2, 3), while the opposite was found in India (4). In order to interpret these differences, geographical variation in neonatal phenotype and the factors which determine it need to be understood.
Most published studies presenting data on birth size only include weight, which is a crude summary measure of size at birth. Anthropometric measurements can be used to assess some of the individual components of birthweight: skeletal size, muscle and adipose tissue mass, and the size of internal organs. Some studies provide data on length and head size at birth (UK (5), Canada (6), India (7), China (8), Japan (9) Ethiopia (10) and Zambia (11)), although do not all present sex and gestation-specific values. In older studies, the values given may be out-dated, due to secular trends (12). To our knowledge, there is only one published study, based in Holland (13) that has presented comprehensive data, including standard deviation (SD) and percentile values for measures of neonatal muscle and fat in addition to weight, length and head size. Published data on neonatal body proportions are even more sparse; Denham et al. (14) and Hindmarsh et al. (15) have characterised shape based on birthweight and measures of skeleton, muscle and fat within the USA and UK respectively, but up to now, no analyses of this type have compared shape across populations.
Thus twenty studies from a wide geographical range of populations with data on 22 067 births have been used to characterise differences in neonatal phenotype. They have been made as comparable as possible by restricting to singleton, liveborn term births and adjusting for gestational age where recorded. Many of the studies include high quality detailed measurements. Our primary hypothesis was that differences in neonatal phenotype across geographical populations exist, and our secondary hypothesis was that within populations, phenotypes would be similar.
Materials and Methods
Studies
Studies carried out by, or in collaboration with, the Medical Research Council Environmental Epidemiology Unit in Southampton were considered for inclusion. All based on normal populations that provided maternal (reported in accompanying paper) and neonatal anthropometric measurements were used. The studies selected included the UK (Southampton (16-19), Preston (20), Sheffield (21), Farnborough (22), Isle of Man (23), Aberdeen (24)), Finland (Helsinki (25)), India (Mysore (26, 27), Pune (28, 29)), Sri Lanka (Kandy (30)), China (Beijing (31)), DR Congo (Kasaji (32)), Nigeria (Imesi (33, 34)), and Jamaica (Kingston (35, 36)). Most of these had previously been used to investigate associations between size at birth and later disease, others studied size at birth as the outcome.
The setting and main characteristics of each of the studies are detailed in Table I. All were urban-based except Pune 1, Kasaji and Imesi. Study designs were prospective (mothers recruited at or before delivery and babies measured as part of research studies of fetal growth, shaded rows in tables) or retrospective (data abstracted from existing routine obstetric records). Neonatal year of birth ranged from 1907 to 1998. All the prospective studies took place in the latter half of the 20th century, and covered relatively short periods, while retrospective studies were based on earlier years of birth, and covered longer periods.
Table I.
Description of the 20 studies
| Study | Setting | Design | Year of birth | Number in original study |
Number in current studya |
|---|---|---|---|---|---|
| Southampton 1 | Princess Anne Maternity Hospital, Southampton, UK | Prospective | 1992-93 | 596 | 557 |
| Southampton 2 | Princess Anne Maternity Hospital, Southampton, UK | Prospective | 1994-96 | 562 | 521 |
| Southampton 3 | Princess Anne Maternity Hospital, Southampton, UK | Prospective | 1987 | 390 | 377 |
| Southampton 4 | Princess Anne Maternity Hospital, Southampton, UK | Prospective | 1985 | 102 | 102 |
| Preston | Sharoe Green Hospital, Preston, UK | Retrospective | 1935-43 | 1298 | 1014 |
| Sheffield | Jessop Hospital for Women, Sheffield, UK | Retrospective | 1907-30 | 8577 | 4418 |
| Farnborough | Farnborough Hospital, Farnborough, Kent, UK | Prospective | 1975-77 | 1677 | 1677 |
| Isle of Man | Nobles Isle of Man Hospital, Isle of Man, UK | Prospective | 1991-92 | 452 | 388 |
| Aberdeen | Aberdeen Maternity Hospital, Aberdeen, Scotland, | Retrospective | 1948-54 | 260 | 233 |
| Helsinki | Helsinki University Central Hospital, Helsinki, Finland | Retrospective | 1924-33 | 7088 | 5989 |
| Mysore 1 | Holdsworth Memorial Hospital, Mysore, South India | Retrospective | 1938-95 | 2676 | 1237 |
| Mysore 2 | Holdsworth Memorial Hospital, Mysore, South India | Prospective | 1997-98 | 676 | 597 |
| Pune 1 | 6 rural villages, 50km from Pune, India | Prospective | 1994-96 | 773 | 633 |
| Pune 2 | King Edward Memorial Hospital, Pune, India | Prospective | 1998 | 362 | 269 |
| Kandy | Kandy Hospital, Kandy, Sri Lanka | Prospective | 1985 | 506 | 455 |
| Beijing | Peking Union Medical College Hospital, Beijing, China | Retrospective | 1948-54 | 2943 | 2433 |
| Kasaji | Kasaji Hospital, DR Congo, rural Central Africa | Prospective | 1995-98 | 347 | 338 |
| Imesi | Imesi village, rural West Nigeria | Prospective | 1957-58 | 301 | 269 |
| Kingston 1 | University Hospital of the West Indies, Kingston, Jamaica | Prospective | 1993-96 | 561 | 490 |
| Kingston 2 | University Hospital of the West Indies, Kingston, Jamaica | Prospective | 1979-81 | 78 | 70 |
|
| |||||
| Total | 22067 | ||||
Liveborn, singleton, term births, with anthropometry measured within seven days of birth
The current analysis was restricted to singleton, full-term (at least 37 weeks) liveborns measured within seven days of birth. Neonates with gestational age greater than 44 weeks were excluded, as there were likely to have been errors in last menstrual period (LMP) dates. Large differences between numbers in the original study and the current analysis (Table I) are generally due to missing values for gestational age.
Measurements
Anthropometry
In prospective studies, anthropometric measurements were generally made by specially trained fieldworkers. Repeated measurements were often taken, and the mean value calculated to increase accuracy. For retrospective studies, measurements were made by midwives who had not received any specific training, and details of equipment and techniques were often unknown. Birthweight and placental weight were measured using digital scales or beam balances. In some studies, placentas were trimmed before weighing, removing the membranes and umbilical cord. In others, usually those based on obstetric records, placentas were weighed untrimmed, so 19% was subtracted from the weight of the placenta for comparability (37).
Crown-heel (CH) and crown-rump (CR) lengths were measured using a neonatal stadiometer, neonatometer or rollametre in prospective studies. In those based on obstetric records, length was likely to have been measured by holding up the neonate and using a tape measure, which may lead to overestimation of values. Leg length was derived by subtracting CR length from CH length.
Head circumference was taken as the maximum occipital-frontal circumference. Chest circumference was measured at the level of the nipple, while abdominal circumference was measured at the level of the xiphisternum. In Pune, because abdominal measurements were taken at the level of the umbilicus, they were adjusted to the xiphisternum using regression, based on a study of 50 neonates with measurements at both levels (29). Mid-upper-arm circumference (MUAC) was measured mid-way between the acromion and olecranon. For all circumferences, plastic, paper or fibreglass tapes were used.
Triceps and subscapular skinfolds were measured using Harpenden or Holtain callipers. There is no universal measurement technique for skinfolds, and there were variations in the side of body used (this also applied to MUAC), the location of measurement point, picking up the skinfold, positioning the callipers and timing of the reading. Arm muscle area (AMA) was calculated from MUAC and tricep measurements (38).
Sex, gestation, parity and maternal age
The effect of the baby's sex, gestational age, mother's parity, and age at delivery on size and shape were also examined. Gestational age at delivery was calculated from the mother's LMP in most cases, although ultrasound scans were used if LMP was not recorded. In two studies, clinical examinations were used to determine gestation; in the Isle of Man Dubowitz scoring (39) was used if there was no other information, and in Kandy, where menstrual histories were unreliable, Narayanan scoring (40) was used. Gestation was not determined in Imesi, although midwives identified pre-terms based on physical appearance, and these were excluded. Parity was recorded in all studies; in the Isle of Man and Aberdeen all mothers studied were primiparous. Maternal age was calculated from maternal and neonatal dates of birth, or taken as the age recorded closest to the delivery.
Statistical analysis
All neonatal anthropometric variables were approximately normally distributed. For all analyses, the values were adjusted to 40-weeks gestation (males and females separately) where possible, using linear regression. Gestation and maternal age had skewed distributions in some studies. Means and SDs are presented for the normally distributed variables, and medians and inter-quartile ranges (IQRs) for skewed variables. Coefficients of variation (CVs) were calculated to quantify the variation in neonatal anthropometric measurements across studies (SD of the study means/overall mean based on all studies).
Neonatal phenotype was characterised using principal components analysis (PCA) to generate new uncorrelated linear combinations (the principal components, PCs). The PCA was based on the correlation matrix, using mean birthweight, CH length and head circumference values from each study. In Aberdeen, length and head were not recorded, so this study was excluded from the PCA. All analyses were undertaken in Stata version 7.0.
Results
There were similar male:female ratios in all studies (Table II). In India and Africa, gestational duration was shorter, the proportion of first borns lower, and mothers younger than the other populations, while the opposite was true in most of the UK studies (Table II).
Table II.
Sex, gestation, parity and maternal age distributions in the 20 studies
| Study | Sex N (%) male |
Gestation Median (IQR) days |
Parity N (%) first born |
Maternal age Median (IQR) years |
|---|---|---|---|---|
| Southampton 1, UK | 296(53.1) | 282(275, 288) | 293(52.6) | 26(23, 30) |
| Southampton 2, UK | 263(50.5) | 282(275, 287) | 249(47.8) | 28(24, 31) |
| Southampton 3, UK | 190(50.4) | 281(275, 286) | 180(47.8) | 27(23, 30) |
| Southampton 4, UK | 46(45.1) | 279(273, 287) | 56(54.9) | 28(24, 32) |
| Preston, UK | 503(49.6) | 282(275, 288) | 824(82.3) | 25(22, 29) |
| Sheffield, UK | 2284(51.7) | 281(275, 288) | 1701(39.1) | 27(23, 32) |
| Farnborough, UK | 879(52.4) | 284(277, 284) | 778(46.7) | 28(25, 30) |
| Isle of Man, UK | 192(49.5) | 284(278, 290) | 338(100.0) | 26(22, 29) |
| Aberdeen, UK | 113(48.5) | 281(274, 287) | 233(100.0) | 23(21, 25) |
| Helsinki, Finland | 3051(50.9) | 279(273, 286) | 2567(42.9) | 27(23, 31) |
| Mysore 1, India | 651(52.6) | 279(272, 283) | 472(38.2) | 23(20, 26) |
| Mysore 2, India | 291(48.7) | 276(270, 281) | 300(50.3) | 24(20, 26) |
| Pune 1, rural India | 340(53.7) | 275(270, 282) | 195(30.8) | 21(19, 23) |
| Pune 2, India | 136(50.6) | 276(270, 283) | 48(18.1) | 25(22, 28) |
| Kandy, Sri Lanka | 232(51.0) | 284(284, 286) | 218(47.9) | 27(23, 31) |
| Beijing, China | 1180(48.5) | 281(274, 287) | 1165(47.9) | 27(24, 32) |
| Kasaji, rural DR Congo | 177(52.4) | 277(271, 283) | 95(28.1) | 23(19, 29) |
| Imesi rural Nigeria | 120(44.6) | 9(3.8) | 25(20, 30) | |
| Kingston 1, Jamaica | 218(44.5) | 278(271, 284) | 239(48.9) | 26(23, 30) |
| Kingston 2, Jamaica | 36(51.4) | 279(271, 284) | 39(55.7) | 26(20, 31) |
Size of neonates
European neonates were generally the largest in all dimensions, followed by Jamaican, Chinese then African and South Asian neonates (Table III). The lowest birthweights (Figure 1a), placental weights and abdominal circumferences were seen in Pune 1, the rural Indian population. African neonates were the shortest, and those in Kasaji had the smallest chest, muscle (MUAC and AMA) and fat (skinfold) measurements. There was wide variation in many of the measurements across the studies, as demonstrated by the CVs (Table III). The skeletal measurements varied least, head circumference in particular (Figure 1b) with the exception of China, where this measurement was markedly lower. Other characteristics seen in specific populations included relative adiposity in the Indian neonates; they were smaller in all dimensions than European neonates, but their subscapular skinfolds were similar. Also, the Chinese neonates had short legs but long bodies, while those from Mysore 2 had short bodies but long legs.
Table III.
Mean (SD) neonatal anthropometric measurements in each of the 20 studies
| Study | Birthweight g |
Placental weight g |
CH length cm |
CR length cm |
Leg length cm |
Head cm |
Chest cm |
Abdomen cm |
MUAC cm |
AMA cm2 |
Triceps mm |
Subscapular mm |
|---|---|---|---|---|---|---|---|---|---|---|---|---|
| Southampton 1, UK |
3413(444) | 532(120) | 50.1(1.8) | 33.3(1.4) | 16.8(0.9) | 35.1(1.2) | 33.6(1.6) | 11.6(0.9) | ||||
| Southampton 2, UK |
3423(420) | 563(127) | 49.8(1.8) | 33.2(1.3) | 16.6(0.8) | 34.9(1.2) | 33.4(1.5) | 11.6(0.8) | ||||
| Southampton 3, UK |
3472(452) | 518(108) | 49.7(1.8) | 35.2(1.2) | 33.5(1.7) | 11.5(0.9) | 4.8(1.1) | |||||
| Southampton 4, UK |
3568(434) | 529(107) | 50.5(2.0) | 34.0(1.4) | 16.5(1.5) | 35.3(1.2) | 34.4(1.7) | 11.5(0.9) | ||||
| Preston, UK | 3179(434) | 486(109) | 51.6(2.4) | 34.7(1.7) | ||||||||
| Sheffield, UK | 3294(465) | 502(108) | 51.2(2.7) | 34.7(1.7) | 33.0(1.9) | |||||||
| Farnborough, UK |
3322(430) | 506(104) | 50.7(2.6) | 34.6(1.4) | ||||||||
| Isle of Man, UK | 3372(447) | 493(101) | 50.1(1.8) | 34.7(1.2) | 32.5(1.6) | |||||||
| Aberdeen, UK | 3224(416) | 529(101) | ||||||||||
| Helsinki, Finland | 3436(458) | 515(100) | 50.2(1.7) | 34.7(1.3) | ||||||||
| Mysore 1, India | 2877(426) | 359(68) | 48.5(3.0) | 34.1(1.7) | ||||||||
| Mysore 2, India |
2958(413) | 419(86) | 49.1(2.1) | 32.2(1.7) | 16.9(1.4) | 34.1(1.3) | 32.2(1.7) | 10.4(0.9) | 22.7(1.9) | 4.3(0.9) | 4.5(0.9) | |
| Pune 1, rural India | 2731(334) | 364(76) | 48.2(1.8) | 33.3(1.1) | 31.5(1.6) | 29.8(1.8) | 9.8(0.8) | 21.2(1.9) | 4.3(0.8) | 4.2(0.8) | ||
| Pune 2, India | 2840(392) | 419(96) | 47.8(2.1) | 33.3(1.3) | 31.8(1.9) | 29.8(2.4) | 9.8(0.8) | 21.2(1.8) | 4.3(0.8) | 4.2(0.7) | ||
| Kandy, Sri Lanka |
2761(459) | 48.2(2.3) | 33.6(1.2) | |||||||||
| Beijing, China | 3156(394) | 431(76) | 49.5(1.9) | 33.6(1.6) | 15.9(1.4) | 32.0(1.5) | ||||||
| Kasaji, rural DR Congo | 2842(394) | 382(77) | 47.8(1.9) | 34.1(1.2) | 29.7(1.8) | 9.6(0.8) | 21.0(1.6) | 3.8(0.8) | 3.8(0.9) | |||
| Imesi rural Nigeria |
2904(397) | 468(98) | 47.8(2.3) | 34.0(1.5) | 33.1(1.9) | |||||||
| Kingston 1, Jamaica |
3221(438) | 475(102) | 49.9(2.6) | 33.2(2.0) | 16.6(1.6) | 34.6(1.4) | 32.7(1.8) | 32.7(1.7) | 10.5(0.9) | |||
| Kingston 2, Jamaica |
3159(526) | 470(96) | 49.7(3.9) | 33.0(3.0) | 16.7(2.8) | 34.4(2.0) | ||||||
|
| ||||||||||||
| Coefficient of variation | 8.1% | 12.6% | 2.3% | 1.7% | 2.1% | 2.3% 1.7%a |
4.2% | 4.7% | 7.9% | 3.8% | 6.0% | 8.7% |
Excluding China
Figure 1a.
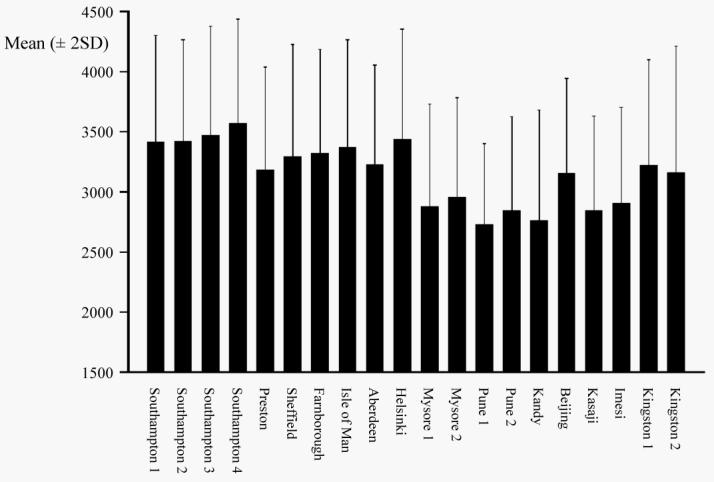
Mean (± 2SD) birthweight (g) by study
Figure 1b.

Mean (± 2SD) head circumference (cm) by study
Shape of neonates
From the PCA (Table IV), the coefficients of the first PC were all positive and of a similar size, reflecting the overall size of the neonate. In the second PC, the coefficients for length and head circumference were of a similar size but the former had a negative sign, while the coefficient for birthweight was relatively small. This suggested that the main difference between populations was the contrast between length and head size. Relative to length, neonates had larger heads in India, Sri Lanka and Africa, and to a lesser extent, Europe. Neonates in China had small heads in relation to length.
Table IV.
Three principal component analyses based on mean values from each study
| Measurement | PCA1a | PCA2b | PCA3c | |||
|---|---|---|---|---|---|---|
| PC1 | PC2 | PC1 | PC2 | PC1 | PC2 | |
| Birthweight | 0.61 | −0.17 | 0.54 | −0.17 | 0.51 | −0.05 |
| CH length | 0.58 | −0.57 | 0.48 | −0.56 | 0.42 | −0.43 |
| Head | 0.54 | 0.80 | 0.45 | 0.81 | 0.44 | −0.39 |
| Placenta | 0.52 | −0.02 | ||||
| Subscapular | 0.38 | 0.80 | ||||
| MUAC | 0.48 | 0.15 | ||||
| Proportion of variance (%) | 79 | 15 | 78 | 12 | 69 | 13 |
All neonatal measurements were standardized before PCA was performed.
Figures in bold show largest coefficients
All studies except Aberdeen
All studies except Kandy
Southampton 3, Mysore 2, Pune 1, Pune 2, Kasaji
Placental weight was available in all studies except Kandy, and when this measure was added to the analysis with birthweight, CH length and head, the first PC was a weighted average of all the variables, and the second was still a contrast between head and length, as the coefficient for placental weight was relatively small (Table IV). Therefore, knowledge of the placental weight did not aid distinction between neonatal size and shape in different populations to a great extent. When MUAC and subscapular skinfold were added to birthweight, CH length and head, this PCA yielded a second component that was a contrast between skeleton and fat (Table IV). However, these results must be interpreted with caution as they were based only on one Southampton, three Indian and one African study.
In all studies, females were smaller than males, first borns were smaller than subsequent births, and neonatal size increased as mothers became older. Despite these differences in overall size across the sex, parity and maternal age subgroups, within each study, neonates were a similar shape in each subgroup; e.g. females were smaller than males in China, but both had small heads in relation to length (data not shown).
Discussion
Apart from birthweight, geographical variation in neonatal size and body proportions has not been well documented. This analysis compared the size and shape of neonates across a number of geographical populations, and to our knowledge, no similar work has been presented before. The main differences between populations were overall size, head size (reduced in China compared to other populations), body fat (increased relative to other body measurements in India compared to other populations), components of length (short legs and long bodies in Beijing, China compared to long legs and short bodies in Mysore, India), and head to length ratio. As expected, within geographical regions, neonatal phenotypes were similar.
Although there was generally least variation in the skeletal measurements between populations, the neonates in Beijing had markedly reduced head size. This might have been due to measurement error as data were taken from obstetric records. However, in a WHO study based on seven populations, all of which used the same protocol, head size in China was smaller than in the other populations that included India and Africa (data not shown) (41). In addition, Meredith (42) has shown neonatal head size in China to be among the smallest when compared to a number of other populations.
In the Indian neonates, who were among the smallest overall, fat was less reduced than other body measurements. This finding was based on three high quality studies from Mysore and Pune, so seems to be a consistent phenomenon. Yajnik (43) proposed that this reflects a ‘thrifty phenotype’, whereby in utero Indian neonates have preserved fat at the expense of muscle. The subscapular skinfold, i.e. central fat was preserved more than the triceps skinfold, and this may be a feature of fetal growth restriction. Hediger et al. (44) and Yajnik et al. (29) also demonstrated relative fat preservation in small for gestational age neonates in the USA and UK respectively.
There was a strong contrast between the length components of trunk and leg in Beijing and Mysore 2. The Chinese neonates had short legs and long bodies, while the Indian neonates had long legs and short bodies. There may have been measurement error in the Beijing data, as these were based on obstetric records, but the Mysore data were based on measurements made by trained observers. However, as no other studies from China or India have included measurement of the length components, it is not yet possible to confirm that these patterns are characteristic of these populations.
The main difference in neonatal shape between populations when considering only birthweight, length and head circumference was in the head to length ratio. Neonates in India, Sri Lanka and Africa had large heads compared to their length while those in China had relatively small heads. It might be argued that subjects may not have been representative of the population from which they were sampled. However, Pune 1 and Imesi, Nigeria were based on population samples. The other studies were of women giving birth in hospitals, and in countries where there are many hospitals available such as India, the choice of hospital may reflect a particular socio-economic group. In some areas, hospital maternity attenders may represent a ‘high risk’ subgroup, but in other areas such as Sri Lanka, hospital delivery is the norm for 80% of births. Also, in Kasaji, DR Congo for example, there was active community recruitment of everyone antenatally, and then personal encouragement to attend for delivery to help complete the study. In some of the Southampton and Jamaican studies, women were only included if they had booked early and/or known their menstrual dates. They may have been more motivated than the general population, or had a history of previous pregnancy or delivery complications. Not all studies used the same method of recording gestational duration, and although most used LMP, there are likely to have been differences in the women's abilities to report accurate dates across the studies. The year of birth ranged from 1907 to 1998 across the studies, and secular trends in height, and to a lesser extent weight have been demonstrated over the last century (12). Although these are stronger in adults, they have also been observed at birth, which may affect the validity of comparisons made between studies undertaken many years apart. However within studies, even those spanning wide time periods, the effect of year of birth was minimal (−0.1g (Aberdeen) to 10g (Preston) per year for birthweight, considering studies spanning at least five years). In addition, this possible difficulty is countered by the geographic regions showing some striking similarities between studies undertaken years apart, and at the same time marked differences from other geographical regions. These also counter the known difficulties with comparing anthropometric measurements across studies due to use of different equipment and techniques, and in the degree of accuracy in recording. Further confidence in the findings can be drawn from the similar patterns seen across the sex, parity and maternal age groups.
The reasons for geographical variation in neonatal phenotype are likely to be multiple, including effects of both inherited genes (i.e. genes selected for by environmental conditions in the past) and the current environment (the mother) on fetal gene expression. Genes likely to influence neonatal size and shape are those controlling fetal growth hormones (insulin and the insulin-like growth factors IGF-I and IGF-II). Environmental factors associated with fetal growth include any that influence the supply of nutrients to the fetus. The materno-fetal supply line is complex, including the mother's dietary intake, metabolism, endocrine status, body composition, haemodynamic and vascular function, and the micro-structure and function of the placenta (45). The mother's age and aspects of her lifestyle (smoking, alcohol intake, and psycho-social stress) can influence the supply line. Nutrient concentrations in the fetal circulation determine the secretion of insulin, IGF's and other growth factors. In experimental animals, different nutrients have varying effects on the individual fetal growth factors (46, 47), and these in turn promote the growth of different body tissues (48). Thus geographical differences in the maternal diet could theoretically translate into differences in body composition, although currently there are few data from humans, and these processes remain poorly understood. An additional environmental phenomenon influencing fetal growth is ‘maternal constraint’, whereby a small mother limits the size of her fetus (49). The mechanisms by which this occurs are unknown. Maternal size is a reflection of both her genotype and nutritional status during childhood and adolescence. Data on maternal size and body composition are available for many of the populations included in this analysis, and their effects on neonatal phenotype is the subject of the accompanying paper.
Different body proportions at birth in small babies may reflect the timing of environmental effects on fetal growth during gestation when growth became restricted. Different body tissues have their maximum growth rates at different gestational ages; head (and brain) growth is most rapid in early gestation, length growth in mid-gestation, and soft tissues (fat, muscle, abdominal viscera) in the last trimester. Chinese babies may grow slowly from early gestation (reflected in small head size) while Indian babies may grow rapidly in early gestation but be unable to sustain rapid growth in late gestation (reflected in larger head size but small abdominal circumference).
The relative fat preservation in Indian neonates may be an adaptation with some survival advantage (resistance to cold, substrate for brain growth and immunological responses (50), increasing the baby's ‘visual appeal’ encouraging adults to invest in its survival (51)). Alternatively, this phenotype may reflect inadequate nutrient supply, leading to deposition of fat rather than lean tissue (52).
In addition to our lack of knowledge about the causes of variability in neonatal size and shape, the ‘optimal’ neonatal phenotype for both short- and long-term outcomes, and how this varies between populations is not yet known. For example, it is likely that the optimal birthweight in terms of infant mortality in European countries is higher than in developing countries (53). Therefore, further studies investigating these issues are required to enable recommendations to be made to improve fetal growth in different populations. This is particularly important for developing appropriate interventions to achieve by 2015 the millennium development goal of reducing child mortality (of which neonates are a significant component) (54).
Acknowledgements
We would like to thank Professor David Barker, former Director of the Medical Research Council Environmental Epidemiology Unit in Southampton for facilitating the development of this work. We are extremely grateful to the following who were involved in collecting data for the studies (in alphabetical order by site of study): Dr Tom Forsén (Helsinki data), Dr Anne Lee (Isle of Man data), Dr Minerva Thame, Professor Rainford Wilks, Dr Franklyn Bennett, Dr Jo Hall, Dr Michael Boyne, Dr Jackie Landman (Jamaican data), Dr B.D.R. Paul, Dr Lovesome David, Dr Claudia Stein, Dr S.R. Veena (Mysore data), Professor David Morley (Nigerian data), Professor David Phillips (Preston data), Dr V.N. Rao, Professor Kurus Coyaji, (Pune data), Dr Christopher Martyn (Sheffield data) and Mr Tim Wheeler (Southampton data).
The prospective studies were funded by the British Commonwealth Nurses War Memorial Fund (Kasaji), British Heart Foundation (Farnborough), Commonwealth Foundation (Kandy), Dunhill Medical Trust UK (Southampton 1), Medical Research Council UK (Farnborough, Pune 1, Southampton 1, Southampton 2), Parthenon Trust Switzerland (Mysore 2), Postgraduate Medical Centre Nobles Hospital (Isle of Man), UK Department for International Development DfID (Imesi, Kandy), UNICEF (Kandy), University of Manchester UK (Kasaji), WellBeing UK (Southampton 2), Wellcome Trust UK (Kingston 1, Pune 1, Pune 2) and West African Council for Medical Research (Imesi). In India, we would like to acknowledge the support of Sneha-India.
Abbreviations
- AMA
Arm muscle area
- CH length
Crown-heel length
- CR length
Crown-rump length
- CV
Coefficient of variation
- IQR
Inter-quartile range
- LMP
Last menstrual period
- MUAC
Mid-upper-arm circumference
- PC
Principal component
- PCA
Principal components analysis
- SD
Standard deviation
References
- 1.Barker DJP. Mothers, babies and health in later life. Churchill Livingstone; Edinburgh: 1998. [Google Scholar]
- 2.Phipps K, Barker DJ, Hales CN, Fall CH, Osmond C, Clark PM. Fetal growth and impaired glucose tolerance in men and women. Diabetologia. 1993;36:225–8. doi: 10.1007/BF00399954. [DOI] [PubMed] [Google Scholar]
- 3.Forsén T, Eriksson J, Tuomilehto J, Reunanen A, Osmond C, Barker D. The fetal and childhood growth of persons who develop type 2 diabetes. Ann Intern Med. 2000;133:176–82. doi: 10.7326/0003-4819-133-3-200008010-00008. [DOI] [PubMed] [Google Scholar]
- 4.Fall CH, Stein CE, Kumaran K, Cox V, Osmond C, Barker DJ, Hales CN. Size at birth, maternal weight, and type 2 diabetes in South India. Diabet Med. 1998;15:220–7. doi: 10.1002/(SICI)1096-9136(199803)15:3<220::AID-DIA544>3.0.CO;2-O. [DOI] [PubMed] [Google Scholar]
- 5.Gairdner D, Pearson J. A growth chart for premature and other infants. Arch Dis Child. 1971;46:783–7. doi: 10.1136/adc.46.250.783. [DOI] [PMC free article] [PubMed] [Google Scholar]
- 6.Blidner IN, McClemont S, Anderson GD, Sinclair JC. Size-at-birth standards for an urban Canadian population. Can Med Assoc J. 1984;130:133–40. [PMC free article] [PubMed] [Google Scholar]
- 7.Mohan M, Prasad SR, Chellani HK, Kapani V. Intrauterine growth curves in North Indian babies: weight, length, head circumference and ponderal index. Indian Pediatr. 1990;27:43–51. [PubMed] [Google Scholar]
- 8.Fok TF, So HK, Wong E, Ng PC, Chang A, Lau J, et al. Updated gestational age specific birth weight, crown-heel length, and head circumference of Chinese newborns. Arch Dis Child Fetal Neonatal Ed. 2003;88:F229–36. doi: 10.1136/fn.88.3.F229. [DOI] [PMC free article] [PubMed] [Google Scholar]
- 9.Nishida H, Sakamoto S, Sakaneoue M. New fetal growth curves for Japanese. Acta Paediatr Scand Suppl. 1985;319:62–7. doi: 10.1111/j.1651-2227.1985.tb10111.x. [DOI] [PubMed] [Google Scholar]
- 10.Feleke Y, Enquoselassie F. Maternal age, parity and gestational age on the size of the newborn in Addis Ababa. East Afr Med J. 1999;76:468–71. [PubMed] [Google Scholar]
- 11.Bhat GJ, Mukelabai K, Shastri GN, Tamina C. Anthropometric parameters of Zambian infants at birth. J Trop Pediatr. 1989;35:100–104. doi: 10.1093/tropej/35.3.100-a. [DOI] [PubMed] [Google Scholar]
- 12.Cole TJ. Secular trends in growth. Proc Nutr Soc. 2000;59:317–24. doi: 10.1017/s0029665100000355. [DOI] [PubMed] [Google Scholar]
- 13.Gerver WJM, de Bruin R. Paediatric Morphometrics, a reference manual. Wetenschappelijke uitgevrij Bunge; Utrecht: 1996. [Google Scholar]
- 14.Denham M, Schell LM, Gallo M, Stark A. Neonatal size of low socio-economic status Black and White term births in Albany Country, NYS. Ann Hum Biol. 2001;28:172–83. doi: 10.1080/03014460151056374. [DOI] [PubMed] [Google Scholar]
- 15.Hindmarsh PC, Geary MP, Rodeck CH, Kingdon JC, Cole TJ. Intrauterine growth and its relationship to size and shape at birth. Pediatr Res. 2002;52:263–8. doi: 10.1203/00006450-200208000-00020. [DOI] [PubMed] [Google Scholar]
- 16.Godfrey KM, Hales CN, Osmond C, Barker DJ, Taylor KP. Relation of cord plasma concentrations of proinsulin, 32-33 split proinsulin, insulin and C-peptide to placental weight, body size and body proportions at birth. Early Hum Dev. 1996;46:129–40. doi: 10.1016/0378-3782(96)01752-5. [DOI] [PubMed] [Google Scholar]
- 17.Godfrey KM, Matthews N, Glazier J, Jackson A, Wilman C, Sibley CP. Neutral amino acid uptake by the microvillous plasma membrane of the human placenta is inversely related to fetal size at birth in normal pregnancy. J Clin Endocrinol Metab. 1998;83:3320–6. doi: 10.1210/jcem.83.9.5132. [DOI] [PubMed] [Google Scholar]
- 18.Dewar A, Clarke S, Diamond I, Wheeler T. The ponderal index of the newborn infant. In: Gati I, editor. Recent Progress in Perinatal Medicine. Postgraduate Medical School; Budapest: 1987. pp. 89–93. [Google Scholar]
- 19.Wheeler T, Godfrey K, Atkinson C, Badger J, Kay R, Owens R, Osmond C. Disproportionate fetal growth and fingerprint patterns. Br J Obstet Gynaecol. 1998;105:562–4. doi: 10.1111/j.1471-0528.1998.tb10159.x. [DOI] [PubMed] [Google Scholar]
- 20.Barker DJP, Bull AR, Osmond C, Simmonds S. Fetal and placental size and risk of hypertension in adult life. BMJ. 1990;301:259–62. doi: 10.1136/bmj.301.6746.259. [DOI] [PMC free article] [PubMed] [Google Scholar]
- 21.Barker DJP, Osmond C, Simmonds SJ, Wield GA. The relation of small head circumference and thinness at birth to death from cardiovascular disease in adult life. BMJ. 1993;306:422–6. doi: 10.1136/bmj.306.6875.422. [DOI] [PMC free article] [PubMed] [Google Scholar]
- 22.de Swiet M, Fayers P, Shinbourne EA. Value of repeated blood pressure measurements in children – the Brompton study. Br Med J. 1980;280:1567–9. doi: 10.1136/bmj.280.6231.1567. [DOI] [PMC free article] [PubMed] [Google Scholar]
- 23.Lee AM. Size at birth and neonatal fibrinogen. University of Southampton; 2000. PhD thesis. [Google Scholar]
- 24.Campbell DM, Hall MH, Barker DJP, Cross J, Shiell AW, Godfrey KM. Diet in pregnancy and the offspring's blood pressure 40 years later. Brit J Obstet Gynaecol. 1996;103:273–80. doi: 10.1111/j.1471-0528.1996.tb09718.x. [DOI] [PubMed] [Google Scholar]
- 25.Forsén T, Eriksson JG, Tuomilehto J, Teramo K, Osmond C, Barker DJP. Mother's weight in pregnancy and coronary heart disease in a cohort of Finnish men: follow up study. BMJ. 1997;315:837–40. doi: 10.1136/bmj.315.7112.837. [DOI] [PMC free article] [PubMed] [Google Scholar]
- 26.Stein CE, Fall CHD, Kumaran K, Osmond C, Cox V, Barker DJP. Fetal growth and coronary heart disease in South India. Lancet. 1996;348:1269–73. doi: 10.1016/s0140-6736(96)04547-3. [DOI] [PubMed] [Google Scholar]
- 27.Hill JC, Krishnaveni GV, Annamma I, Leary SD, Fall CHD. Glucose tolerance in pregnancy in South India: relationships to neonatal anthropometry. Acta Obstet Gynecol Scand. 2005;84(2):159–65. doi: 10.1111/j.0001-6349.2005.00670.x. [DOI] [PubMed] [Google Scholar]
- 28.Yajnik CS, Lubree G, Rege SS, Naik SS, Deshpande JA, Despande SS, et al. Adiposity and hyperinsulinemia in Indians are present at birth. J Clin Endocrinol Metab. 2002;87:5575–80. doi: 10.1210/jc.2002-020434. [DOI] [PubMed] [Google Scholar]
- 29.Yajnik CS, Fall CHD, Coyaji KJ, Hirve SS, Rao S, Barker DJP, et al. Neonatal anthropometry: the thin-fat Indian baby. The Pune Maternal Nutrition Study. Int J Ob. 2003;27:173–80. doi: 10.1038/sj.ijo.802219. [DOI] [PubMed] [Google Scholar]
- 30.Lovel HJ. Maternal nutrition status and pregnancy outcomes in Sinhala Sri Lanka with an analysis of customs and practices in pregnancy and the puerperium associated with nutrition. University of London; 1996. PhD thesis. [Google Scholar]
- 31.Mi J, Law C, Zhang K, Osmond C, Stein C, Barker D. Effects of infant birthweight and maternal body mass index in pregnancy on components of the insulin resistance syndrome in China. Ann Intern Med. 2000;132:253–60. doi: 10.7326/0003-4819-132-4-200002150-00002. [DOI] [PubMed] [Google Scholar]
- 32.Newby RM. Symphysis-fundal height and the influence of placental malaria and poverty on pregnancy outcomes in rural Democratic Republic of Congo. University of Manchester; 2000. PhD thesis. [Google Scholar]
- 33.Morley D, Woodland M, Cuthbertson WFJ. Controlled trial of Pyrimethaminc in pregnant women in an African village. Br Med J. 1964;1:667–8. doi: 10.1136/bmj.1.5384.667. [DOI] [PMC free article] [PubMed] [Google Scholar]
- 34.Morley DC, Woodland M, Martin WJ, Allen I. Heights and weights of West African village children from birth to age of five. West Afr Med J. 1968;17:8–13. [PubMed] [Google Scholar]
- 35.Thame M, Osmond C, Wilks RJ, Bennett FI, McFarlane-Anderson N, Forrester TE. Blood pressure is related to placental volume and birth weight. Hypertension. 2000;35:662–7. doi: 10.1161/01.hyp.35.2.662. [DOI] [PubMed] [Google Scholar]
- 36.Landman J, Hall JSE. The dietary habits and knowledge of folklore of pregnant and Jamaican women. Ecol Food Nutr. 1983;12:203–10. [Google Scholar]
- 37.Leary SD, Godfrey KM, Greenaway LJ, Davill VA, Fall CH. Contribution of the umbilical cord and membranes to untrimmed placental weight. Placenta. 2003;24:276–8. doi: 10.1053/plac.2002.0888. [DOI] [PubMed] [Google Scholar]
- 38.Jelliffe DB, Jelliffe EPP. Prevalence of protein-calorie malnutrition in Haitian preschool children. Am J Public Health. 1960;50:1355–66. doi: 10.2105/ajph.50.9.1355. [DOI] [PMC free article] [PubMed] [Google Scholar]
- 39.Dubowitz LMS, Dubowitz V, Goldberg C. Clinical assessment of gestational age in the newborn infant. J Pediatr. 1970;77:1–10. doi: 10.1016/s0022-3476(70)80038-5. [DOI] [PubMed] [Google Scholar]
- 40.Narayanan I, Dua K, Gujral VV, Mehta DK, Mathew M, Prabhakar AK. A simple method of assessment of gestational age in newborn infants. Pediatrics. 1982;69:27–32. [PubMed] [Google Scholar]
- 41.Law CM, Egger P, Dada O, Delgado H, Kylberg E, Lavin P, et al. Body size at birth and blood pressure among children in developing countries. Int J Epidemiol. 2000;29:52–9. doi: 10.1093/ije/30.1.52. [DOI] [PubMed] [Google Scholar]
- 42.Meredith HV. Human head circumference from birth to early adulthood: racial, regional and sex comparisons. Growth. 1971;35:233–51. [PubMed] [Google Scholar]
- 43.Yajnik CS. Fetal origins of adult disease: where do we stand? International Journal of Diabetes in Developing Countries. 2001;21:42–56. [Google Scholar]
- 44.Hediger ML, Overpeck MD, Kuczmarski RJ, McGkynn A, Davis WW. Muscularity and fatness of infants and young children born small- or large-for-gestational-age. Pediatrics. 1998;102:E60. doi: 10.1542/peds.102.5.e60. [DOI] [PubMed] [Google Scholar]
- 45.Harding J. The nutritional basis of the fetal origins of adult disease. Int J Epidemiol. 2001;30:15–25. doi: 10.1093/ije/30.1.15. [DOI] [PubMed] [Google Scholar]
- 46.Oliver MH, Harding JE, Breier BH, Evans PC, Gluckman PD. Glucose but not a mixed amino acid infusion regulates plasma insulin-like growth factor-I concentrations in fetal sheep. Pediatr Res. 1993;34:62–5. doi: 10.1203/00006450-199307000-00015. [DOI] [PubMed] [Google Scholar]
- 47.Oliver MH, Harding JE, Breier BH, Gluckman PD. Fetal insulin-like growth factor (IGF)-I and IGF-II are regulated differently by glucose or insulin in the sheep fetus. Reprod Fertil Dev. 1996;8:167–72. doi: 10.1071/rd9960167. [DOI] [PubMed] [Google Scholar]
- 48.Lok F, Owens JA, Mundy L, Robinson JS, Owens PC. Insulin-like growth factor I promotes growth selectively in fetal sheep in late gestation. Am J Physiol. 1996;270:R1148–55. doi: 10.1152/ajpregu.1996.270.5.R1148. [DOI] [PubMed] [Google Scholar]
- 49.Walton A, Hammond J. The maternal effects on growth and confirmation in Shire horse-Shetland pony crosses. Proc Roy Soc (Biol) 1938;125:311–35. [Google Scholar]
- 50.Pond CM. Adipose tissue differentiation and development. Biochem Soc Trans. 1996;24:393–400. doi: 10.1042/bst0240393. [DOI] [PubMed] [Google Scholar]
- 51.Blaffer Hrdy S. Mother Nature: Maternal instincts and the shaping of the species. Vintage; London: 2001. A matter of fat; pp. 475–84. [Google Scholar]
- 52.Jackson AA, Wootton SA. The energy requirements of growth and catch-up growth. In: Schurch B, Scrimshaw NS, International Dietary Energy Consultancy Group (IDECG), editors. Activity, energy expenditure and energy requirements of infants and children. 1990. [Google Scholar]
- 53.Evans S, Alberman E, Pashley J, Hampton B. International Collaborative Effort (ICE) on birthweight; plurality; and perinatal and infant mortality. II: Comparisons between birthweight distributions of births in member countries from 1970 to 1984. Acta Obstet Gynecol Scand. 1989;68(1):11–7. doi: 10.3109/00016348909087682. [DOI] [PubMed] [Google Scholar]
- 54. http://www.un.org/millenniumgoals.