

Abstract
DFsc is a single chain de novo designed 4-helix bundle peptide that mimics the core protein fold and primary ligand set of various binuclear non-heme iron enzymes. DFsc and the E11D, Y51L and Y18F single amino acid variants have been studied using a combination of near-IR circular dichroism (CD), magnetic circular dichroism (MCD), variable temperature variable field MCD (VTVH MCD) and x-ray absorption (XAS) spectroscopies. The biferrous sites are all weakly antiferromagnetically coupled with μ-1,3 carboxylate bridges and one 4-coordinate and one 5-coordinate Fe, very similar to the active site of Class I ribonucleotide reductase (R2) providing open coordination positions on both irons for dioxygen to bridge. From perturbations of the MCD and VTVH MCD the iron proximal to Y51 can be assigned as the 4-coordinate center and XAS results show that Y51 is not bound to this iron in the reduced state. The two open coordination positions on one iron in the biferrous state would become occupied by dioxygen and Y51 along the O2 reaction coordinate. Subsequent binding of Y51 functions as an internal spectral probe of the O2 reaction and as a proton source that would promote loss of H2O2. Coordination by a ligand that functions as a proton source could be a structural mechanism used by natural binuclear iron enzymes to drive their reactions past peroxo biferric level intermediates.
Carboxylate bridged binuclear non-heme iron enzymes constitute an expanding class of proteins that perform diverse biological functions involving O2 binding and activation (1, 2). Members of this family include: ribonucleotide reductase (R2 for the diiron containing component) which catalyzes the one e- oxidation of an endogenous tyrosine residue (3); stearoyl-acyl carrier protein Δ9-desaturase (Δ9D) which desaturates fatty acids (4); methane monooxygenase (MMOH)(5) and the growing subclass of bacterial multicomponent monooxygenases (including toluene monooxygenases, phenol hydroxylase, alkene monooxygenase, as well as others) that hydroxylate various organic substrates; the ferritins, which use iron as a substrate for ferroxidation and iron storage; ruberythrin, which performs peroxidations involving NADH; myo-inositol oxygenase (MIOX), which catalyzes the ring-cleaving 4e- oxidation of its substrate; as well as others. In the majority of these enzymes the diiron sites are housed in four α-helix bundles with a mostly conserved (4 Glu/2 His) protein derived ligand set. Some minor variations exist, for instance, R2 has a terminal Asp in place of a Glu at position 84 (using the E. coli numbering); more diversity is observed in the ligand sets of some ferritins; and in MIOX a fifth helix participates in core housing. The best studied members to date are R2, Δ9D and MMOH (1). In these proteins, each iron is bound by one terminal carboxylate, one His and bridged by two Glu residues; the bridging Glu and His residues are found in conserved ExxH motifs often used to identify the class. The biferrous site in R2 is described as four and five coordinate (4C+5C) weakly antiferromagnetically coupled by two μ–1,3 bridging carboxylates with D84 bound in a monodentate fashion to the 4C center (6). The biferrous site in Δ9D is 5C+5C and also weakly antiferromagnetically coupled by two μ–1,3 bridging carboxylates (7). Crystallography coupled with spectroscopy define the reduced site in MMOH as 5C+5C, but with one μ–1,1 and one μ–1,3 carboxylate bridge that results in weak ferromagnetic coupling of the irons (7-9). Additionally, a single H2O molecule is bound to one FeII in MMOH (10, 11). Of these biferrous cofactor sites in the carboxylate-bridged O2-activating binuclear non-heme iron enzymes only the 4C+5C site in R2 is poised to react rapidly with dioxygen. Both Δ9D and MMOH require additional factors for rapid reaction with O2 (12). Addition of substrate-bound acyl carrier protein to Δ9D promotes conversion to a 4C+5C reactive site and addition of component B to MMOH forms a new 5C+5C site that rapidly reacts with O2 (7).
Parallels among the oxygen reactions of these and other binuclear non-heme iron enzymes are often made, in particular involving spectroscopically, therefore, structurally similar peroxo-biferric intermediates (1, 4, 13-18). However due to different late intermediates (i.e. the FeIII–μ-O/μ-OH–FeIV intermediate X (19, 20) in R2 and the proposed FeIV–bis μ-O–FeIV intermediate Q (21, 22) of MMOH) and final reaction outcomes, their mechanisms diverge. This is generally believed to occur subsequent to the peroxo species, however specific factors which stabilize peroxo level intermediates and channel them toward different reaction pathways remain largely unknown. Considerable insight has come from top-down approaches involving site-directed mutagenesis on the native enzymes. Characterization of numerous mechanistically important R2 variants, notably some involving the D84E amino acid substitution which stabilizes the peroxo adduct, have allowed detailed mechanistic dissection of the R2 reaction coordinate which is perhaps the most well defined experimentally of the binuclear non-heme enzymes (16, 17, 20, 23-28). Alternatively, for MMOH a genetic system is not yet available and research has focused on computational and biomimetic model complexes for mechanistic insight (21, 29-33).
High valent analogs of Q and X have been generated (34), notably an FeIV(O)2FeIV model for intermediate Q that is competent in H-atom abstraction from 9,10 dihydroanthracene (33, 34). A number of ligand systems have been shown to support peroxo level species (34), and a recent achievement is the synthesis of a peroxo-diiron complex in which reactivity can be tuned to either reversible dioxygen binding or arene hydroxylation by the bridging carboxylates (35). Additionally, inorganic model complexes have been indispensable in development of methodologies required for the study of binuclear non-heme enzymes (34, 36, 37). The inorganic analog approach, however, is somewhat limited as the model systems often have only loosely related ligand sets, lack hydrophobic active site environments or second shell interactions provided by the protein, undergo dimerization or disproportination side reactions and typically do not offer systematic variability (34).
Developments in de novo design have created a bridge between small inorganic models and native proteins which incorporates most of the benefits of both experimental approaches (38-43). The DF (due ferro) family of rationally designed peptides isolate the diiron site in 4-helix bundles and are minimal mimics of the natural binuclear enzymes. The diiron site is coordinated by two tandem helical Glu-Xxx-Xxx-His motifs and two additional terminal Glu residues. These peptides replicate the coordinating residues of the native enzymes and provide a scaffold for systematic variation of amino acids (44). The DFsc peptides are easily generated and available in pure, homogenous, and highly concentrated samples making them amenable to detailed spectroscopic investigations. Furthermore, they bind divalent transition metals and react with dioxygen when reconstituted with FeII reminiscent of the O2 reactivity of the binuclear non-heme iron enzymes (45-47). These designed peptides allow a ground-up molecular biology/spectroscopy approach to define the factors that tune diiron sites for differential oxygen reactivity not directly available in either the proteins or the inorganic models.
Since the initial design of DF1 (39, 40, 48), various generational improvements on the scaffold have been made including increasing solubility and access to the active site (43). The current generation of single chain DF peptides (DFsc) react rapidly with dioxygen when reconstituted with FeII to form spectroscopically observable species (49). Figure 1 shows the overall fold and active site (along with residues pertinent to this study) determined from the diZnII NMR structure of DFsc (47). DFsc and the conservative coordinating residue variant DFscE11D react with dioxygen to from a species with a maximum absorption at 520 nm that has been shown by resonance Raman spectroscopy to derive from coordination of a single tyrosine to FeIII and VT MCD shows this site is a weakly antiferromagnetically coupled S = 0 biferric site (49).
Figure 1.
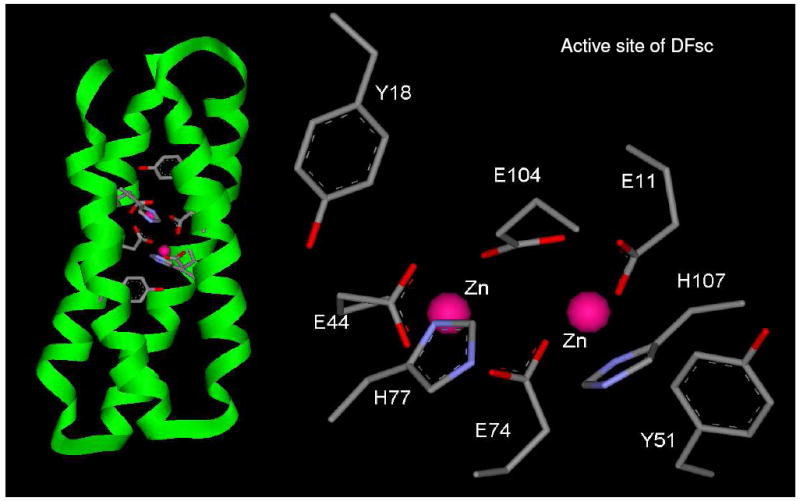
Cartoon diagram of the protein fold and active site NMR structure of diZnII reconstituted DFsc (PDB ID 2HZ8).
In this study, the biferrous sites of DFsc, DFscE11D, DFscY51L and DFscY18F are spectroscopically defined using a combination of circular dichroism (CD), magnetic circular dichroism (MCD), variable temperature variable field MCD (VTVH MCD) and x-ray absorption spectroscopies (XAS). The E11→D substitution was found to stabilize the 520 nm tyrosine bound biferric species and this has been further probed by XAS. Single Y variants of DFsc have been generated to determine which residue is responsible for the 520 nm feature and investigate the influence of second shell amino acids on the diiron site. DFscY51F and DFscY18L were also been generated; a Y to F substitution is more conservative than Y to L though the Stokes radius of L is similar to Y. Experimental complications (heterogeneity and concentration) preclude detailed spectral analysis of DFscY51F. Biferrous sites are spectroscopically inaccessible to traditional physical methods such as UV/vis and EPR, due to the parity forbiddeness of d←d transitions and their integer spin ground states. CD and MCD spectroscopy have different selection rules than absorption spectroscopy and at low temperatures ferrous d←d transitions become intense in MCD, probing the excited states (ES) of the metal ions thus allowing definitive coordination number and geometric assignments (1, 50). The VTVH MCD method uses an excited state to interrogate the ground state (GS) and yields information about the zero field splitting (ZFS) and exchange coupling (J) of the diiron system (50). ZFS provides geometric and electronic information complementary to CD/MCD and the sign and strength of the exchange coupling is diagnostic of possible bridging moieties and coordination modes at the biferrous site. Analysis of XAS data provides information about oxidation state and geometric structure. Together these spectroscopic studies elucidate the nature of the biferrous and biferric sites in these de novo designed peptides and provide insight into their reactivity with O2.
Materials and Methods
A. Sample Preparation
MOPS buffer (Sigma), sodium chloride (Sigma), ferrous ammonium sulfate hexahydrate (Mallinckrodt), deuterium oxide (99.9 atom % D, Aldrich), sodium dithionite (Sigma), and glycerol (98% D, Cambridge Isotope Laboratories) were used as obtained. All anaerobic manipulations were performed under a N2 atmosphere in a glove box. Deuterated buffer was degassed with 99.9% argon; glycerol was degassed by heating under vacuum overnight followed by 10+ freeze-pump-thaw cycles at 10-3 Torr. DFsc and variants were expressed and purified as previously reported and all experiments were performed at pH = 7.0 (pD = 7.4) unless otherwise noted (47, 51). Protein concentrations were determined by using the molar extinction coefficient at 280 nm (ε = 8250 mM-1cm-1 for DFsc and DFscE11D and 6970 mM-1cm-1 for the single Y variants). For CD/MCD measurements, buffer exchange was carried out by adding deuterated buffer to the sample and concentrating to 2-3 mM. This process was repeated until the percentage of D2O was greater than 99.9% of the solvent. The protein samples were prepared and loaded into the sample holders under an inert atmosphere. The procedure for FeII-loading into the apo protein under anaerobic conditions has been previously described (23). To the anaerobic FeII-loaded protein samples, 2 μL of 5 mM methyl viologen and 2 μL of 10 mM dithionite were added to ensure anaerobic conditions during the collection of CD spectra. Protein samples were prepared for MCD in the same way as for CD, with an additional step of mixing the protein with 60% (v/v) glycerol-d6 until homogeneous to create a suitable glass. From CD studies, glycerol was found to have no effect on the biferrous site. The samples were loaded into MCD cells and immediately frozen in liquid nitrogen.
B. UV/vis Absorption
All reactions were performed at 25°C, in 150 mM MOPS, 150 mM NaCl pH 7.0. Final protein concentrations were 100 μM, and 200 μM of iron. An anaerobic ferrous ammonium sulfate solution was added to the protein, mixed and allowed to equilibrate for 30 min prior to loading into the Stop-flow instrument. Absorption kinetics with ~2 ms dead time were obtained using an Applied Photophysics SX.18MV stopped-flow spectrophotometer equipped with a Hg/Xe arc lamp and outfitted with PEEK tubing. The tubing, plungers, and valves of the stopped-flow instrument were made anaerobic by washing with dithionite solution followed by several washes with degassed buffer. O2 exposure was prevented by a stream of N2 gas through the system. The cell path length was 1cm, and the temperature was maintained using a water bath. The kinetic data for the variants were modeled as in previous studies on “wild type” and DFscE11D peptides (49). Rate constants quoted in the text are the average of fits from 3 sets of independent data.
C. CD and MCD Spectroscopy
Near IR (NIR) CD studies were performed on a JASCO J200D spectropolarimeter operating with a liquid nitrogen cooled InSb detector in the 560-2000 nm region. Low-temperature MCD and VTVH MCD data were acquired on this spectropolarimeter, modified to accommodate an Oxford Instruments SM4000 7-T superconducting magnet capable of magnetic fields up to 7.0 T and temperatures down to 1.6 K. Protein samples prepared for MCD studies were slowly inserted into the cryostat to reduce strain in the resulting optical glass. The CD and MCD spectra were fit using a constrained nonlinear least-squares procedure in order to find the minimum number of ligand field transitions required to simultaneously fit both spectra. CD spectra were collected at 4°C and MCD spectra were obtained at 5 K, thus in the fitting procedure bands were allowed to sharpen and shift slightly (<300 cm-1) in MCD relative to CD. VTVH MCD (MCD intensity as a function of temperature and applied magnetic field) data were collected at two wavelengths for DFsc, DFscE11D and DFscY51L. Data were obtained at ~1.8, 3, 5, 7.5, 10, 15, 20 and 25 K and 0, ±0.35, ±0.7, ±1.4, ±2.1, ±2.8, ±3.5, ±4.2, ±4.7, ±5.6, ±6.3, ±7.0 T for each temperature. Reported data points represent the average of 200 to 600 scans at each temperature and field (averaging positive and negative). All the VTVH MCD curves reported here are plotted as a function of βH/2kT. The data were fit using methods previously developed (23, 45, 50, 52). The doublet method uses a series of non-Kramers doublets and/or singlets in a simplex routine that minimizes the χ2 value to simulate the VTVH MCD data (50). The spin-Hamiltonian model fits the VTVH MCD data directly to the Hamiltonian and is described in the Results and Analysis section (52).
D. X-ray Absorption Spectroscopy (XAS)
The reduced XAS samples were prepared under the following conditions: 2.5 mM DFsc in 150 μM MOPS, pH 7, 2.0 mM sodium dithionite, and 40% glycerol; 2.8 mM DFscE11D, 150 μM MOPS, pH 7, 2.4 mM sodium dithionite and 40% glycerol; and 2.8 mM DFscY51L, 150 μM MOPS, pH 7, 6.3 mM sodium dithionite and 50% glycerol. The oxidized DFscE11D XAS samples contained 2.5 mM protein, 150 μM MOPS, pH 7, 40% glycerol and were frozen in liquid nitrogen after 20 seconds of incubation with O2. For each sample, ~100 μL of solution was transferred into a Lucite XAS cell with 37 μM Kapton tape windows in an inert atmosphere and then frozen in liquid nitrogen. The x-ray absorption spectra were recorded at the Stanford Synchrotron Radiation Laboratory (SSRL) on focused 16-pole wiggler beam line 9-3 with the ring operating at 3 GeV, 80–100 mA. A Si(220) double-crystal monochromator was utilized for energy selection at the Fe K edge, and a Rh-coated mirror upstream of the monochromator was used for harmonic rejection. The samples were maintained at 10 K during data collection by using an Oxford Instruments CF1208 continuous-flow liquid-helium cryostat. Data were measured in fluorescence mode as Fe Kα fluorescence by using a Canberra (Meriden, CT) 30-element solid state Ge array detector. The internal energy calibration was performed by simultaneous measurement of the absorption of Fe foil placed between two ionization chambers filled with N2 located after the sample. The first inflection point of the foil was assigned to 7111.20 eV. No photodegradation was observed for the reduced samples. For oxidized DFscE11D, a gradual decrease in the energy of the edge region and slight changes in the EXAFS were observed upon continuous scanning at the same spot. Hence, four distinct and physically separate spots on the three XAS samples were exposed, and only first scans at each spot were used for data analysis. The averaged data included 25 scans for reduced DFsc, 26 scans for reduced DFscE11D, 29 scans for reduced DFscY51L, and 12 scans for oxidized DFscE11D.
The averaged data were normalized with the program XFIT (53) by first subtracting a polynomial background absorbance that was fit to the pre-edge region and extended over the post-edge with control points, followed by fitting a three-region polynomial spline of orders 2, 3, and 3 over the post-edge region. The data were normalized to an edge jump of 1.0 between the background and spline curves at 7130 eV. Theoretical EXAFS signals χ(k) were calculated using FEFF (version 7.02) (54) and fit to the nonfiltered data by EXAFSPAK. The input structure for FEFF was revised according to the fit results obtained. The experimental energy threshold, E0, the point at which the photoelectron wavevector k = 0, was chosen as 7130 eV and was varied in each fit using a common value for every component in the fit. The scale factor, S02, was set to 1.0. The structural parameters that were varied during the refinements included the bond distance (R) and the bond variance (σ2). Atom types and coordination numbers were systematically varied during the course of the analysis, but were not allowed to vary within a given fit. Data were fit over the k range of 2-15 Å-1 for biferrous DFsc, DFscY51L and DFscE11D, and 2-13 Å-1 for oxidized DFscE11D. Fourier transforms of the EXAFS data were calculated with EXAFSPAK.
The intensities and energies of the pre-edge features for all samples were quantified by using the fitting program EDG_FIT and previously established methodology (55). All spectra were fit over several energy ranges (7108–7116 eV, 7108–7118 eV and 7108–7119 eV), with varied backgrounds to give 9-15 fits per sample. Each pre-edge feature was modeled with pseudo-Voigt line shapes of a fixed 1:1 ratio of Lorentzian to Gaussian contributions. The optimal backgrounds were chosen to give a best fit to the pre-edge area while reproducing edge features. Each fit was considered successful if it simultaneously reproduced the data and the second derivative of the data over the entire energy range. The total area is the sum of the areas of all pre-edge features, where the area is approximated by the peak height multiplied by the full width at half maximum, scaled by 100. Error was calculated by determining the standard deviation for peak heights and half widths for each pre-edge feature from all successful fits.
Results
A. CD/MCD Spectroscopy
Anaerobic FeII titrations, monitored by CD spectroscopy, for DFsc and the E11D, Y51L and Y18F variants show saturation behavior for iron uptake maximizing with two equivalents of FeII per peptide (Kd’s for iron binding are estimated at less than 100 μM, Figure S1). Previously it was suggested that the rate of iron loading into DFscE11D was considerably slower than for DFsc (49). Since the binding constants for FeII are similarly high, this must reflect kinetic control of iron access. The fully loaded biferrous peptides each exhibit highly similar NIR CD spectra at 4°C (Figure 2 top). The CD and MCD of DFscY18L were collected and shown in Figure S2, however, they are identical to DFscY18F and the more conservative variant was used for analysis. Each spectrum is composed of one positive low energy feature at ~5,500 to 6,000 cm-1 (note that spectra were not collected below 5,000 cm-1 due to instrument limitations and interference by D2O vibrations) and a broader asymmetric negative feature with an intensity maximum around 9,000 cm-1 that can be resolved into two bands. MCD spectra (Figure 2, bottom) were collected at low temperature and are composed of two positive higher energy transitions in the 7,000 to 9,500 cm-1 that vary in intensity across the series and one weak low energy negative transition (in the MCD spectrum of DFsc, DFscE11D and DFscY18F, but not DFscY51L, this feature changes sign with positive and negative field directions confirming that these are weak electronic transitions not baseline effects). Figure 2 shows simultaneous Gaussian resolution of the CD and MCD spectra. Both spectroscopies have different selection rules thus transitions can have different intensities and signs but must have similar energies. A minimum of three transitions, between ~10,000 and 5,500 cm-1, are required to well reproduce the CD and MCD spectra for each DF variant. The presence of three transitions reflects two inequivalent ferrous ions in the active site, as one ferrous center can only give rise to two d←d transitions in this spectral region (56, 57).
Figure 2.
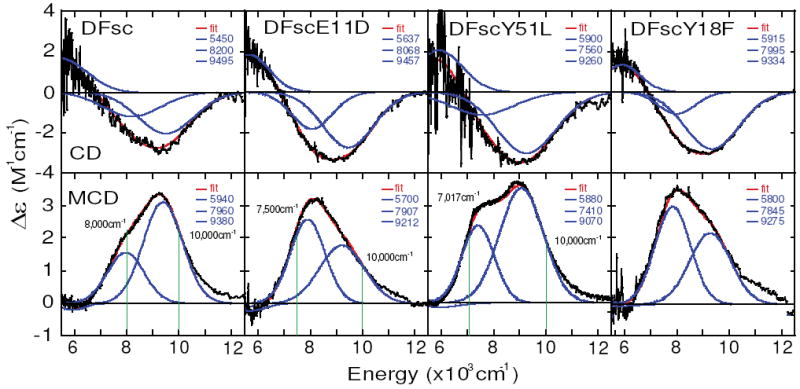
CD/MCD spectra of biferrous DFsc, DFscE11D, DFscY51L and DFscY18F. Top four panels are CD spectra (black) collected at 4°C for each DFsc peptide overlaid with simulated spectrum (red) obtained by summing Gaussian transitions (blue). Bottom four panels are MCD spectra (black) collected at 5 K and 7 T (with 0 T data subtracted out to correct for any baseline effects and LT CD signals) with simulated data (red and blue). Vertical green lines in DFsc, DFscE11D and DFscY51L MCD panels show where VTVH MCD data was collected.
A CD/MCD methodology has been developed to correlate spectra with site geometry (1). FeII in a 6-coordinate (6C) geometry has two MCD transitions around 10,000 cm-1 split by 2,000 cm-1. Square pyramidal (5C) sites display one d←d transition above 10,000 cm-1 and one in the 5,000 cm-1 region; these are lowered in energy on going to a trigional bipyramidal geometry (50). Tetrahedral (4C) sites show only low energy ligand field (LF) transitions, since 10Dq(Td) = −4/9 10Dq(Oh) (50).
The spectrum of DFsc is resolved into three LF transitions at 5,940, 7,960 and 9,380cm-1 (all values quoted in the text are from MCD data, unless otherwise noted). The CD and MCD spectra of the variants are very similar, suggesting they have similar excited states, and the results of simultaneous resolution of the CD and MCD spectra are summarized in each panel of Figure 2 and Table 1. Notably, the Y51L variant shows a significant red shift of ~550 cm-1 of the 7,960 cm-1 band in DFsc. In all these DFsc peptides, features characteristic of 6C iron (i.e. two higher energy transitions) are not observed. The presence of a transition at greater than 8,000 cm-1 requires at least one iron to be 5C. Furthermore, the presence of a low energy band (<6,000 cm-1) with the absence of a feature >10,000 cm-1 suggests a 4C iron, though, a highly distorted 5C site cannot be ruled out based on this alone. As shown below, only a 4C+5C biferrous site (which will be referred to as Fe1 and Fe2, respectively) assignment is consistent with the VTVH MCD data. Thus for DFsc and each variant, the two lower energy transitions (band 1 and 2 in Table 1) are assigned as arising from a distorted tetrahedral FeII center and the highest energy transition (band 3 in Table 1) to a distorted trigional bipyramidal iron. The observation that Y51→L perturbation shifts the energy position of the 7,960 cm-1 band in DFsc by ~550 cm-1 while not significantly affecting the highest energy band supports the assignments above and suggests that this residue exerts an influence on the LF of the 4C iron. The lowest energy LF transition has low signal to noise precluding reliable detection of possible perturbation.
Table 1.
Summary of Gaussian resolution to biferrous CD/MCD data for DF peptides.
| DFsc | DFscE11D | DFscY51L | DFscY18F | |||||
|---|---|---|---|---|---|---|---|---|
| Band | CD (cm-1) | MCD (cm-1) | CD (cm-1) | MCD (cm-1) | CD (cm-1) | MCD (cm-1) | CD (cm-1) | MCD (cm-1) |
| 1 | 5450 | 5940 | 5637 | 5700 | 5900 | 5880 | 5915 | 5800 |
| 2 | 8200 | 7960 | 8068 | 7907 | 7560 | 7410 | 7995 | 7845 |
| 3 | 9495 | 9380 | 9457 | 9212 | 9260 | 9070 | 9334 | 9275 |
B. VTVH MCD
Since the Y51L substitution caused a significant change in the MCD spectrum, relative to DFsc these two peptides were selected for VTVH MCD data collection and analysis. VTVH MCD data were also collected on DFscE11D because this sample was used for oxidized XAS studies due to its increased stability (49) but the results are equivalent to those for DFsc and are presented in the supporting information.
Normalized VTVH MCD data for biferrous DFsc collected at 10,000 and 8,000 cm-1 (vertical green lines in Figure 2 show the energy positions at which data were collected) and for biferrous DFscY51L collected at 10,000 and 7,020 cm-1 are shown in Figure 3 and S4. These energies were chosen to minimize contributions from the overlap between bands. The observed MCD intensity increases as the temperature is decreased, behavior indicative of MCD C-terms associated with paramagnetic doublet ground states that are split in a magnetic field. The saturation magnetization behavior collected on equivalent MCD bands are highly similar for the series, suggesting that the biferrous sites all have similar ground state electronic structures (Figure S3). Interestingly, the isotherms collected at different wavelengths overlay within standard deviation for DFsc but not DFscY51L, Figure S4. The saturation magnetization curves for DFscY51L collected at 7,020 cm-1, the band perturbed by the Y→L variation, are distinctly different from those collected at 10,000 cm-1, consistent with the above result that the 9,070 and 7,410 cm-1 LF transitions are from different iron centers.
Figure 3.
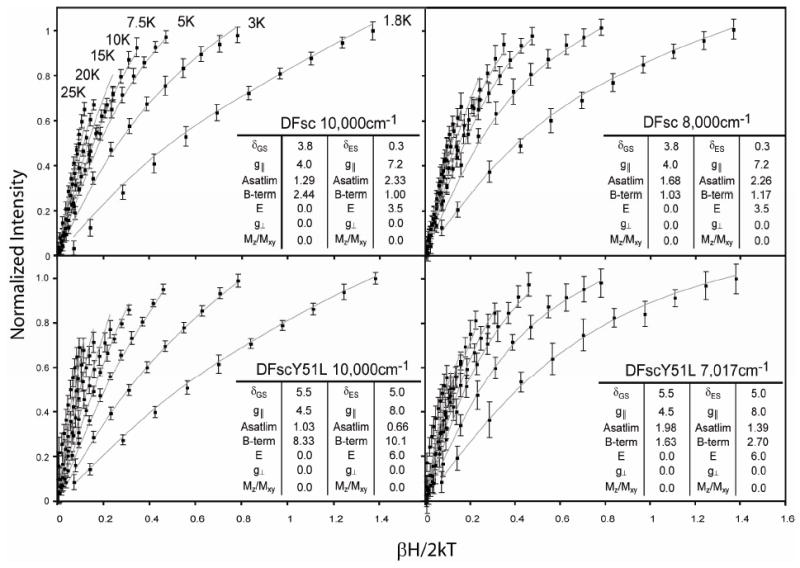
VTVH MCD data of biferrous DFsc and DFscY51L. Normalized data collected at the energies indicated in each panel are represented by red points with standard deviation in black. Temperatures at which each isotherm was collected are shown in the top left panel. Data was simulated using the doublet model, as described in the text, and is overlaid as blue lines; the parameters extracted from analysis are summarized in each inset.
The VTVH MCD data were first fit using a doublet model (energy level diagram show in Figure 4), as previously described (50). The float parameters in this method are (Asat lim)i, Bi, δi, gi∥, gi┴, Ei and Mz/Mxy which are the C-term and B-term MCD intensity, the rhombic ZFS of the ith doublet, dimer effective g-values of the ith doublet, the energy of the ith sublevel and the ratio of the transition dipole moments for the directions indicated, respectively. Initially, the lowest temperature data were fit using only a ground doublet starting with possible g∥ values of 4, 8, 12 and 16 and setting g┴ = 0 = Mz/Mxy. Once other parameters were optimized g┴ and Mz/Mxy were allowed to deviate from zero, but no improvement of the fits was observed. A satisfactory fit to each set could only be obtained with GS parameters of gGS∥ ≅ 4, and δGS ~3.8 and ~5.5 cm-1 for DFsc and DFscY51L, respectively. Isotherms were sequentially added to the fit until a single doublet could no longer accurately reproduce the data (this occurred upon inclusion of the third, 5 K, isotherm) and an additional excited state (both singlet and doublet) was included in the model with the GS doublet parameters fixed. In order to fit the complete data sets (up to 25 K) an excited state doublet with g∥≅ 8 (i.e. Ms = ±2) at ~3.5 and ~6.0 cm-1 was required for the DFsc and DFscY51L VTVH MCD data sets, respectively. The values shown in the insets of Figure 3 give the best fits to the data; however in Table 2 ranges that are still permissible within the error of the data are reported. Inclusion of a second ES did not significantly improve the fits. The final best fits, as reported in the insets of Figure 3 and S5 were obtained by relaxing all constraints and allowing the parameters to float from the previously optimized values. From this analysis the electronic description of the ground and excited states, as well as the energy of the ES are very similar, Table 2. The experimentally observed difference between the 10,000 and 7,020 cm-1 data sets of DFscY51L are due to variations in the Asat lim and B-term values for the ground and excited doublets for the two data sets. As shown below, this reflects that each LF transition is associated with a different FeII.
Figure 4.
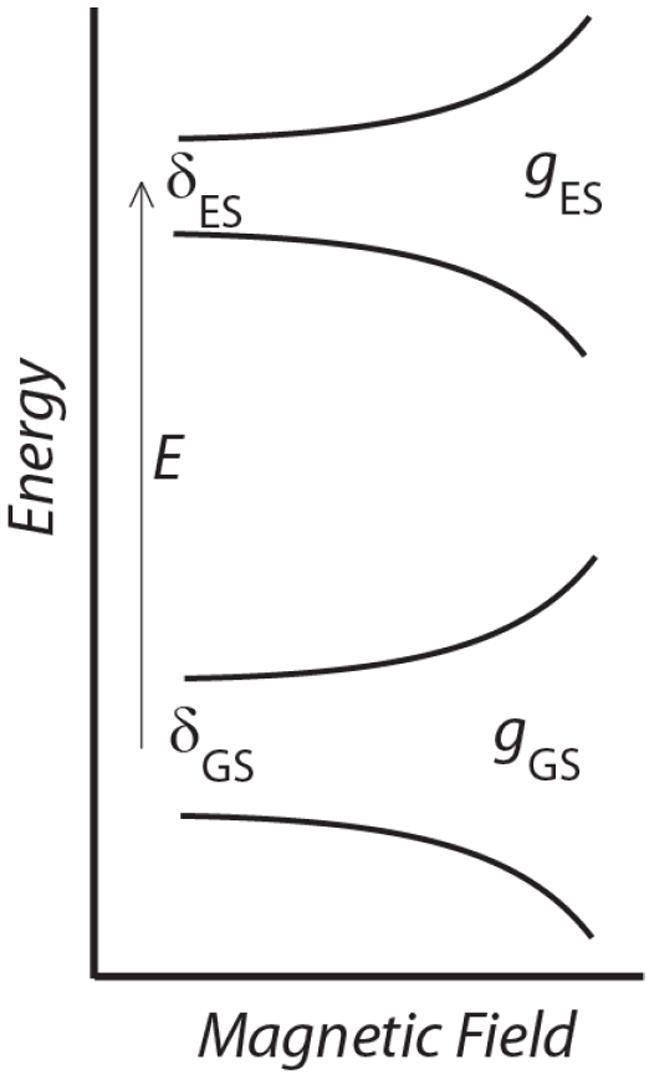
Energy level diagram for doublet model used to simulate biferrous VTVH MCD data. E is the energy spacing between the ground and excited states (GS and ES), gGS and gES are the g-values for the ground and excited states, respectively and δ is the rhombic ZFS parameter.
Table 2.
Summary of physical parameters derived from fits to the biferrious DF peptide VTVH MCD data. Columns summarize parameters from both fitting methods described in the text for the DF variant and wavelength specified.
| DFsc | DFscE11D | DFscY51L | ||||
|---|---|---|---|---|---|---|
| parameter | 10,000 cm-1 | 8,000 cm-1 | 10,000 cm-1 | 7,500 cm-1 | 10,000 cm-1 | 7,020 cm-1 |
| δGS (cm-1) | 3.8 | 3.8 | 4.9 | 4.9 | 5.5 | 5.5 |
| gGS∥ | 4.0 | 4.0 | 4.0 | 4.0 | 4.5 | 4.5 |
| Asatlim | 1.29 | 1.68 | 2.03 | 2.3 | 1.03 | 1.98 |
| B-term | 2.44 | 1.03 | 1.13 | 0.03 | 8.33 | 1.63 |
| δES (cm-1) | 0.3 | 0.3 | 2.0 | 2.0 | 5.0 | 5.0 |
| gES∥ | 7.2 | 7.2 | 8.7 | 8.749 | 8.0 | 8.0 |
| Asatlim | 2.33 | 2.26 | 1.77 | 2.15 | 0.66 | 1.39 |
| B-term | 1.00 | 1.14 | 2.94 | 1.46 | 10.1 | 2.70 |
| aEES (cm-1) | 1 to 5 | 3 to 7 | 3 to 7 | 4 to 8 | 4 to 8 | 3 to 8 |
| aJ (cm-1) | -2.9 to -1.5 | -2.1 to -1.0 | -1.1 to -0.7 | -1.3 to -0.8 | -1.1 to -1.9 | -2.6 to -1.0 |
| aD1 (cm-1) | -4 to -5b | 8 to 10b | -4 to -5b | 7 to 8b | -3 to -5 | 6 to 11 |
| aE/D1 | ~0.33b | < 0.08b | ~0.33b | < 0.08b | ~0.33 | < 0.15 |
| aD2 (cm-1) | 9 to 10b | -4 to -5b | 8 to 9b | -4 to -5b | 6 to 8 | -4 to -6 |
| aE/D2 | < 0.08b | ~0.33b | < 0.08b | ~0.33b | < 0.08 | ~0.33 |
The ranges given were determined by systematically perturbing from the best fit value (given in insets of Figure 2) until the simulated saturation behavior was no longer within the error bars of the data sets.
For these values the subscripts (i.e. D1 to D2) can be interchanged and still reproduce the data
These doublets reflect the energy levels of a binuclear iron site (Figure 5). If a ferrous site deviates from Oh or Td symmetry, the S = 2 non-Kramers ion splits due to axial (Di) and rhombic (Ei) ZFS. Additionally, exchange (J), mediated by bridging ligands, will couple the two S = 2 ions to give S-tot = 4, 3, 2, 1 and 0 dimer states which also split in energy. Since the exchange and ZFS terms are comparable in magnitude for binuclear non-heme ferrous systems they need to be simultaneously considered using the spin-Hamiltonian:
Figure 5.
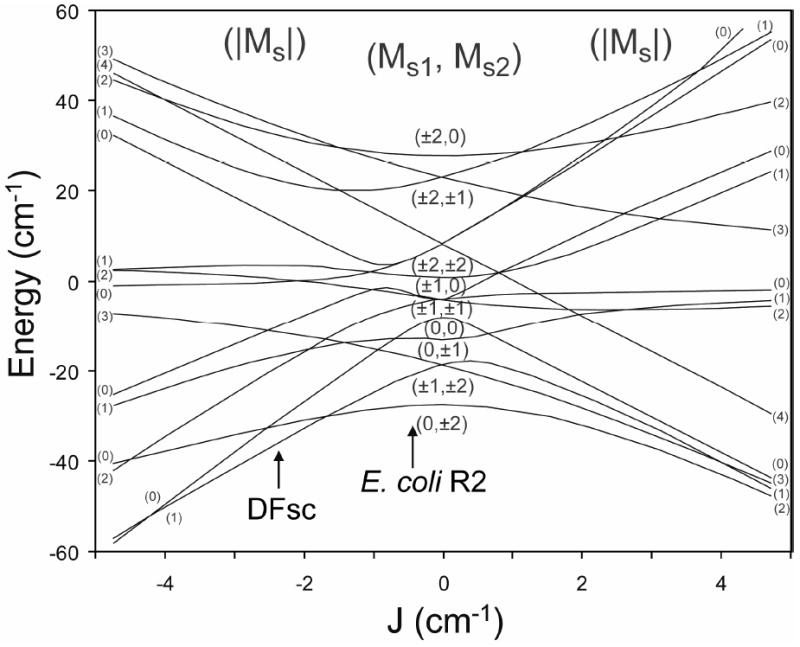
Correlation (J/D) diagram of the energy levels of the biferrous system including exchange coupling and single-site ZFS. The exchange coupling (J) is varied from -5 to +5 cm-1. The central portion gives the pure ZFS limit with states labeled with MS values for each uncoupled FeII (MS1, MS2). The right side indicates a ferromagnetic interaction (J > 0) between the ferrous atoms and the left an antiferromagnetic interaction (J < 0) The spin Hamiltonian used for generating the diagram is shown in the text, with D1 = −4.9 cm-1, D2 = +9.0 cm-1, and E1 = E2 = 0, the GS D values for DFsc determined by fits using the spin-Hamiltonian analysis to the 10,000 cm-1 data set (see Figure 6, top left). Note that E. coli R2 has been added for comparison; however the actually D values differ from those used to make this diagram.
Where J is the exchange coupling between the two irons (negative values reflect antiferromagnetic exchange) and Di, and Ei are the axial and rhombic ZFS parameters for each ferrous center. Diagonalization of the matrix associated with this Hamiltonian gives the wave functions of biferrous spin systems and their energies. Various combinations of the exchange and ZFS parameters produce correlation (i.e. J/D) diagrams with specific GS properties. (Many situations are summarized in ref. 1.) From the doublet model analysis above, all the DFsc peptides have gGS∥ ≅ 4 and gES∥ ≅ 8. This indicates the GS is Ms = ±1 and the first ES is Ms = ±2. This GS electronic structure can only arise in magnetically coupled ferrous dimer systems when the axial ZFS parameters (D) are of opposite signs and the exchange coupling (J) is weakly antiferromagnetic (1). A representative J/D diagram describing this situation is shown in Figure 5, with D1 = −4.9 cm-1, D2 = +9.0 cm-1, and E1 = E2 = 0. In this diagram, the Ms = ±1 GS and Ms = ±2 ES configuration is only observed over the range of J ≈ −1.4 to −2.7 cm-1 (note that the spin crossover point is a function of both D1 and D2). Inclusion of the rhombic terms or non-collinear ZFS tensors in the J/D diagram removes all degeneracy and produces mixed wave functions, however the relative energy ordering of the spin states is not significantly affected (1). From LF theory, 6C sites can have either positive or negative D values describing a compression or elongation along a unique axis, respectively. Square pyramidal (5C) and trigional bipyramidal (5C) sites are typically observed with −D values, while Td sites found in proteins are almost exclusively flattened and thus described by a +D. Since 6C iron is ruled out by the MCD spectra (Figure 2) the site geometry can be assigned by the signs of the D’s as 4C+5C.
Quantitative descriptions of the biferrous sites’ ground state electronic structure were obtained by fitting the VTVH MCD data directly to this spin-Hamiltonian (52). From the above results, the exchange coupling was constrained to 0 < −J < 4 cm-1 and the individual FeII centers were required to have oppositely signed D values (constrained to <|15 cm-1|, the maximum value observed in model studies). Figure 6 shows simulations obtained for the VTVH MCD data for DFsc and DFscY51L. (Figure S6 shows the best fit simulations obtained for the DFsc, DFscE11D and DFscY51L VTVH MCD data sets.) MCD intensity is proportional to the spin-expectation values of the single iron center being probed projected onto the dimer states (i.e. the iron responsible for the transition on which the data are collected, and given the subscript 1 for ZFS parameters in this analysis). For DFsc satisfactory simulations can obtained with both D1 > 0/D2 < 0 or D1 < 0/D2 > 0 (see Figure S6 panel A to D) and therefore correlating Di’s with specific MCD transitions cannot be made from this alone. There is, however, a preference for assigning the −D to the higher energy band since the best fits in the alternative situation no longer has a Ms = ±1 GS, Figure S6 panel C. For all fits the iron with a −D required an E/D of ~0.33 and the iron with the +D an E/D < 0.08. The GS electronic structure descriptions obtained by directly fitting to the spin-Hamiltonian are analogous to those from the dimer model (i.e. the MS of the ground and excited spin states, δGS and energy of the first ES) giving confidence to the fits. The parameters extracted for the best fits to each data set are given in the insets of Figure 6 and S6 and the range of values that can still reproduce the data within error are summarized in the bottom portion of Table 2. The ground state electronic structure of DFsc is best described as a weakly antiferromagnetically coupled (−2.9 > J > −1.0 cm-1) biferrous system with D values of −5 > D > −4 cm-1 and 10 > D > 8 cm-1.
Figure 6.
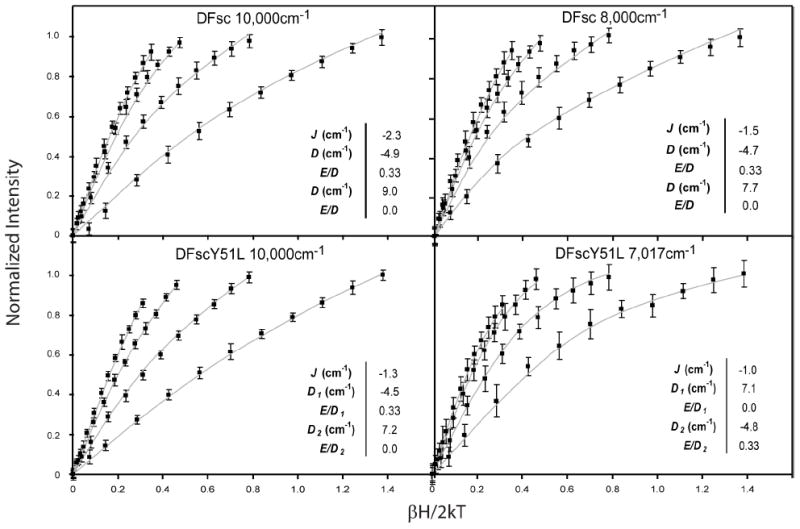
Biferrous VTVH MCD data of DFsc and DFscY51L overlaid with simulations using binuclear Hamiltonian. Each panel shows the four lowest temperature isotherms (data points) collected at on the variant and energy described in each panel. Solid lines show the best fits to the complete data sets (i.e. all isotherms up to 25 K) from spin-Hamiltonian analysis described in the text to the data and extracted parameters are shown in insets. The values reported in the insets correspond to the best fit shown, however Table 2 gives values for each physical parameter based on other fits to the data that are still within the experimental error of the data.
Unlike the VTVH MCD data collected for DFsc, the two data sets collected at 10,000 cm-1 and 7,020 cm-1 for DFscY51L do not overlay within standard deviation and allow firm assignments of ZFS parameters to specific FeII centers. The bottom two panels of Figure 6 and the panels I though L of Figure S6 show the best fits obtained for the DFscY51L VTVH MCD data using the spin-Hamiltonian analysis. In Figure S6, panel I and K show the fits to the VTVH MCD data collected at 10,000 cm-1, on the band assigned to the 5C FeII, vide supra. The D1 > 0/D2 < 0 fit does not accurately reproduce the data (Figure S6 panel K). However, the D1 < 0/D2 > 0 fit (bottom left panel of Figure 6 and panel I of S6) does and gives the same electronic description obtained from the doublet fit (bottom left panel of Fig 5). The J, D1 and D2 obtained are −1.3, −4.2 and +7.2 cm-1, respectively (values quoted are from the best fit to the 10,000 cm-1 data set, since the signal to noise ratio is considerably higher, ranges are given in Table 2). Again, the iron with a −D is best described by an E/D of 0.33 and the +D iron by an E/D of <~0.08. The VTVH MCD data collected at 7,020 cm-1 (note, the standard deviation on this data set is larger due to its decreased intensity and lower energy) can be simulated, within standard deviation, with either D1 > 0/D2 < 0 (bottom right of Figure 6 and panel J of S6) or D1 < 0/D2 > 0 (panel L in Figure S6). However, the D1 > 0/D2 < 0 fit (bottom right panel of Figure 6 and panel J of Figure S6) is visually better and agrees with the parameters extracted from the VTVH MCD data from the 10,000 cm-1 band (Table 2). From this analysis, the 7,410 cm-1 MCD transition in DFscY51L is associated with a positive D value of ~7.2 cm-1 and E/D ratio close to zero (Fe1), and the 9,070 cm-1 transition with a negative D value of approximately −4.5 cm-1 and an E/D of 0.33 (Fe2). From Table 2, the largest effect of the Y51→L perturbation is a slight lowering of the +D value relative to DFsc. This also suggests that Y51 exerts a dominant effect on the LF of Fe1 consistent with the above MCD results. The site geometry and band assignments of DFsc and DFscE11D, both 4C+5C, are made by correlation to the results for DFscY51L and the fact that the E11D and Y51L variations do not significantly affect the first shell as observed in EXAFS spectra of the biferrous peptides (vide infra).
C. UV/vis Absorption Spectroscopy
The biferrous sites of DFsc and its amino acid variants react rapidly with O2. The spectroscopically observable species formed in the reactions are shown in Figure 7. The apparent formation rate constants for DFsc and DFscE11D have been previously reported as 2.1 ± 0.1 and 4.4 ± 0.3 s-1, respectively (49). A similar analysis for the tyrosine mutants gives apparent formation rate constants of 5.1 ± 0.7 and 2.3 ± 0.2 s-1 for DFscY51L and DFscY18F, respectively, Figure S8. In DFsc, DFscE11D and DFscY18F, the species formed have a λmax at ~520 nm with molar extinction coefficients (ε of ~1500 to 2000 mM-1cm-1. The 520 nm feature has previously been assigned, using resonance Raman spectroscopy, for DFsc and DFscE11D as a phenolate to ferric charge transfer transition (49). Two pseudo symmetric Y residues are present in the DFsc protein at ~4 Å from each of the two iron atoms approximately collinear with the Fe-Fe vector (based on diZn NMR structure) (47). Thus either could bind terminally to one ferric center of the binuclear site. Removal of Y18 does not result in the loss of the 520 nm feature, while removal Y51 does. This indicates that Y51 is coordinated to iron in the biferric state and the source of the 520 nm charge transfer transition. The 520 nm species has previously been show to be significantly more stable in DFscE11D relative to DFsc and thus this variant was selected for the oxidized XAS studies below (49).
Figure 7.
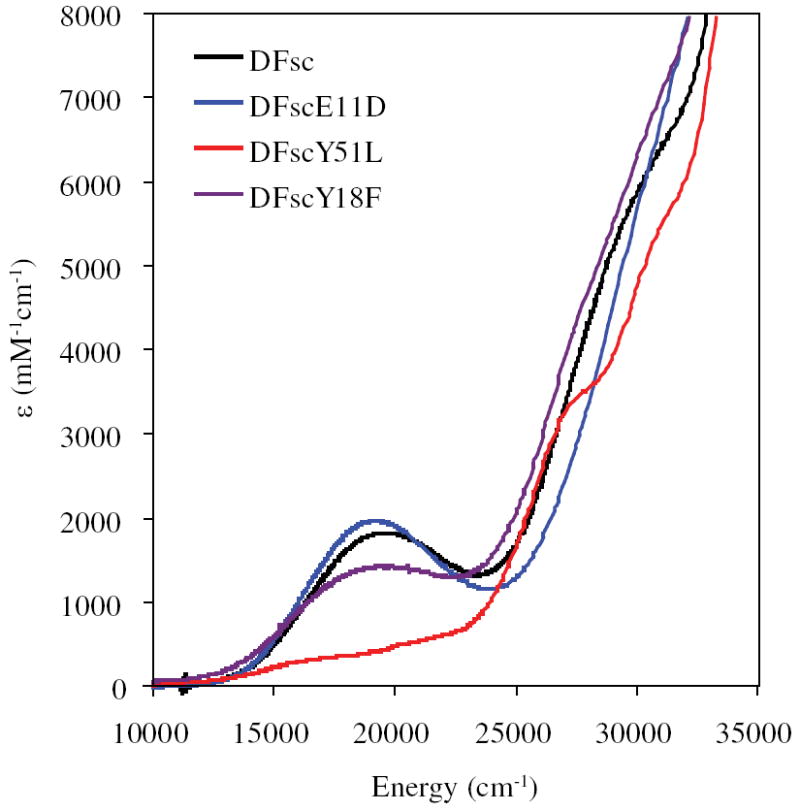
UV/vis absorption spectra of species formed upon reaction of DF variants with O2. Peptide concentration was 100 μM anaerobically incubated with 200 μM ferrous iron prior to reaction with an equal volume of O2 saturated buffer. Spectra were collected allowing the reaction to progress 2 s for DFsc and 1 s for all other variants.
D. XAS spectroscopy
Fe K edge of biferrous sites
Figure 8 shows a comparison of the iron K-edge x-ray absorption spectra for DFsc, DFscY51L, and DFscE11D, where the XAS data for each peptide correspond to an average over the binuclear site. The rising edge energy position is consistent with the FeII oxidation state and is similar for the three peptides, suggesting similar effective nuclear charges. Because the shape and intensity of the metal Kedge region are sensitive to both near and long-range structure at the metal site, the fact that that the edge spectra do not completely coincide in the 7110–7150 eV region indicates that some minor differences exist in the local structure of the iron centers, as observed in MCD, vide supra. In particular, the edge shape and intensity are more similar between DFsc and DFscY51L than between DFsc and DFscE11D, suggesting that the Y51L mutation perturbs the local structure of the iron cluster of DFsc to a lesser extent than does E11D. This result serves as indirect evidence that Y51 is not directly bound to the iron in biferrous DFsc.
Figure 8.
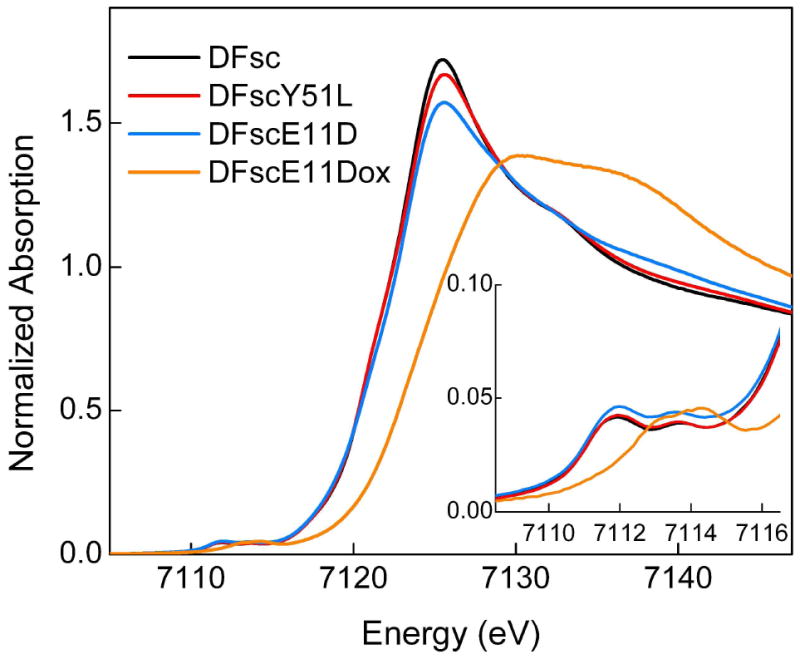
Fe K-edge spectra for biferrous DFsc, biferrous DFscY51L, biferrous DFscE11D, and oxidized (biferric) DFscE11D. The inset shows the magnified pre-edge region.
The iron K-pre-edge shape and intensity pattern in the 7108–7116 eV energy region are probes of oxidation and spin state, coordination number, and geometry at the average iron site (55). The total pre-edge area typically increases with a decrease in the centrosymmetry of the iron site through increased iron 3d-4p mixing, such that 6C high-spin mononuclear ferrous complexes have a pre-edge intensity of ~4 units, while 5C and Td mononuclear models are typically fit with ~12 and ~15 units of intensity, respectively. The pre-edge spectra of DFsc, DFscY51L, and DFcsE11D consist of two peaks centered at 7111.8 and 7113.7 eV with the total pre-edge area of 8.3–9.4 units (Figure 8, inset; Table 3). The number and energy position of these peaks are characteristic of high-spin ferrous species, but the integrated intensity falls into a region intermediate between 6C and 5C/4C complexes. However, the MCD results rule out the possibility of 6C iron for any of the DFsc peptides. Hence, the pre-edge intensity and, consequently, 3d-4p mixing, are somewhat lower for the DFsc peptides than for mononuclear 4C and 5C model compounds.
Table 3.
XAS Pre-edge Fit Results for biferrous DFsc, biferrous DFscY51L, biferrous DFscE11D, and oxidized DFscE11D.
| Sample | Pre-edge Peak Energy | Pre-edge Peak Intensitya | Total Pre-edge Peak Intensitya |
|---|---|---|---|
| DFsc | 7111.79 (0.04) | 5.8 (0.7) | 8.3 (0.7) |
| 7113.68 (0.07) | 2.5 (0.6) | ||
| DFscY51L | 7111.80 (0.02) | 5.8 (0.5) | 9.4 (0.6) |
| 7113.66 (0.05) | 3.6 (0.5) | ||
| DFscE11D | 7111.84 (0.03) | 6.1 (0.7) | 9.1 (0.6) |
| 7113.65 (0.08) | 3.0 (0.3) | ||
| oxDFscE11D | 7113.36 (0.07) | 8.6 (1.5) | 9.6 (1.4) |
| 7114.59 (0.04) | 1.0 (0.2) | ||
Values reported for the pre-edge intensity are multiplied by 100 for convenience.
EXAFS of biferrous sites
The iron K-edge k3-weighted EXAFS data, corresponding Fourier transforms (FT’s), and representative multi-shell EXAFS fits for DFsc, DFscY51L, and DFscE11D are displayed in Figure 9(a and b). The results of the EXAFS curve-fitting analysis of the first iron coordination sphere and visual representation of the respective fits are given in Table 4 and Figures S7(a to i). In addition to first sphere O/N atoms, each fit in Table 4 includes a shell of carbon scatterers at ~3.0 Å, typically required in fits to EXAFS data of many non-heme binuclear iron enzymes as carbon atoms of ligating carboxylates and imidazoles. Inclusion of this shell visual improves the fit to the first shell in R’-space, and a coordination number of two gives the lowest fit error value.
Figure 9.
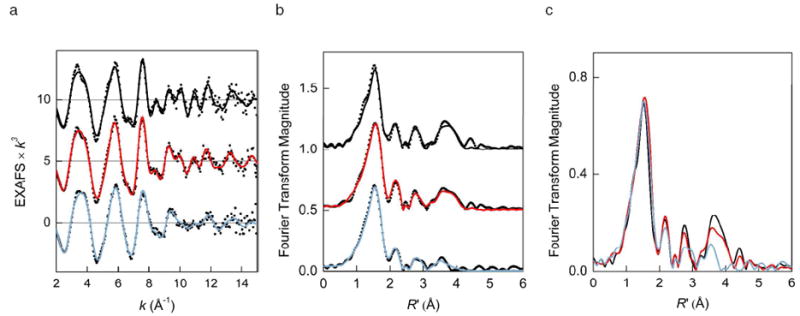
(a) Fe K-edge EXAFS and (b) non-phase-shift corrected Fourier transforms of biferrous (top to bottom) DFsc, DFscY51L, and DFscE11D. Experimental data, dots; representative multi-shell fits from Table 5, solid lines. (c) Non-phase-shift corrected Fourier transforms of experimental EXAFS data for biferrous DFsc (black), DFscY51L (red), and DFscE11D (blue).
Table 4.
First-shell EXAFS Curve-Fitting Results for Biferrous DFsc, Biferrous DFscY51L, and Biferrous DFscE11D.a
| DFsc | DFscY51L | DFscE11D | ||||||||
|---|---|---|---|---|---|---|---|---|---|---|
| fit no. | 1 | 2 | 3 | 4 | 5 | 6 | 7 | 8 | 9 | |
| Fe–O/Nb | N | 5 | 2 | 2 | 5 | 2 | 2 | 5 | 2 | 2 |
| R (Å) | 2.07 | 2.02 | 2.03 | 2.07 | 2.02 | 2.03 | 2.07 | 2.01 | 2.02 | |
| σ2 × 10⁵ (Å2) | 1230 | 370 | 390 | 1040 | 470 | 530 | 1140 | 500 | 540 | |
| Fe–O/Nb | N | – | 3 | 3 | – | 3 | 3 | – | 3 | 3 |
| R (Å) | – | 2.16 | 2.16 | – | 2.14 | 2.14 | – | 2.13 | 2.14 | |
| σ2 × 10⁵ (Å2) | – | 650 | 700 | – | 670 | 810 | – | 710 | 820 | |
| Fe–C | N | – | – | 1 | – | – | 1 | – | – | 1 |
| R (Å) | – | – | 2.55 | – | – | 2.55 | – | – | 2.54 | |
| σ2 × 10⁵ (Å2) | – | – | 470 | – | – | 200 | – | – | 400 | |
| Fe–C | N | 2 | 2 | 2 | 2 | 2 | 2 | 2 | 2 | 2 |
| R (Å) | 2.96 | 3.00 | 3.00 | 2.96 | 2.99 | 2.99 | 2.96 | 3.01 | 3.01 | |
| σ2 × 10⁵ (Å2) | 590 | 390 | 430 | 730 | 460 | 570 | 1000 | 760 | 810 | |
| ΔE0, eV | −9.1 | −6.0 | −5.7 | −8.4 | −6.0 | −5.9 | −7.1 | −4.6 | −4.4 | |
| Fc | 0.433 | 0.393 | 0.391 | 0.345 | 0.333 | 0.309 | 0.270 | 0.255 | 0.233 | |
All fits were performed over the k range of 2-15 Å-1. The estimated uncertainty in R is ± 0.02 Å for the first shell and ± 0.05 Å for outer shells; the uncertainty in N is ~25%.
Scatterers differing by Z ± 1 are not distinguishable in an EXAFS fit. The first element in a pair indicates the type of atom used to model the backscattered wave in the FEFF calculation.
The goodness of the fit is defined as F = [Σ(k6(χexptl – χcalcd)2)/(Σk6χexptl2)]½.
For DFsc, a single first shell composed of 4, 5, or 6 O/N scatterers leads to an incomplete fit to the first-shell peak (Table 4, fit 1, and Figure S7(a)), and hence a split first shell of 2 and 3 O/N atoms at 2.03 and 2.16 Å, respectively, is used to model the data (fit 2 and Figure S7(b)). It should be noted that the difference in these bond lengths is close to the resolution limit of the current data (0.11 Å). In contrast, the data for DFscY51L and DFscE11D are well fit with a single shell of 5 O/N scatterers at 2.07 Å (fits 4 and 7, Figures S7(d, g)), which suggests that individual Fe–ligand distances have a higher static disorder than for DFsc and thus may be combined into a single shell. A very high Debye-Waller factor of ~0.01 Å2 for a single shell in all samples indicates that there is a wide range of Fe-O/N distances for the two iron atoms. If a split first-shell model is used for all peptides (fits 2, 5, and 8), on going from DFsc to DFscY51L to DFscE11D both short and long-distance Fe–O/N interactions remain at approximately the same distance of 2.02–2.01 and 2.16–2.13 Å, while the corresponding σ2 values increase for the two variants. These results imply that Y51L and E11D replacements only slightly perturb the iron-ligand distances in the first shell of DFsc.
Interestingly, for all DFsc peptides, a three-component fit to 3.0 Å, such as fit 2, does not properly model the intensity of the small peak in the FT centered at ~2.2 Å (Figures S7(b, e, h)), even if additional outer-shell scattering components are added to the fit to account for the scattering up to 5.0 Å. A visual improvement to this peak is achieved when a light atom is included at ~2.55 Å (fits 3, 6, and 9 and Figures S7(c, f, i)), modeled as the carbon of a bidentate carboxylate. Reducing the coordination number from 1.0 to 0.5 leads to a negative σ2 value for this component; however, determination of the exact coordination number is complicated by the fact that the scattering amplitude of a single light atom at 2.5 Å is low and highly correlated to N and σ2 of surrounding O/N and C shells.
While the iron environment up to R’ of ~2.4 Å is extremely similar for the three samples, the outer-sphere scattering for 2.4 < R’ < 4.0 Å reveals structural differences between the DFsc peptides (Figure 9c). Particularly, the amplitude of the FT peaks at R’ ~2.8 and ~3.8 Å in the spectrum of DFsc is substantially reduced for DFscE11D. Detailed fits to the outer shell region have been performed to establish whether the observed differences can be related to changes in the Fe–Fe separation within the cluster (see Supporting Information). For DFsc, starting with fit 3 in Table 4, an Fe atom can be included at 3.3 Å with σ2 of 0.0150 Å2 or at 4.1 Å with σ2 of 0.0043 Å2. The former contribution has a very large σ2 value and therefore such fits are discarded, while the inclusion of the latter component models the broad peak between 3.0 Å and 4.0 Å in the FT incompletely (Figure S8, fit d2). To match the observed FT pattern, a number of additional single and multiple scattering paths are necessary; however, the Fe–Fe component in the final fit can be substituted with a shell of five carbon atoms at a similar distance with an equivalent goodness-of-fit value (Table S1 and Figure S8, fit d6 vs. d5). This result indicates that for DFsc it is not be possible to discriminate between a potential Fe–Fe component at ~4 Å and light atom scatterers at a similar distance originating from protein-derived ligands. This previously described limitation of the EXAFS analysis of binuclear metal proteins with unknown spatial structure is due to a high degree of correlation between a metal-metal and metal-carbon waves at long distances and the low intensity of the Fe–Fe scattering wave in diiron clusters with a long Fe–Fe separation and no rigid bridging ligands such as oxo or multiple hydroxo ligands (58). With either Fe–Fe or Fe–C components contributing to the peak at ~3.8 Å of FT for DFsc, the need for additional scattering components indicates that imidazolyl and carboxylate groups contribute measurably to outer-shell scattering. In addition, the pattern and intensity of the FT features for DFsc are comparable to those for Fe2(μ-O2CArTol)4(t-Bu-Py)2, a biferrous complex with four carboxylato bridges whose outer-shell peaks between 2.4 Å < R’< 4.0 Å arise solely from single and multiple scattering from light atoms of the pyridine and carboxylate groups, Figure S9. Taken together, these results suggest that the outer shells for DFsc are dominated by the contributions from the imidazolyl ring and carboxylate groups and can be reasonably modeled without an Fe–Fe component.
For DFscE11D, the multi-shell EXAFS fit using the same components as for DFsc for direct comparison results in reduced coordination numbers and large σ2 values for the outer shells relative to those of DFsc, Table 5. Alternative fits with the Fe–Fe contribution to the distant FT peak display the same fit quality and again low coordination numbers and high σ2 values for outers-shell components; the putative Fe–Fe distance remains at the same value as for DFsc within the error of the EXAFS analysis, Table S1. For DFscE11D, both structural models are consistent with the disruption of the coherence of single and multiple-scattering paths originally present in DFsc data, possibly by affecting the spatial orientation of the carboxylate from the mutated residue, or by changing the Fe–ligand distances at the same iron. In contrast, the Y51L substitution leaves the outer shells of DFsc mostly intact (Figure 9c and Table 5) thus suggesting that Y51L is not directly bound to the Fe in DFsc.
Table 5.
Multi-Shell EXAFS Curve-Fitting Results for Biferrous DFsc, DFscY51L, and DFscE11Da.
| Sample | R (Å) | σ2 × 10⁵ (Å2) | ΔE0 | Fc | |
|---|---|---|---|---|---|
| DFsc | 2 Fe–O/Nb | 2.03 | 380 | −5.9 | 0.241 |
| 3 Fe–O/N | 2.16 | 690 | |||
| 1 Fe–C/O | 2.55 | 470 | |||
| 2 Fe–C | 3.00 | 430 | |||
| 4 Fe–N–Cd | 3.20 | 430e | |||
| 2 Fe–C | 3.60 | 320 | |||
| 2 Fe–C | 3.78 | 440 | |||
| 5 Fe–C | 4.15 | 560 | |||
| 10 Fe–N/C–C/N/Of | 4.35 | 560e | |||
| DFscY51L | 2 Fe–O/N | 2.03 | 530 | −6.2 | 0.191 |
| 3 Fe–O/N | 2.13 | 810 | |||
| 1 Fe–C/O | 2.55 | 190 | |||
| 2 Fe–C | 3.00 | 670 | |||
| 4 Fe–N–Cd | 3.30 | 670e | |||
| 2 Fe–C | 3.61 | 430 | |||
| 2 Fe–C | 3.78 | 410 | |||
| 5 Fe–C | 4.17 | 670 | |||
| 10 Fe–N/C–C/N/Of | 4.35 | 670e | |||
| DFscE11D | 2 Fe–O/N | 2.00 | 530 | −4.8 | 0.194 |
| 3 Fe–O/N | 2.13 | 790 | |||
| 1 Fe–C/O | 2.54 | 380 | |||
| 2 Fe–C | 3.02 | 780 | |||
| 4 Fe–N–Cd | 3.31 | 780e | |||
| 2 Fe–C | 3.63 | 470 | |||
| 2 Fe–C | 3.79 | 710 | |||
| 3 Fe–C | 4.05 | 1130 | |||
| 6 Fe–N/C–C/N/Of | 4.36 | 1130e | |||
All fits were performed over the k range of 2-15 Å-1. The estimated uncertainty in R is ± 0.02 Å for the first shell and ± 0.05 Å for outer shells; the uncertainty in N is ~25%.
Scatterers differing by Z ± 1 are not distinguishable in an EXAFS fit. The first element in a pair indicates the type of atom used to model the backscattered wave in the FEFF calculation.
The goodness of the fit is defined as F = [Σ(k6(χexptl – χcalcd)2)/(Σk6χexptl2)]½.
Modeled as the Fe-N-C path of 128° of an imidazole ring.
The σ2 values for multiple-scattering paths were restricted to those of the corresponding single-scattering paths.
Modeled as the Fe-N-C path of 158° of an imidazole ring.
Fe K edge of oxidized DFscE11D
The iron x-ray absorption K-edge shifts to higher energy from reduced to oxidized DFscE11D (Figure 8, orange), with the magnitude of the shift consistent with conversion from a biferrous to a biferric site. The fit to the pre-edge area (Figure 8, inset) requires two peaks centered at 7113.4 and 7114.6 eV, with the areas of 8.6 and 1.0 units, respectively (Table 3). These pre-edge features fall within the energy range of high-spin ferric compounds (55), further supporting the oxidation state assignment from the edge shift. Oxidation of both Fe’s is supported by the result that no substantial absorption intensity is present between 7,111.1 and 7,111.9 eV, where a lower energy pre-edge peak is observed for model ferrous compounds(55) and the biferrous DF peptides (Table 3). The intensity distribution between the two peaks is very different from that observed for μ-oxo bridged biferric model complexes, which typically have an intense higher energy peak of 8–13 units and a lower energy shoulder of 3–4 units (55). Therefore, a μ-oxo bridge can be ruled out for oxidized DFscE11D. Diiron complexes with weaker coupling between the iron centers are known to exhibit pre-edge areas consistent with the mononuclear complexes of the same coordination number (55). The total pre-edge area of 9.6 units for oxidized DFscE11D is between the areas for 6C (4.0–7.3 units) and 5C (14.4 units) mononuclear high-spin ferric complexes (55). It is also higher than the area of 6C biferric complexes containing μ-hydroxo or μ-phenolato bridges (5.5–8.5 units) (55). This suggests coordination models for oxidized DFscE11D of either a distorted 6C+6C or a 5C+6C, both lacking an oxo bridge. However, the variable temperature MCD results show that the biferric site in DFscE11D is diamagnetic and therefore antiferromagnetically coupled by some bridging ligand(s) (49).
EXAFS of oxidized DFscE11D
The iron K-edge k3-weighted EXAFS data and corresponding FT for oxidized DFscE11D are presented in Figure 10. Table 6 shows results of the EXAFS fits using a single first shell (fits 10-11) and multiple shell (fits 12-14) models. The best fit to the EXAFS data (Table 6, fit 12, and Figure 10) yields five O/N ligands at an average distance of 2.02 Å, a contraction by 0.05 Å from the first-shell distance for biferrous DFscE11D, consistent with oxidation to a biferric site. The error for a 6C first-shell fit is only slightly higher (Table 6, fit 13, F = 0.239 vs. 0.232), thus both 5C and 6C models are consistent with the EXAFS data. As for the biferrous precursor, the Debye–Waller factor of 0.01 Å2 for oxidized DFscE11D suggests that there is a wide range of distances for the first sphere. If the first shell is modeled with two components, the short-distance component refines to a distance of 1.89 ± 0.03 Å with the coordination number of 0.5 (fit 14); a coordination number of 1.0 leads to an unreasonably high Debye–Waller factor. The distance of 1.89 Å is consistent with typical FeIII–O(phenolate) bond lengths and may be attributed to coordination of Y51. If an Fe–O component at ~1.80 Å is included in the fit, it refines to a longer ~1.90 Å distance, consistent with the pre-edge analysis that no oxo bridge is present.
Figure 10.
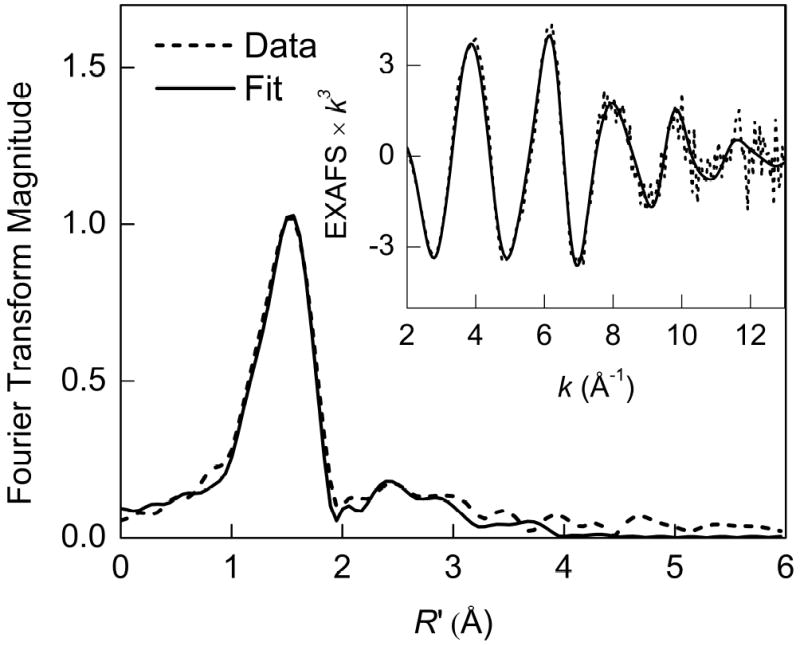
Non-phase-shift-corrected Fourier transform and Fe K-edge EXAFS data (inset) for oxidized (biferric) DFscE11D. Data (dashed line); fit 12 (solid line).
Table 6.
EXAFS Curve-Fitting Results for Oxidized DFscE11D.a
| fit no. | R (Å) | σ2 × 10⁵ (Å2) | ΔE0 | Fb | |
|---|---|---|---|---|---|
| 10 | 5 O/N | 2.02 | 970 | −4.3 | 0.308 |
| 11 | 6 O/N | 2.02 | 1170 | −4.5 | 0.315 |
| 12 | 5 Fe–O/Nc | 2.02 | 960 | −4.4 | 0.232 |
| 2 Fe–C | 2.97 | 530 | |||
| 2 Fe–C | 3.34 | 720 | |||
| 4 Fe–N–C/Nd | 4.18 | 740 | |||
| 13 | 6 Fe–O/Nc | 2.02 | 1160 | −4.8 | 0.239 |
| 2 Fe–C | 2.97 | 530 | |||
| 2 Fe–C | 3.33 | 740 | |||
| 4 Fe–N–C/Nd | 4.17 | 650 | |||
| 14 | 0.5 Fe–O | 1.89 | 450 | −5.0 | 0.226 |
| 5 Fe–O/N | 2.03 | 870 | |||
| 2 Fe–C | 2.97 | 550 | |||
| 2 Fe–C | 3.33 | 750 | |||
| 4 Fe–N–C/Nd | 4.17 | 640 | |||
All fits were performed over the k range of 2-13 Å-1. The estimated uncertainty in R is ± 0.02 Å for the first shell and ± 0.05 Å for outer shells; the uncertainty in N is ~25%.
The goodness of the fit is defined as F = [Σ(k6(χexptl – χcalcd)2)/(Σk6χexptl2)]½.
Scatterers differing by Z ± 1 are not distinguishable in an EXAFS fit. The first element in a pair indicates the type of atom used to model the backscattered wave in the FEFF calculation.
Modeled as the Fe-N-C path of 158° of an imidazole ring.
The outer-sphere scattering for oxidized DFscE11D is weak but can still be modeled with three groups of single and multiple scattering paths at 2.97, 3.34 and 4.18 Å (Table 6) with low coordination numbers which would correspond to scattering from a single imidazole ring. The individual contributions from these components are illustrated in k- and R’-space in Figure S11. This result quantitatively demonstrates the low intensity of the outer-shell features and suggests orientational disorder in the imidazole and carboxylate ligands. The weak intensity of outer-sphere scattering in the FT for oxidized DFscE11D contrasts with the intense outer-shell features observed for biferric complexes and proteins with short Fe–Fe distances of 3.0–3.4 Å (59-61). In these systems, there is typically at least one single-atom bridge, such as O2−, OH−, or OR−, and additional carboxylato or alkoxo bridging groups. For example, oxidized methane monooxygenase hydroxylase contains a triply bridged bis μ-hydroxo/μ-carboxylato diiron center and displays an intense Fe–Fe peak (59). Therefore, the absence of a detectable Fe–Fe shell for oxidized DFscE11D suggests that the iron atoms are also unlikely to be bridged by a combination of hydroxo and carboxylate bridges.
Discussion
From the CD titrations (Figure S1) of all DF variants, the active sites are clearly binuclear and have similar high binding affinities for ferrous ions. The excited state information derived from the NIR CD and MCD spectra of DFsc and each variant (Figure 2) indicate all posses 4C+5C biferrous active sites (62). Analysis of the VTVH MCD data shows that the ground states of these are non-Kramers doublets with Ms = ±1, an electronic configuration diagnostic of opposite signed D’s and weak antiferromagnetic coupling. Weak coupling results from μ-1,3 carboxylate bridges that do not form efficient superexchange pathways. The Y51→L substitution eliminates the 520 nm absorption band formed by reaction with O2, red shifts the 7,960 cm-1 MCD band in biferrous DFsc (assigned as the highest energy d←d transition of a 4C iron) and lowers the +D associated with the 4C FeII (Table 2). However, this variation does not significantly affect the biferrous XAS or EXAFS spectrum below 3 Å (Figures 8 and 9). These data show that Fe1 is proximal to Y51 and that Y51 is not bound in the biferrous state. Previous resonance Raman studies showed that one Y binds to the biferric site (49). The data presented here establish that this is Y51 with an FeIII–O bond length of 1.89Å (determined from fits to the oxidized DFscE11D EXAFS). The pre-edge and EXAFS of oxidized DFscE11D also show that the biferric site does not posses an oxo bridge. Y51’s influence on the LF of Fe1 likely involves an interaction with the coordinating E11 reside since they are on adjacent helices and appear to be H-bonding in the diZn NMR structure of DFsc (47). The Y51L substitution would result in a rearrangement of E11 upon elimination of the H-bond between its uncoordinated O and Y51. This would perturb the LF of the 4C iron while not significantly affecting the bond distances of the first shell ligands (i.e. EXAFS below 3 Å, Figure 9). The carboxylate coordinated to Fe2, E44, is bidentate consistent with the 2.55 Å feature indicative of this coordination mode observed in the FT EXAFS data (Figure 9).
The biferrous sites in various class I R2’s have been shown to be 4C+5C (6, 23, 63-65). The E. coil R2 CD and MCD spectra are compared to the DFsc data in Figure 11. There are sign differences present in both the CD and MCD, however the spectral shape of resolved bands and energies of the transitions are highly similar, suggesting similar geometric and electronic structures. VTVH MCD results for E. coli R2 show that the ground state is Ms = ±2 arising from two ferrous ions with D’s of −10 and +4 cm-1 exchange coupled with a J = −0.44 cm-1 (6). From Figure 5 (arrows), a slight increase in the strength of antiferromagnetic coupling in DFsc results in a ground state change to Ms = ±1, as also found in the D84E R2 variant (5C+4C with J = −1.5 cm-1) (23). Thus the GS electronic structure of the DF peptides is reminiscent of E. coli R2 as is the relatively rapid reactivity with dioxygen. Based on XAS data, this O2 reaction directly produces a biferric site which is weakly AF coupled, from VT MCD (49). (This is also supported by unpublished Mössbauer data on DFsc, Garcia, R., and Huynh, B. H. personal communication.) rR data shows that a tyrosine coordinates the biferric site, however it does not lower the potential and drive the reaction. The DFscY51L variant, where the coordinating Y residue is removed reacts more rapidly with O2 (5.1 s-1 relative to 2.1 s-1 in DFsc, Figure S8). Thus Y51 likely coordinates subsequent to the biferrous site’s reaction with O2. The spectroscopically determined reaction is shown in Figure 12.
Figure 11.
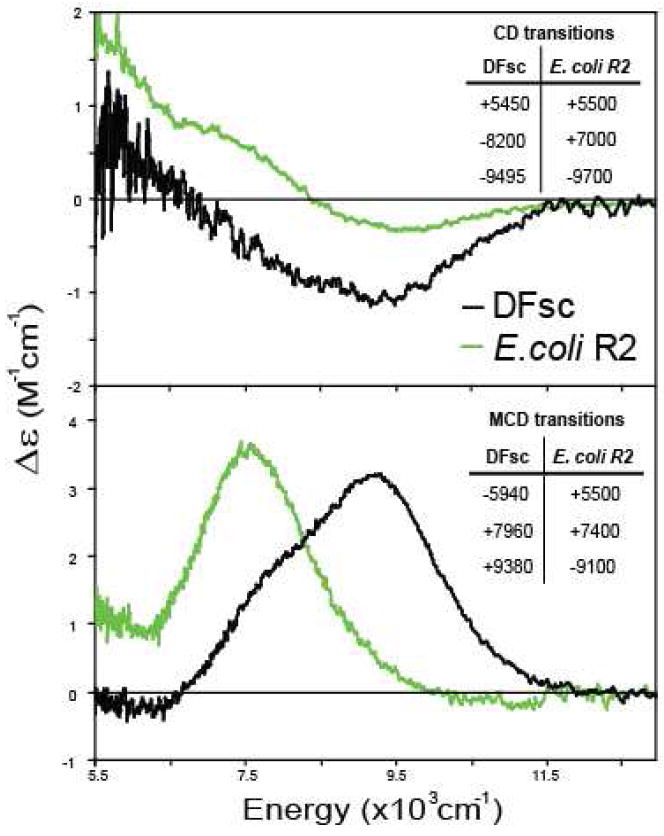
Overlay of biferrous DFsc and E. coli R2 CD and MCD spectra. E. coli R2 CD and MCD spectra and transition resolutions (sign and energy given in insets) are reproduced from ref. 29.
Figure 12.
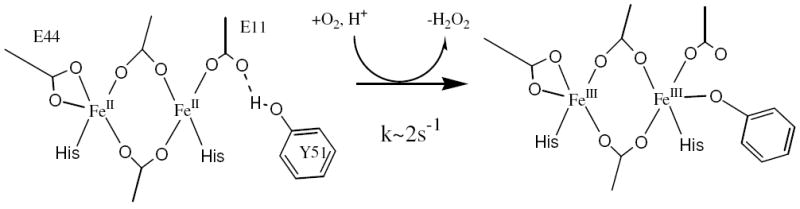
Spectroscopically derived DFsc O2 reaction.
Open coordination positions on each iron are required for rapid reaction with O2. This allows dioxygen to bridge and enables two e- transfer (one from each ferrous center) into two orthogonal antibonding orbitals on dioxygen to generate a putative peroxide level species. Computational studies on the related dimer peptide (DF2t) show that a peroxo species formed by two e- transfer (one from each FeII) is the most energetically favorable pathway (45). Thus 4C+5C biferrous sites are poised for rapid reaction with oxygen. Indeed, biferrous MMOH and Δ9D, which lack properly oriented open coordination positions on both irons, do not react rapidly with oxygen. Furthermore, the second open coordination position on the 4C iron provides a site for Y51 to bind along the reaction coordinate. Y18, which is a similar distance from the diiron site, is sterically prevented from binding to its proximal iron since, at the putative peroxo level, this iron should be coordinatively saturated due to the bidentate carboxylate. Binding of Y51 functions as an internal spectral probe of the O2 reaction and would serve as a proton source to accelerate decay of the putative peroxo intermediate. In the absence of Y51 (i.e. DFscY51L), water could bind to the second open coordination position on the 4C center and also function as a proton source as the site is solvent exposed. An additional properly oriented open coordination position on one iron and the availability of a proton source (endogenous or H2O) could be a structural mechanism used by natural binuclear iron enzymes to drive the reaction past the biferric peroxo level intermediate. Peroxo intermediates have been identified in oxygen reactions of ferritin (15) (5C+5C), Δ9D with substrate (4, 13) (4C+5C), the MMOH/component B complex (66) (5C+5C) and the D84E variant (26) of E. coli R2 (5C+4C). The intermediates from D84E-R2 and Δ9D are more stable than those observed in ferritin and MMOH. D84E substitution in R2 changes the 4C+5C R2 site to 5C+4C and thus alters solvent access to the open coordination position (23), while the site in Δ9D is believed to have limited solvent access (67). In MMOH and ferritin, water molecules are already bound to the sites at the biferrous level and could provide a proton leading to the lowered stability of these intermediates.
The DFsc 4-helix bundle is ideal for systematic ground-up studies to elucidate the factors that tune diiron sites for differential oxygen reactivity, as observed in nature. The current generation binds FeII with high affinity to create a binuclear active site with spectral properties very similar to R2, react with oxygen rapidly like R2, and generate a biferric product site (though not oxo-bridged as in R2). This is considerable progress in de novo design and the next step is to stabilize intermediates. Removal of the internal proton source Y51 did not stabilize an intermediate because the sites are still highly solvent accessible. Thus H2O access to the site needs to be regulated, or external proton sources need to be removed. The E11D variation kinetically affected FeII loading while not perturbing O2 reactivity (access) and shows that, in principle, selective discrimination at the active site is feasible. Also these relatively small peptides are soluble in various non-aqueous solvents. Currently, a number of approaches are being explored to trap the peroxo species in these de novo designed peptides and evaluate the factors that promote further reactivity.
Supplementary Material
CD titrations, VTVH MCD overlays and simulations, EXAFS fits and kinetic traces for DFsc and variants. This material is available free of charge via the Internet at http://pubs.acs.org.
Acknowledgments
This work was supported by NIH Grant GM54616 (W. F. D.), NIH Grant P41 RR001209 (K. O. H.) and NSF-Biophysics Program Grant MCB-0342807 (E. I. S.). The XAS data were collected at the Stanford Synchrotron Radiation Laboratory, a national user facility operated by Stanford University on behalf of the U.S. Department of Energy, Office of Basic Energy Sciences. The SSRL Structural Molecular Biology Program is supported by the Department of Energy, Office of Biological and Environmental Research, and by the NIH, National Center for Research Resources, Biomedical Technology Program.
Abbreviations
- DFsc
due ferro single chain
- CD
circular dichroism
- MCD
magnetic circular dichroism
- VTVH MCD
variable temperature variable field MCD
- XAS
x-ray absorption spectroscopy
- R2
ribonucleotide reductase subunit
- Δ9D
Δ9-desaturase
- MMOH
methane monooxygenase hydroxylase
- NADH
Nicotinamide adenine dinucleotide
- MIOX
myo-inositol oxygenase
- 4C
4-coordinate
- 5C
5-coordinate
- 6C
6-coordinate
- VT
variable temperature
- ES
excited state
- GS
ground state
- ZFS
zero-field splitting
- J
exchange coupling
- MOPS
3-(N-morpholino)propanesulfonic acid
- NIR
near-infrared
- SSRL
Stanford Synchrotron Radiation Laboratory
- EXAFS
extended x-ray absorption fine structure
- LF
ligand field
- Oh
octahedral
- Td
tetrahedral
- D
axial ZFS parameter
- E
rhombic ZFS parameter
- UV
ultraviolet
- FT
Fourier transform
References
- 1.Solomon EI, Brunold TC, Davis MI, Kemsley JN, Lee SK, Lehnert N, Neese F, Skulan AJ, Yang YS, Zhou J. Geometric and electronic structure/function correlations in non-heme iron enzymes. Chem Rev. 2000;100:235–350. doi: 10.1021/cr9900275. [DOI] [PubMed] [Google Scholar]
- 2.Wallar BJ, Lipscomb JD. Dioxygen Activation by Enzymes Containing Binuclear Non-Heme Iron Clusters. Chem Rev. 1996;96:2625–2658. doi: 10.1021/cr9500489. [DOI] [PubMed] [Google Scholar]
- 3.Bollinger JM, Jr, Tong WH, Ravi N, Huynh BH, Edmondson DE, Stubbe JA. Use of rapid kinetics methods to study the assembly of the diferric-tyrosyl radical cofactor of E. coli ribonucleotide reductase. Methods Enzymol. 1995;258:278–303. doi: 10.1016/0076-6879(95)58052-2. [DOI] [PubMed] [Google Scholar]
- 4.Broadwater JA, Ai J, Loehr TM, Sanders-Loehr J, Fox BG. Peroxodiferric intermediate of stearoyl-acyl carrier protein Δ9 desaturase: oxidase reactivity during single turnover and implications for the mechanism of desaturation. Biochemistry. 1998;37:14664–14671. doi: 10.1021/bi981839i. [DOI] [PubMed] [Google Scholar]
- 5.Lipscomb JD. Biochemistry of the soluble methane monooxygenase. Annu Rev Microbiol. 1994;48:371–399. doi: 10.1146/annurev.mi.48.100194.002103. [DOI] [PubMed] [Google Scholar]
- 6.Yang YS, Baldwin J, Ley BA, Bollinger JM, Jr, Solomon EI. Spectroscopic and electronic structure description of the reduced binuclear non-heme iron active site in ribonucleotide reductase from E. coli: comparison to reduced Δ9 desaturase and electronic structure contributions to differences in O2reactivity. J Am Chem Soc. 2000;122:8495–8510. [Google Scholar]
- 7.Yang Y-S, Broadwater JA, Pulver SC, Fox BG, Solomon EI. Circular dichroism and magnetic circular dichroism studies of the reduced binuclear non-heme iron site of stearoyl-ACP Δ9-desaturase: substrate binding and comparison to ribonucleotide reductase. J Am Chem Soc. 1999;121:2770–2783. [Google Scholar]
- 8.Rosenzweig AC, Brandstetter H, Whittington DA, Nordlund P, Lippard SJ, Frederick CA. Crystal structures of the methane monooxygenase hydroxylase from Methylococcus capsulatus (Bath): implications for substrate gating and component interactions. Proteins. 1997;29:141–152. [PubMed] [Google Scholar]
- 9.Whittington DA, Lippard SJ. Crystal structures of the soluble methane monooxygenase hydroxylase from Methylococcus capsulatus (Bath) demonstrating geometrical variability at the dinuclear iron active site. J Am Chem Soc. 2001;123:827–838. doi: 10.1021/ja003240n. [DOI] [PubMed] [Google Scholar]
- 10.Yoon S, Lippard SJ. Water affects the stereochemistry and dioxygen reactivity of carboxylate-rich diiron(II) models for the diiron centers in dioxygen-dependent non-heme enzymes. J Am Chem Soc. 2005;127:8386–8397. doi: 10.1021/ja0512531. [DOI] [PubMed] [Google Scholar]
- 11.Mitic N, Schwartz JK, Lipscomb JD, Solomon EI. CD and MCD studies of the effects of component B variant binding on the biferrous active site of methane monooxygenase. Biochem. 2008 doi: 10.1021/bi800818w. In press. [DOI] [PMC free article] [PubMed] [Google Scholar]
- 12.Pulver SC, Froland WA, Lipscomb JD, Solomon EI. Ligand field circular dichroism and magnetic circular dichroism studies of component B and substrate binding to the hydroxylase component of methane monooxygenase. J Am Chem Soc. 1997;119:387–395. [Google Scholar]
- 13.Broadwater JA, Achim C, Münck E, Fox BG. Mossbauer studies of the formation and reactivity of a quasi-stable peroxo intermediate of stearoyl-acyl carrier protein Δ9-desaturase. Biochemistry. 1999;38:12197–12204. doi: 10.1021/bi9914199. [DOI] [PubMed] [Google Scholar]
- 14.Kurtz DM., Jr Structural similarity and functional diversity in diiron-oxo proteins. J Biol Inorg Chem. 1997;2:159–167. [Google Scholar]
- 15.Moënne-Loccoz P, Krebs C, Herlihy K, Edmondson DE, Theil EC, Huynh BH, Loehr TM. The ferroxidase reaction of ferritin reveals a diferric μ-1,2 bridging peroxide intermediate in common with other O2-activating non-heme diiron proteins. Biochemistry. 1999;38:5290–5295. doi: 10.1021/bi990095l. [DOI] [PubMed] [Google Scholar]
- 16.Yun D, Garcia-Serres R, Chicalese BM, An YH, Huynh BH, Bollinger JM., Jr (μ-1,2-peroxo)diiron(III/III) complex as a precursor to the diiron(III/IV) intermediate X in the assembly of the iron-radical cofactor of ribonucleotide reductase from mouse. Biochemistry. 2007;46:1925–1932. doi: 10.1021/bi061717n. [DOI] [PubMed] [Google Scholar]
- 17.Skulan AJ, Brunold TC, Baldwin J, Saleh L, Bollinger JM, Jr, Solomon EI. Nature of the peroxo intermediate of the W48F/D84E ribonucleotide reductase variant: implications for O2 activation by binuclear non-heme iron enzymes. J Am Chem Soc. 2004;126:8842–8855. doi: 10.1021/ja049106a. [DOI] [PubMed] [Google Scholar]
- 18.Beauvais LG, Lippard SJ. Reactions of the peroxo intermediate of soluble methane monooxygenase hydroxylase with ethers. J Am Chem Soc. 2005;127:7370–7378. doi: 10.1021/ja050865i. [DOI] [PubMed] [Google Scholar]
- 19.Sturgeon BE, Burdi D, Chen S, Huynh BH, Edmondson DE, Stubbe J, Hoffman BM. Reconsideration of X, the diiron intermediate formed during cofactor assembly in E. coli ribonucleotide reductase. J Am Chem Soc. 1996;118:7551–7557. [Google Scholar]
- 20.Mitic N, Clay MD, Saleh L, Bollinger JM, Jr, Solomon EI. Spectroscopic and electronic structure studies of intermediate X in ribonucleotide reductase R2 and two variants: a description of the FeIV-oxo bond in the FeIII-O-FeIV dimer. J Am Chem Soc. 2007;129:9049–9065. doi: 10.1021/ja070909i. [DOI] [PMC free article] [PubMed] [Google Scholar]
- 21.Shu L, Nesheim JC, Kauffmann K, Münck E, Lipscomb JD, Que L., Jr An FeIV2O2 diamond core structure for the key intermediate Q of methane monooxygenase. Science. 1997;275:515–518. doi: 10.1126/science.275.5299.515. [DOI] [PubMed] [Google Scholar]
- 22.Brazeau BJ, Lipscomb JD. Kinetics and activation thermodynamics of methane monooxygenase compound Q formation and reaction with substrates. Biochemistry. 2000;39:13503–13515. doi: 10.1021/bi001473l. [DOI] [PubMed] [Google Scholar]
- 23.Wei PP, Skulan AJ, Mitic N, Yang YS, Saleh L, Bollinger JM, Jr, Solomon EI. Electronic and spectroscopic studies of the non-heme reduced binuclear iron sites of two ribonucleotide reductase variants: comparison to reduced methane monooxygenase and contributions to O2 reactivity. J Am Chem Soc. 2004;126:3777–3788. doi: 10.1021/ja0374731. [DOI] [PubMed] [Google Scholar]
- 24.Logan DT, deMare F, Persson BO, Slaby A, Sjöberg BM, Nordlund P. Crystal structures of two self-hydroxylating ribonucleotide reductase protein R2 mutants: structural basis for the oxygen-insertion step of hydroxylation reactions catalyzed by diiron proteins. Biochemistry. 1998;37:10798–10807. doi: 10.1021/bi9806403. [DOI] [PubMed] [Google Scholar]
- 25.Tong W, Burdi D, Riggs-Gelasco P, Chen S, Edmondson D, Huynh BH, Stubbe J, Han S, Arvai A, Tainer J. Characterization of Y122F R2 of Escherichia coli ribonucleotide reductase by time-resolved physical biochemical methods and X-ray crystallography. Biochemistry. 1998;37:5840–5848. doi: 10.1021/bi9728811. [DOI] [PubMed] [Google Scholar]
- 26.Moënne-Loccoz P, Baldwin J, Ley BA, Loehr TM, Bollinger JM., Jr O2 activation by non-heme diiron proteins: identification of a symmetric μ-1,2-peroxide in a mutant of ribonucleotide reductase. Biochemistry. 1998;37:14659–14663. doi: 10.1021/bi981838q. [DOI] [PubMed] [Google Scholar]
- 27.Saleh L, Krebs C, Ley BA, Naik S, Huynh BH, Bollinger JM., Jr Use of a chemical trigger for electron transfer to characterize a precursor to cluster X in assembly of the iron-radical cofactor of Escherichia coli ribonucleotide reductase. Biochemistry. 2004;43:5953–5964. doi: 10.1021/bi036099e. [DOI] [PubMed] [Google Scholar]
- 28.Baldwin J, Voegtli WC, Khidekel N, Moënne-Loccoz P, Krebs C, Pereira AS, Ley BA, Huynh BH, Loehr TM, Riggs-Gelasco PJ, Rosenzweig AC, Bollinger JM., Jr Rational reprogramming of the R2 subunit of Escherichia coli ribonucleotide reductase into a self-hydroxylating monooxygenase. J Am Chem Soc. 2001;123:7017–7030. doi: 10.1021/ja002114g. [DOI] [PubMed] [Google Scholar]
- 29.Zhao M, Song D, Lippard SJ. Water induces a structural conversion and accelerates the oxygenation of carboxylate-bridged non-heme diiron enzyme synthetic analogues. Inorg Chem. 2006;45:6323–6330. doi: 10.1021/ic0602906. [DOI] [PubMed] [Google Scholar]
- 30.Sazinsky MH, Lippard SJ. Correlating structure with function in bacterial multicomponent monooxygenases and related diiron proteins. Acc Chem Res. 2006;39:558–566. doi: 10.1021/ar030204v. [DOI] [PubMed] [Google Scholar]
- 31.Que L, Jr, Tolman WB. Bis(μ-oxo)dimetal “diamond” cores in copper and iron complexes relevant to biocatalysis. Angew Chem Int Ed Engl. 2002;41:1114–1137. doi: 10.1002/1521-3773(20020402)41:7<1114::aid-anie1114>3.0.co;2-6. [DOI] [PubMed] [Google Scholar]
- 32.Skulan AJ, Hanson MA, Hsu HF, Que L, Jr, Solomon EI. Spectroscopic study of [Fe2O2(5-Et3-TPA)2]3+: nature of the Fe2O2 diamond core and its possible relevance to high-valent binuclear non-heme enzyme intermediates. J Am Chem Soc. 2003;125:7344–7356. doi: 10.1021/ja021137n. [DOI] [PubMed] [Google Scholar]
- 33.Xue G, Wang D, De Hont R, Fiedler AT, Shan X, Münck E, Que L., Jr A synthetic precedent for the [FeIV2(μ-O)2] diamond core proposed for methane monooxygenase intermediate Q. Proc Natl Acad Sci U S A. 2007;104:20713–20718. doi: 10.1073/pnas.0708516105. [DOI] [PMC free article] [PubMed] [Google Scholar]
- 34.Tshuva EY, Lippard SJ. Synthetic models for non-heme carboxylate-bridged diiron metalloproteins: strategies and tactics. Chem Rev. 2004;104:987–1012. doi: 10.1021/cr020622y. [DOI] [PubMed] [Google Scholar]
- 35.Yamashita M, Furutachi H, Tosha T, Fujinami S, Saito W, Maeda Y, Takahashi K, Tanaka K, Kitagawa T, Suzuki M. Regioselective arene hydroxylation mediated by a (μ-peroxo)diiron(III) complex: a functional model for toluene monooxygenase. J Am Chem Soc. 2007;129:2–3. doi: 10.1021/ja063987z. [DOI] [PubMed] [Google Scholar]
- 36.Kurtz DM. Oxo- and hydroxo-bridged diiron complexes: a chemical perspective on a biological unit. Chem Rev. 1989;90:585–606. [Google Scholar]
- 37.Solomon EI, Tuczek F, Root DE, Brown CA. Spectroscopy of binuclear dioxygen complexes. Chem Rev. 1994;94:827–856. [Google Scholar]
- 38.Di Costanzo L, Wade H, Geremia S, Randaccio L, Pavone V, DeGrado WF, Lombardi A. Toward the de novo design of a catalytically active helix bundle: a substrate-accessible carboxylate-bridged dinuclear metal center. J Am Chem Soc. 2001;123:12749–12757. doi: 10.1021/ja010506x. [DOI] [PubMed] [Google Scholar]
- 39.Lombardi A, Summa CM, Geremia S, Randaccio L, Pavone V, DeGrado WF. Inaugural article: retrostructural analysis of metalloproteins: application to the design of a minimal model for diiron proteins. Proc Natl Acad Sci U S A. 2000;97:6298–6305. doi: 10.1073/pnas.97.12.6298. [DOI] [PMC free article] [PubMed] [Google Scholar]
- 40.Hill RB, Raleigh DP, Lombardi A, DeGrado WF. De novo design of helical bundles as models for understanding protein folding and function. Acc Chem Res. 2000;33:745–754. doi: 10.1021/ar970004h. [DOI] [PMC free article] [PubMed] [Google Scholar]
- 41.DeGrado WF. Proteins from scratch. Science. 1997;278:80–81. doi: 10.1126/science.278.5335.80. [DOI] [PubMed] [Google Scholar]
- 42.Kaplan J, DeGrado WF. De novo design of catalytic proteins. Proc Natl Acad Sci U S A. 2004;101:11566–11570. doi: 10.1073/pnas.0404387101. [DOI] [PMC free article] [PubMed] [Google Scholar]
- 43.Calhoun JR, Nastri F, Maglio O, Pavone V, Lombardi A, Degrado WF. Artificial diiron proteins: From structure to function. Biopolymers. 2005;80:264–278. doi: 10.1002/bip.20230. [DOI] [PubMed] [Google Scholar]
- 44.Wade H, Stayrook SE, Degrado WF. The structure of a designed diiron(III) protein: implications for cofactor stabilization and catalysis. Angew Chem Int Ed Engl. 2006;45:4951–4954. doi: 10.1002/anie.200600042. [DOI] [PubMed] [Google Scholar]
- 45.Wei PP, Skulan AJ, Wade H, DeGrado WF, Solomon EI. Spectroscopic and computational studies of the de novo designed protein DF2t: correlation to the biferrous active site of ribonucleotide reductase and factors that affect O2 reactivity. J Am Chem Soc. 2005;127:16098–16106. doi: 10.1021/ja053661a. [DOI] [PubMed] [Google Scholar]
- 46.Calhoun JR, Kono H, Lahr S, Wang W, DeGrado WF, Saven JG. Computational design and characterization of a monomeric helical dinuclear metalloprotein. J Mol Biol. 2003;334:1101–1115. doi: 10.1016/j.jmb.2003.10.004. [DOI] [PubMed] [Google Scholar]
- 47.Calhoun JR, Liu W, Spiegel K, Dal Peraro M, Klein ML, Valentine KG, Wand AJ, DeGrado WF. Solution NMR structure of a designed metalloprotein and complementary molecular dynamics refinement. Structure. 2008;16:210–215. doi: 10.1016/j.str.2007.11.011. [DOI] [PMC free article] [PubMed] [Google Scholar]
- 48.Summa CM, Lombardi A, Lewis M, DeGrado WF. Tertiary templates for the design of diiron proteins. Curr Opin Struct Biol. 1999;9:500–508. doi: 10.1016/S0959-440X(99)80071-2. [DOI] [PubMed] [Google Scholar]
- 49.Calhoun JR, Bell CB, 3rd, Smith TJ, Thamann TJ, DeGrado WF, Solomon EI. Oxygen reactivity of the biferrous site in the de novo designed four helix bundle peptide DFsc: nature of the “intermediate” and reaction mechanism. J Am Chem Soc. 2008 doi: 10.1021/ja801657y. In press. [DOI] [PMC free article] [PubMed] [Google Scholar]
- 50.Solomon EI, Pavel EG, Loeb KE, Campochiaro C. Magnetic circular dichroism spectroscopy as a probe of the geometric and electronic structure of non-heme ferrous enzymes. Coord Chem Rev. 1995;144:369–460. [Google Scholar]
- 51.Lear JD, DeGrado WF, Calhoun JR. Computational design and characterization of a monomeric helical dinuclear metalloprotein. Proc Natl Acad Sci U S A. 2003;100:14772–14777. doi: 10.1016/j.jmb.2003.10.004. [DOI] [PubMed] [Google Scholar]
- 52.Neese F, Solomon EI. MCD C-term signs, saturation behavior, and determination of band polarizations in randomly oriented systems with spin S ≥ 1/2. Applications to S = 1/2 and S = 5/2. Inorg Chem. 1999;38:1847–1865. doi: 10.1021/ic981264d. [DOI] [PubMed] [Google Scholar]
- 53.Ellis PJ, Freeman HC. Xfit - an interactive EXAFS analysis program. J Synchrot Radiat. 1995;2:190–195. doi: 10.1107/S0909049595006789. [DOI] [PubMed] [Google Scholar]
- 54.Ankudinov AL, Rehr JJ. Relativistic calculations of spin-dependent x-ray-absorption spectra. Phys Rev B. 1997;56:R1712–R1715. [Google Scholar]
- 55.Westre TE, Kennepohl P, DeWitt JG, Hedman B, Hodgson KO, Solomon EI. A multiplet analysis of Fe K-edge 1s→3d pre-edge features of iron complexes. J Am Chem Soc. 1997;119:6297–6314. [Google Scholar]
- 56.Reem RC, Solomon EI. Spectroscopic studies of the binuclear ferrous active Site of deoxyhemerythrin: coordination number and probable bridging ligands for the native and ligand bound forms. J Am Chem Soc. 1987;109:1216–1226. [Google Scholar]
- 57.Pavel EG, Kitajima N, Solomon EI. Magnetic circular dichroism spectroscopic studies of mononuclear non-heme ferrous model complexes. Correlation of excited- and ground-state electronic structure with geometry. J Am Chem Soc. 1998;120:3949–3962. [Google Scholar]
- 58.Riggs-Gelasco PJ, Stemmler TL, Penner-Hahn JE. XAFS of dinuclear metal sites in proteins and model compounds. Coord Chem Rev. 1995;144:245–286. [Google Scholar]
- 59.Rudd DJ, Sazinsky MH, Merkx M, Lippard SJ, Hedman B, Hodgson KO. Determination by X-ray absorption spectroscopy of the Fe-Fe separation in the oxidized form of the hydroxylase of methane monooxygenase alone and in the presence of MMOD. Inorg Chem. 2004;43:4579–4589. doi: 10.1021/ic049716b. [DOI] [PubMed] [Google Scholar]
- 60.Hedman B, Co MS, Armstrong WH, Hodgson KO, Lippard SJ. EXAFS studies of binuclear iron complexes as models for hemerythrin and related proteins. Inorg Chem. 1986;25:3708–3711. [Google Scholar]
- 61.Slep LD, Mijovilovich A, Meyer-Klaucke W, Weyhermuller T, Bill E, Bothe E, Neese F, Wieghardt K. Mixed-valent [FeIV(μ-O)(μ-carboxylato)2FeIII}3+ core. J Am Chem Soc. 2003;125:15554–15570. doi: 10.1021/ja030377f. [DOI] [PubMed] [Google Scholar]
- 62.Reem RC, Solomon EI. Spectroscopic studies of the binuclear ferrous active site of deoxyhemerythrin: coordination number and probable bridging ligands for the native and ligand-bound forms. J Am Chem Soc. 1987;109:1216–1226. [Google Scholar]
- 63.Strand KR, Yang YS, Andersson KK, Solomon EI. Circular dichroism and magnetic circular dichroism studies of the biferrous form of the R2 subunit of ribonucleotide reductase from mouse: comparison to the R2 from Escherichia coli and other binuclear ferrous enzymes. Biochemistry. 2003;42:12223–12234. doi: 10.1021/bi035248q. [DOI] [PubMed] [Google Scholar]
- 64.Wei PP, Tomter AB, Rohr AK, Andersson KK, Solomon EI. Circular dichroism and magnetic circular dichroism studies of the active site of p53R2 from human and mouse: Iron binding and nature of the biferrous site relative to other ribonucleotide reductases. Biochem. 2006;45:14043–14051. doi: 10.1021/bi061127p. [DOI] [PubMed] [Google Scholar]
- 65.Tomter AB, Bell CB, 3rd, Rohr AK, Andersson KK, Solomon EI. Circular dichroism and magnetic circular dichroism studies of the biferrous site of the class Ib ribonucleotide reductase from Bacillus cereus: comparison to the class Ia enzymes. Biochemistry. 2008 doi: 10.1021/bi801212f. [DOI] [PubMed] [Google Scholar]
- 66.Lee SK, Nesheim JC, Lipscomb JD. Transient intermediates of the methane monooxygenase catalytic cycle. J Biol Chem. 1993;268:21569–21577. [PubMed] [Google Scholar]
- 67.Lindqvist Y, Huang W, Schneider G, Shanklin J. Crystal structure of Δ9 stearoyl-acyl carrier protein desaturase from castor seed and its relationship to other di-iron proteins. Embo J. 1996;15:4081–4092. [PMC free article] [PubMed] [Google Scholar]
Associated Data
This section collects any data citations, data availability statements, or supplementary materials included in this article.
Supplementary Materials
CD titrations, VTVH MCD overlays and simulations, EXAFS fits and kinetic traces for DFsc and variants. This material is available free of charge via the Internet at http://pubs.acs.org.