

Abstract
Absence seizures are a leading form of childhood epilepsy. Human and mouse P/Q-type calcium channel gene mutations initiate a complex absence epilepsy and ataxia phenotype, and in mice, secondarily elevate neuronal low-voltage-activated T-type calcium currents. These currents influence thalamocortical network activity and contribute to the generation of cortical spike-wave discharges (SWDs) associated with absence seizures. To address whether enhanced thalamocortical T-type currents suffice to induce an epileptic phenotype, two BAC transgenic mouse lines overexpressing the Cacna1g gene for α1G T-type calcium channels were generated with low and high transgene copy numbers that exhibit elevated α1G expression and showed increased functional T-type currents measured in thalamic neurons. Both lines exhibit frequent bilateral cortical SWDs associated with behavioral arrest but lack other overt neurological abnormalities. These models provide the first evidence that primary elevation of brain T-type currents are causally related to pure absence epilepsy, and selectively identify Cacna1g, one of the three T-type calcium channel genes, as a key component of a genetically complex epileptogenic pathway.
Keywords: Bac transgenic, T-type calcium channel, mutant mouse, network, seizure, epilepsy
Introduction
Thalamocortical network oscillations are driven in part by neuronal low-voltage-activated (LVA) calcium currents encoded by three T-type calcium channel genes: Cacna1g (Cav3.1/α1G), Cacna1h (Cav3.2/α1H), and Cacna1i (Cav3.3/α1I) (Jahnsen and Llinás, 1984; Perez-Reyes, 2006; Huguenard and McCormick, 2007). At the mRNA level, these genes are differentially expressed among the synaptically linked nodes of the thalamocortical circuitry: α1G subunits are the predominant source of T-type channels in thalamocortical relay (TC) nuclei, α1H and α1I subunits localize to the thalamic reticular nucleus (nRT), and all three are found in distinct but overlapping layers of the neocortex (Talley et al., 1999). The subcellular distribution of these three T-type channel proteins is also somewhat distinct (McKay et al., 2006). While the combined roles of T-type currents in mediating network oscillations important in sleep, sensory perception, and epilepsy are well established (Steriade et al., 1993; McCormick and Bal, 1997; Crunelli et al., 2006; Khosravani and Zamponi, 2006), the contributions of each individual T-type calcium channel subunit to brain synchronization and behavior are less clear.
In epilepsy, several lines of evidence link activation of T-type currents and rebound burst firing with the abnormal spike-wave discharge (SWD) patterns of absence seizures. First, five distinct mouse models of absence epilepsy (tottering, lethargic, stargazer, coloboma, and Cacna1a −/−) each display a striking downstream enhancement of α1G-mediated T-type currents in thalamic neurons before the onset of absence epilepsy (Zhang et al., 2002, 2004; Song et al., 2004). LVA current-mediated bursting is also unmasked in the HCN2-null mouse, where loss of I h current generates spontaneous absence seizures (Ludwig et al., 2003), and in the GAERS rat that exhibits elevated thalamic T-type currents and increased Cacna1g and Cacna1h mRNA expression (Tsakiridou et al., 1995; Talley et al., 2000). Second, targeted deletion of α1G channels suppresses GABAB-receptor agonist-induced SWDs in normal mice as well as spontaneous SWDs in calcium channel mutant mice (Kim et al., 2001; Song et al., 2004), indicating an essential role for this gene in seizure expression. Third, gain-of-function polymorphisms in the human CACNA1H gene are prevalent in sporadic childhood absence epilepsy (Chen et al., 2003; Khosravani et al., 2004, 2005; Vitko et al., 2005, 2007; Peloquin et al., 2006; Heron et al., 2007), and functional polymorphisms in the CACNA1G gene have been detected in a related juvenile absence syndrome (Singh et al., 2007). In each of these situations, elevated LVA current is one of many possible contributing pathogenic defects that could facilitate aberrant cortical synchronization.
To determine whether primary elevations of LVA T-type currents within thalamocortical network activity are sufficient to initiate SWDs, we generated two BAC transgenic mouse lines overexpressing α1G channels under the control of native regulatory elements. Compared with nontransgenic mice, both lines show coordinate increases of Cacna1g mRNA and protein levels while maintaining their endogenous brain expression pattern, and display substantially elevated T-type currents within TC neurons. Electroencephalograph (EEG) analysis of both lines revealed bursts of SWDs accompanied by behavioral arrest that are readily suppressed by ethosuximide. Interestingly, despite strong overexpression in the cerebellar cortex, neither line displayed the ataxic or behavioral phenotypes associated with spike-wave epilepsy evident in all of the other monogenic mutant mouse models, indicating that these comorbid phenotypes are genetically separable and depend on the inherited upstream gene defect rather than the intermediary T-type calcium channelopathy. Our results provide the first evidence that primary elevations of α1G channels are sufficient to induce spike-wave oscillations characteristic of pure absence epilepsy.
Materials and Methods
Generation of α1G transgenic lines.
The α1G transgenic mouse lines were generated using BAC clone RP23-65I14 (NCBI accession number AL645965) obtained from the BACPAC Resource Center at Children's Hospital Oakland Research Institute that contains the complete genomic sequence of the Cacna1g gene. Along with the gene of interest, the BAC included the Abcc3 and Ankrd40 genes, neither of which are suspected to produce a neurological phenotype. The Abcc3 gene encodes an ATP-binding cassette transporter belonging to the multidrug resistance protein family, and primarily functions as an efflux pump transporting glucuronides, glutathione conjugates, and bile acids (Kruh et al., 2001; Belinsky et al., 2005). The Ankrd40 gene expresses a novel, uncharacterized nonchannel protein containing ankyrin repeat domains, commonly associated with protein-protein interactions (Li et al., 2006). Since the Cacna1g promoter region and other relevant regulatory elements have not yet been defined, the BAC transgene was not further engineered to preserve the endogenous expression pattern.
Bacterial cells possessing the BAC were cultured overnight, and BAC DNA was purified by anion-exchange chromatography using NucleoBond AX 500 columns (BD Biosciences Clontech) according to the manufacturer's protocol. The isolated BAC transgene was microinjected into the pronuclei of fertilized eggs from FVB mice at The Darwin Transgenic Mouse Core Facility at Baylor College of Medicine. Two transgene positive founder lines and all subsequent transgenic progeny were identified by PCR amplification of mouse tail DNA using the genotyping primers 5′-CACCCGACATAGATAATAACTTCG-3′ and 5′-ACGTAGATGGAGTGGACACATTG-3′ [Integrated DNA Technologies (IDT)]. Mice were housed on a 12 h light–dark cycle and allowed to feed and drink ad libitum. Mouse handling and experimental procedures were conducted in accordance with the guidelines of the United States National Institutes of Health, as approved by the Animal Care and Use Committee of Baylor College of Medicine.
Determination of transgene copy number.
Genomic DNA isolated from transgenic mice and their respective wild-type (WT) littermates was analyzed by real-time quantitative PCR to determine the number of transgene integrations using the comparative CT method (ΔΔCT method). Amplification of the target gene, Cacna1g, was performed using the exonic forward primer 5′-TGGAACTGCCCATCATGAGAT-3′ and the intronic reverse primer 5′-CCTCATTCTGCTGTCCTGCTAAT-3′, while amplification of the control gene, Scn5a, was achieved using the intronic forward primer 5′-AGGGTTTCTCTGTGACCCAAAC-3′ and the exonic reverse primer 5′-AGAGCTACGGGACACAGTATCCA-3′ (IDT). The resulting amplicons were detected using dual-labeled TaqMan probes synthesized by Applied Biosystems spanning an exon–intron boundary of the Cacna1g gene (5′-6FAM-ATCACCGGTAAGGGAATGCATGCCAC-TAMRA-3′) and an intron–exon boundary of the Scn5a gene (5′-6FAM-CTTCCCCTACCCTTTTCCAGGCTCTCA-TAMRA-3′) to ensure the detection of amplified genomic DNA. To determine transgene copy number, the fold change in amplification of the Cacna1g gene versus the control Scn5a gene was calculated using the ΔΔCT method, where fold change equals 2−ΔΔCT and ΔΔCT = ΔCT,transgenic − ΔCT,WT = (CT,av,Cacna1g − CT,av,Scn5a) − (CT,av,Cacna1g − CT,av,Scn5a). The estimated fold change was then doubled and subtracted by 2 to determine copy number; since the Cacna1g amplification results were normalized to the reference Scn5a gene that is present at two copies, and two copies of the Cacna1g gene are endogenously found within the mouse genome. The average threshold cycle (CT), which indicates the fractional cycle number of amplified PCR product that reaches a fixed threshold value, was determined for each sample by running five technical replicates.
Rotarod test for motor coordination.
Adult (∼2-month-old) naive transgenic and WT mice were placed atop a 3-cm-diameter rotating rod accelerating linearly from 4 to 40 rpm over 5 min (Ugo Basile). Motor coordination was tested for three consecutive days with four trials/d while allowing the mice a recovery period of at least 30 min between trials. Each trial concluded after the mouse fell from the rod, held on to the rod for four consecutive 360° rotations, or achieved the maximum trial length of 300 s. Times for each trial were evaluated for each transgenic mouse line compared with WT mice.
Quantitative RT-PCR analysis.
To measure the mRNA produced from the transgene, RNA isolated from transgenic mice and their respective WT littermates was analyzed by real-time quantitative RT-PCR (qRT-PCR). RNA was extracted from adult brain and heart samples using TRIzol Reagent (Invitrogen) and then purified from contaminants using the RNA Cleanup protocol provided in the RNeasy Mini Kit (Qiagen) to produce pure, high-quality RNA. Thalamic RNA was extracted from dissected samples following the purification protocol outlined in the RNeasy Mini Kit (Qiagen). Total RNA was appropriately diluted and then reverse transcribed with random hexamer primers using the SuperScript III First-Strand Synthesis System (Invitrogen), according to the manufacturer's protocol. Predesigned Taqman assays detecting the expression of the target gene, Cacna1g (Applied Biosystems; assay ID: Mm00486549_m1), and the endogenous controls, eukaryotic 18S rRNA (Applied Biosystems; product number 4319413E) and mouse GAPD (Applied Biosystems; product number 4352932E), were compared between transgenic and WT samples to determine the fold change in expression using the ΔΔCT method, as described above.
Western blotting.
Membrane proteins were isolated from adult whole-brain samples from transgenic mice and their respective WT littermates by homogenization in a cold buffer solution consisting of 50 mm Tris-HCl, pH 7.4, 1 mm EGTA, pH 8.0, 1 mm DTT (Sigma-Aldrich), 1 mm phenylmethanesulfonyl fluoride (Sigma-Aldrich), 2 μg/ml pepstatin (Roche), 4 μg/ml calpain I (Sigma-Aldrich), 4 μg/ml calpain II (Sigma-Aldrich), and Complete Protease Inhibitor Cocktail (Roche). Homogenized samples were centrifuged at 1000 × g for 5 min and the resulting supernatant centrifuged at ∼100,000 × g for 1 h, with the protein pellet resuspended in the above homogenization buffer supplemented with 0.1% Triton X-100 (Fisher Scientific). Samples containing 50 μg of protein, as quantified by the Bio-Rad Protein Assay, were mixed with sample buffer containing 2% SDS and heated at 70°C for 10 min. The protein samples were then electrophoretically separated on 10% polyacrylamide gels (Bio-Rad) and transferred to PVDF membranes (Santa Cruz Biotechnology) using Bjerrum and Schafer-Nielsen buffer with 0.037% SDS at 100 V for 105 min at 4°C. Membranes were blocked with 5% nonfat dry milk (Bio-Rad) in TBS with 0.05% Tween 20 (Bio-Rad) to prevent nonspecific antibody binding. The Cacna1g protein was detected using the anti-Cav3.1 primary antibody (Alomone Labs) at a 1:200 dilution, and visualized using Amersham ECL reagent (GE Healthcare) after binding of the horseradish peroxidase-labeled secondary antibody (Santa Cruz Biotechnology) and exposure to HyBlot CL film (Denville Scientific).
In situ hybridization.
RT-PCR was performed using the SuperScript III First-Strand Synthesis System (Invitrogen) with 50 ng of wild-type adult mouse brain RNA and random hexamer primers following the manufacturer's protocol. The resulting cDNA was subsequently amplified using primers spanning exons 37 and 38 of the Cacna1g gene that introduced SP6 and T7 promoter sequences to produce a DNA template for riboprobe production. The PCR amplification reaction used the forward primer 5′-GCGATTTAGGTGACACTATAG ATCCTACAGCTTCCCAAAGATGC-3′ and the reverse primer 5′-GCGTAATACGACTCACTATAGGG GAAGACAAACCAGAGAGACTCAGC-3′ with the SP6 and T7 promoter sequences designated in bold type and the sequence specific to the Cacna1g gene underlined (IDT). In vitro transcription of the DNA template using the SP6 and T7 promoters in the presence of digoxigenin-tagged UTP generated the sense and antisense RNA probes.
Tissue preparation, automated ISH, and digital imaging were performed as previously described (Yaylaoglu et al., 2005) and as described online at http://www.genepaint.org/RNA.htm. Briefly, brains from both lines of adult transgenic mice, along with WT littermate controls, were removed and immediately frozen by placing samples atop a dry ice/ethanol bath. Frozen samples were sectioned (25 μm thickness) using a cryostat with a distance between sections of 200 μm and mounted on glass slides. Antisense Cacna1g probe was hybridized to sections and detected by catalyzed reporter deposition (CARD) using biotinylated tyramide followed by colorimetric detection of biotin with avidin coupled to alkaline phosphatase. This results in a dark blue precipitate in cells containing the Cacna1g transcript, while hybridization with the sense control probe produces no signal. The amount of precipitate is proportional to the number of detected transcripts, and gene expression strength is detectable via the Celldetekt program (Carson et al., 2005), with red cells showing strong expression, blue cells displaying intermediate expression, and yellow cells representing weak expression.
Thalamic patch-clamp recording.
Coronal brain slices (350 μm thick) prepared from P13–17-d-old transgenic and WT littermate mice from each transgenic line were collected as in previous studies (Zhang et al., 2002, 2004) at the level of the lateral dorsal nucleus (LDN) [Paxinos and Franklin (2001), their Figs. 41–43] or the ventral basal nucleus (VB) [Paxinos and Franklin (2001), their Figs. 44–46] of the thalamus. These regions were selected since their relay cells are synaptically linked to frontal brain regions where absence seizures are known to be the most prominent in mice and human. Thalamocortical relay cells within the LDN and VB were visually identified with infrared optics, and recorded by the whole-cell patch clamp method to measure T-type calcium currents and voltage dependence of steady-state inactivation (SSI). Electrophysiological recordings were conducted using voltage protocols and solutions as previously described (Zhang et al., 2002, 2004). Data collection followed strict selection criteria to standardize recording variability based on size, clamp quality, and cell condition (absence of significant time-dependent calcium current rundown within the recording time interval). Current amplitude from the inactivation protocol, normalized to maximum, was plotted as a function of prepulse membrane potentials, and best-fitted with a Boltzmann function: I/I max = {1 + exp(V − V 1/2)/k} − 1, where V 1/2 and k represent the half-maximal voltage and slope, respectively. Cell capacitance measurements were estimated using the built-in program within the pClamp10 software. Briefly, the “Membrane Test” in Clampex generates a definable, biphasic voltage pulse. The current response is measured and capacitance is then calculated using Ohm's law.
Simultaneous electroencephalograph and electrocardiogram recordings.
Transgenic and WT control mice ranging from 1 to 2 months of age were surgically implanted under avertin anesthesia with a microminiature connector attached to silver wire electrodes (0.005 inch diameter). EEG electrodes were positioned through cranial burr holes overlying the cortical surface in the subdural space over the brain, and two electrocardiogram (ECG) electrodes running laterally within the subcutaneous tissue on either side of the heart were secured with sutures. After 1 or more days of postsurgical recovery, cortical EEG and ECG activity of freely moving mice was recorded for several hours per session over multiple days using a digital video monitoring system (Stellate Systems, Harmonie software, versions 5.0b and 6.1c). EEG recordings were collected from eight α1G-Tg1 mice and six α1G-Tg2 mice, while ECG recordings were gathered from at least three mice from each transgenic line. To determine the seizure-sensitivity to anti-epileptic drug treatment, mice from each transgenic line were intraperitoneally injected with either a 5 mmol/kg dose of ethosuximide (Sigma) or a saline vehicle control. Drug effects were assessed by comparing seizure incidence during an initial 1 h baseline EEG recording period with that observed in the hour immediately following injection of either ethosuximide or saline. EEG and ECG recordings from WT, α1G-Tg1, and α1G-Tg2 mice were analyzed to determine the number of seizures per hour, average SWD frequency, average seizure duration, and average heart rates.
Video EEG and ECG recordings were analyzed by an individual blinded to the genotype of the animal while ensuring each animal examined displayed similar states of arousal and background activity. The behavioral phenotype of the recorded mice was assessed by reviewing the digital video associated with each SWD event to identify episodes of behavioral arrest typified by interrupted motor activity during the seizure and/or a myoclonic jerk at the end of the seizure.
Statistical analysis.
The transgene copy number, rotarod, and qRT-PCR experiments along with EEG discharge and ECG activity characterizations were analyzed using the one-way ANOVA test. Cacna1g protein levels by Western blotting were quantified by densitometry and analyzed using a one-tailed paired t test. Electrophysiology data analysis was performed using the Student's t test or one-way ANOVA with the post hoc test. All data are represented as the mean ± SEM.
Results
Transgenic Cacna1g overexpression produces viable mice lacking overt neurological deficits
Cacna1g overexpression transgenic mouse lines were generated by pronuclear microinjection of BAC clone RP23–65I14 into fertilized oocytes of FVB mice. This genomic clone containing the endogenous promoter region was selected because the human (Emerick et al., 2006), rat (McRory et al., 2001), and mouse (Monteil et al., 2000; Ernst and Noebels, unpublished) Cacna1g genes are highly regulated by alternative splicing, mandating the use of BAC transgenic methodology for efficient functional expression of genes under the control of their native enhancing elements (Heintz, 2000). Two transgene-positive founder lines were established, α1G-Tg1 and α1G-Tg2.
To determine the number of transgene integrations, a real-time quantitative genomic PCR-based assay was performed on isolated tail DNA. Using an approach similar to that of Ballester et al. (2004), amplification of the target Cacna1g gene and the reference Scn5a gene was analyzed from each transgenic line along with WT littermates using the comparative threshold method (ΔΔCT method). The α1G-Tg1 line showed a 1.89-fold increase in amplification over controls, representing an estimated 1–2 transgene copy integrations (average = 1.78 ± 0.19, n = 12, p < 0.001) (Fig. 1 A). The α1G-Tg2 line exhibited a 6.56-fold increase in amplification over controls, equivalent to an estimated >10 transgene integrations (average = 11.11 ± 0.68, n = 24, p < 0.001) (Fig. 1 A). The variable transgene copy number between the low-dosage line (α1G-Tg1) and the high-dosage line (α1G-Tg2) enabled a correlation between gene dose, brain expression, and thalamocortical activity in the transgenic mice.
Figure 1.

Variable transgene integrations generate low and high copy number transgenic mice without overt neurological defects. A, Quantitative PCR assay comparing amplification from transgenic and WT genomic DNA detecting the Cacna1g target gene and the Scn5a normalizer gene. The α1G-Tg1 line bears an estimated 1–2 transgene integrations (n = 12), and the α1G-Tg2 line bears an estimated >10 copies (n = 24). The transgene copy number is calculated as 2 × (expression fold change) − 2, as described in Materials and Methods. Quantitative data represent mean ± SEM. ****p < 0.001 versus WT controls. B, WT (n = 16), α1G-Tg1 (n = 10), and α1G-Tg2 (n = 9) mice were tested for motor coordination using an accelerating rotarod assay for three consecutive days with four trials/d. The tests revealed no significant differences in time on the rotarod between each transgenic line and WT controls, as each genotype performed similarly for each trial. Quantitative data represent mean ± SEM; p > 0.05 versus WT controls.
Both α1G-Tg1 and α1G-Tg2 transgenic mice were fertile and appeared phenotypically normal and indistinguishable from their WT littermates. Since mutant mouse models of absence epilepsy with primary calcium channel subunit defects and elevated T-type currents show an ataxic phenotype, as do human epilepsy patients with CACNA1A mutations (Imbrici et al., 2004), we examined cerebellar function. Gait of the two transgenic lines was not visibly altered, and there was no resting or action tremor. To detect the possible presence of a latent vestibulomotor coordination defect, both transgenic lines and WT littermates were subjected to an accelerating rotarod assay. The tests revealed no significant changes in motor coordination, as transgenic and WT mice performed similarly for each trial (Fig. 1 B).
Increased Cacna1g mRNA and protein expression in the brain
To verify that the integrated BAC transgene enhanced expression of Cacna1g, we conducted qRT-PCR experiments on isolated brain RNA samples from each transgenic line along with matched WT controls. As predicted, whole-brain mRNA levels corresponded with the transgene copy number in each mouse line; the low-dosage α1G-Tg1 line showed a 37% increase (average fold change = 1.37 ± 0.07, n = 13, p < 0.001) in Cacna1g mRNA expression, while the high-dosage α1G-Tg2 line showed higher levels of Cacna1g mRNA expression, with a 165% increase (average fold change = 2.65 ± 0.26, n = 7, p < 0.001) (Fig. 2 A). Regional expression of Cacna1g mRNA was also quantified from dissected samples of the thalamus by qRT-PCR. Both transgenic lines displayed elevated thalamic Cacna1g mRNA levels. Similar to the respective elevations found in whole-brain samples, the α1G-Tg1 and α1G-Tg2 mouse lines mice showed a 34% (average fold change = 1.34 ± 0.04, n = 6, p < 0.001) and 124% increase (average fold change = 2.24 ± 0.33, n = 6, p < 0.005) in expression, respectively (Fig. 2 A).
Figure 2.
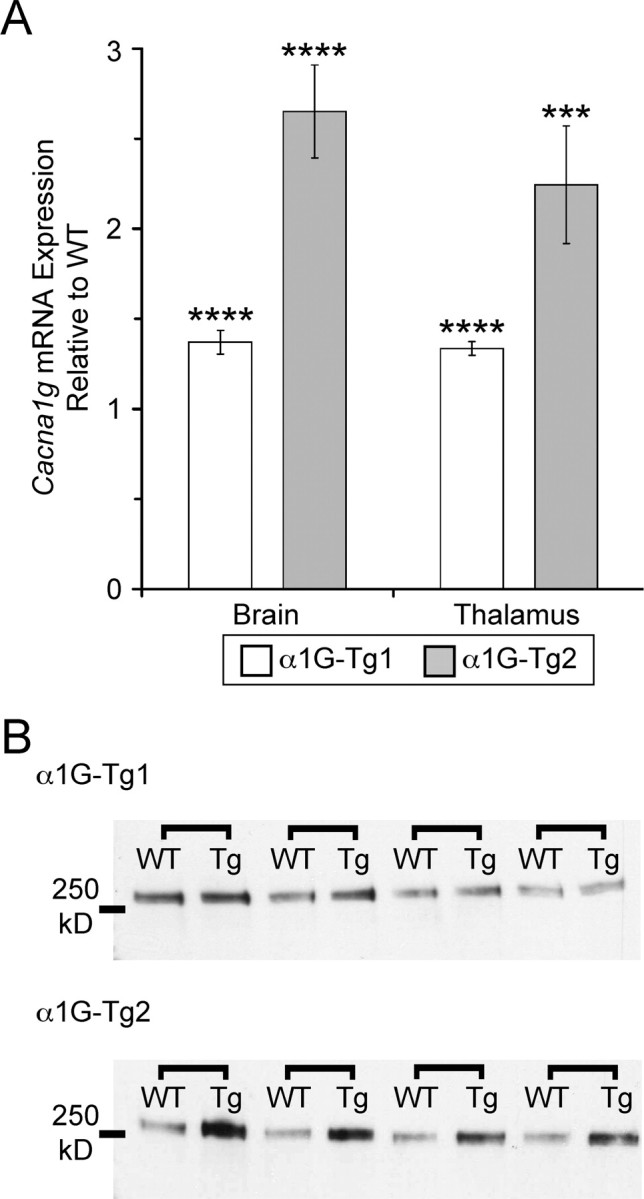
Transgenic mice show overexpression of brain α1G mRNA and protein. A, Quantitative RT-PCR assay comparing Cacna1g mRNA expression within whole-brain (α1G-Tg1, n = 13; α1G-Tg2, n = 7) and thalamus (α1G-Tg1, n = 6; α1G-Tg2, n = 6) tissue samples between each transgenic line and WT mice showing increased mRNA expression. Quantitative data represent mean ± SEM; ***p < 0.005, ****p < 0.001 versus WT controls. B, Western blot analysis of whole-brain membrane-isolated α1G protein from four littermate-paired sets (connected by brackets) of transgenic (Tg) and WT mice from each line.
Neuronal Cacna1g protein levels were similarly elevated in both transgenic lines. Western blot analysis of whole-brain membrane-isolated protein samples in the α1G-Tg1 line generated 25% more α1G protein (average fold change = 1.25 ± 0.08, n = 4, p < 0.05), while the α1G-Tg2 line produced 174% more α1G protein compared with WT controls (average fold change = 2.74 ± 0.13, n = 4, p < 0.005) (Fig. 2 B).
Cacna1g mRNA overexpression accurately localized in the brain
To further validate the precision of BAC transgene expression patterns observed within the brain, we performed in situ hybridization (ISH) using a digoxigenin-labeled Cacna1g probe. The hybridized brain sections from WT and both transgenic lines revealed distinctly similar regional localization patterns for Cacna1g mRNA expression (Talley et al., 1999) (Allen Brain Atlas), with notably intense levels in thalamic relay nuclei, entorhinal cortex, hippocampus, cerebellar cortex, and inferior olive (Fig. 3 A–D). At the cellular level, comparison of sections between WT and the low transgene copy number line mice (α1G-Tg1) revealed increased Cacna1g mRNA signal within all layers of the neocortex, the CA1–2 pyramidal cell layers of the hippocampus, thalamocortical relay cells, and the cerebellar inferior olive (see supplemental data, available at www.jneurosci.org). In the higher transgene copy number line (α1G-Tg2), samples displayed elevated signal in these same cell types, along with further increases in hippocampal CA3 pyramidal neurons and granule cells of the dentate gyrus (Fig. 3 E–H). Expression within the cerebellum of both the α1G-Tg1 and α1G-Tg2 lines showed intense Purkinje cell and granule cell layer staining, indicating prominent elevations of Cacna1g transcript levels when compared with WT samples (see supplemental data, available at www.jneurosci.org as supplemental material; Fig. 3 G). Importantly, there was no detectable signal in the reticular thalamic nuclei, where Cacna1g is not natively expressed, and no evidence of ectopic transgene expression in any other brain region was distinguishable in either transgenic line.
Figure 3.

Accurate localization of α1G mRNA within the brain. A–H, Coronal brain sections from WT (A–D) and the higher-expressing α1G-Tg2 line (E–H) were hybridized with an α1G-specific digoxigenin-labeled riboprobe. Pseudocolored (“heat map”) images were generated by converting cellular Cacna1g mRNA expression intensity (see Materials and Methods and the in-figure legend), and they represent the midbrain (A, E) along with selected regions of interest, emphasizing the similar pattern but more intense hybridization signal indicated by color changes within the thalamus (B, F), Purkinje cell layer (C, G), and the cerebellar inferior olive (D, H). Note that expression of Cacna1g in the nRT is spared in the WT and transgenic mouse.
Increased peak density of T-type calcium currents in thalamic neurons
We investigated the effects of overexpressing α1G subunits on whole cell LVA calcium currents in mouse thalamic neurons, since elevated LVA calcium currents in these cells are a hallmark of monogenic epilepsy mouse models (Zhang et al., 2002, 2004; Song et al., 2004). Figure 4, A and B, shows representative traces of LVA calcium currents within the LDN (Fig. 4 A) and VB (Fig. 4 B) in response to a −50 mV test pulse following a 3 s prepulse to −110 mV in TC neurons from WT and both transgenic lines. At a membrane potential of −50 mV, all LVA calcium currents in mouse thalamic LDN and VB neurons have recovered from inactivation and are thus available for opening in both WT and mutant neurons (Zhang et al., 2002, 2004). WT, α1G-Tg1, and α1G-Tg2 lines each possessed current traces showing fast activation and inactivation. The peak current densities of LVA currents (normalized by cell capacitance) recorded from the LDN for the α1G-Tg1 and α1G-Tg2 lines increased by 36% and 51%, respectively, when compared with WT control neurons (Fig. 4 C). The mean peak current amplitudes and peak current densities were −1452.30 ± 33.92 pA and 15.18 ± 0.31 pA/pF in the WT controls (n = 19), −1746.54 ± 37.07 pA and 20.65 ± 0.36 pA/pF in the α1G-Tg1 line (n = 15), and −2122.09 ± 59.19 pA and 22.86 ± 0.35 pA/pF in the α1G-Tg2 line (n = 14) (Fig. 4 C). Within VB neurons, the peak current densities of LVA currents for the α1G-Tg1 and α1G-Tg2 lines increased by 71% and 122%, respectively, when compared with WT control neurons (Fig. 4 C). The mean peak current amplitudes and peak current densities were −1200.00 ± 61.98 pA and 13.67 ± 0.43 pA/pF in the WT controls (n = 14), −1754.79 ± 18.66 pA and 23.40 ± 0.21 pA/pF in the α1G-Tg1 line (n = 23), and −2351.16 ± 62.07 pA and 30.41 ± 0.50 pA/pF in the α1G-Tg2 line (n = 13) (Fig. 4 C). The higher percentage increases in LVA current densities in VB neurons in comparison with those in LDN neurons may be partly due to the relatively lower basal level of current density within LDN neurons.
Figure 4.
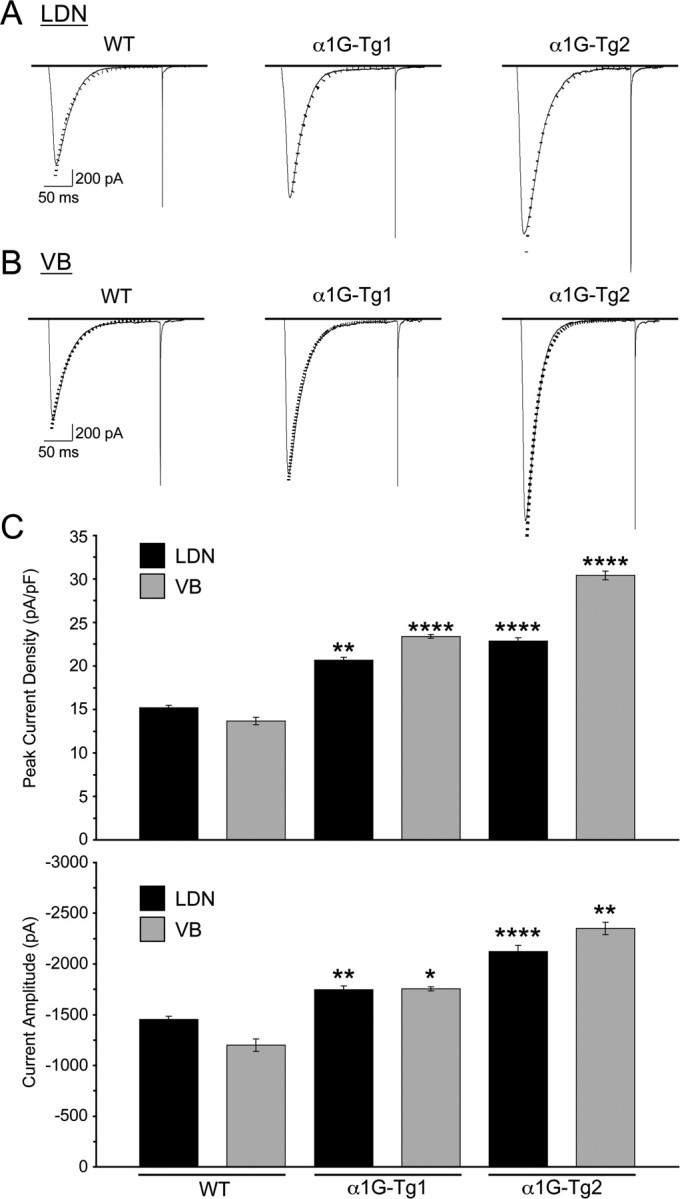
Transgenic mice produce elevated T-type calcium currents. A, B, Representative traces for T-type current density from TC cells of the LDN in WT control (n = 19), α1G-Tg1 (n = 15), and α1G-Tg2 (n = 14) mice (A) and VB in WT control (n = 14), α1G-Tg1 (n = 23), and α1G-Tg2 (n = 13) mice (B). T-type currents were evoked at a membrane potential of −50 mV (200 ms) after a 3 s step to −110 mV from a holding potential at −70 mV. Decay of the current was fitted by a single-exponential function (dotted line), and no significant alterations were detected in macroscopic current decay. C, The average peak current densities (normalized by cell capacitance) (top) and current amplitudes (bottom) of T-type calcium currents recorded in the LDN for the α1G-Tg1 and α1G-Tg2 lines increased by 36% and 51%, respectively, when compared with WT controls, and in the VB for the α1G-Tg1 and α1G-Tg2 lines increased by 71% and 122%, respectively, when compared with WT controls. Quantitative data represent mean ± SEM; *p < 0.05, **p < 0.01, ****p < 0.001 versus WT controls.
The duration of macroscopic inactivation of LVA calcium currents in the WT controls and each transgenic mouse line closely resembles the time scale displayed by T-type calcium channels following their expression in mammalian cells (Lee et al., 1999; Zhang et al., 2000), and is comparable to those seen in thalamic neurons in stg, tg, lh, and Cm mutant mice (Zhang et al., 2002, 2004). The decay of macroscopic LVA currents evoked at −50 mV was fitted by a single-exponential function (Fig. 4 A,B). No significant alteration in macroscopic LVA current decay was found in either transgenic mouse line when compared with WT controls in both LDN and VB neurons. The pooled time constants for decay within the LDN were 24.5 ± 1.5, 26.4 ± 1.2, and 24.5 ± 2.3 ms, respectively, for the WT (n = 19), α1G-Tg1 (n = 15), and α1G-Tg2 (n = 14) mice, and within the VB were 25.8 ± 1.3, 26.9 ± 0.6, and 25.9 ± 1.8 ms, respectively, for the WT (n = 14), α1G-Tg1 (n = 23), and α1G-Tg2 (n = 13).
In addition to demonstrating that Cacna1g overexpression elevated LVA calcium currents, we also examined kinetic properties of the channels. The steady-state inactivation (SSI) of T-type currents are shown in Figure 5 A (recorded from the LDN) and Figure 5 B (recorded from the VB), and were obtained using a standard double-pulse protocol where a 4 s prepulse delivered at various membrane potentials (ranging from −120 to −40 mV) preceded the test stimulus via a voltage step to −50 mV for 200 ms. No significant changes in either the pooled half-maximal voltages or pooled slopes for SSI, when normalized to maximum current amplitude, were detected between the WT controls and the two α1G transgenic mouse lines. The pooled half-maximal voltages and slopes from the LDN were −77.9 ± 3.2 mV and 5.4 ± 0.5 in the WT (n = 6), −78.4 ± 3.5 mV and 5.5 ± 1.2 in the α1G-Tg1 (n = 6), and −77.0 ± 2.2 mV and 5.6 ± 1.0 in the α1G-Tg2 (n = 5) mice, respectively, and the pooled half-maximal voltages and slopes from the VB were −78.8 ± 2.3 mV and 6.8 ± 0.6 in the WT (n = 6), −880.8 ± 2.5 mV and 5.5 ± 1.2 in the α1G-Tg1 (n = 6), and −78.3 ± 2.1 mV and 6.0 ± 0.8 in the α1G-Tg2 (n = 5) mice, respectively (Fig. 5 C). These findings suggest that the LVA current density increases are accounted for by additional channel subunits.
Figure 5.

Transgenic mice exhibit normal voltage dependence of T-type calcium currents. A, B, Representative T-type current traces for SSI from TC cells of the LDN (A) and VB (B) in WT control (n = 6), α1G-Tg1 (n = 6), and α1G-Tg2 (n = 5) mice. A standard double-pulse protocol for SSI was given from the holding potential of −70 mV, in which a 4 s prepulse delivered at various membrane potentials (ranging from −120 to −40 mV) preceded the test stimulus via a voltage step to −50 mV for 200 ms (the interpulse interval was 10 s). C, Normalized current–voltage curves for SSI of T-type currents was plotted as a function of prepulse membrane potentials and best-fitted with a Boltzmann function (see Materials and Methods). No significant changes in either pooled half-maximal voltages or slopes for SSI within the LDN and VB were observed in the α1G-Tg1 (circle, thick dashed line) or α1G-Tg2 (triangle, solid line) lines compared with WT controls (square, thin dashed line). Quantitative data represent mean ± SEM; p > 0.05 versus WT controls.
α1G overexpression induces ethosuximide-sensitive absence seizures
Prolonged digital electroencephalographic (EEG) recording with simultaneous video monitoring (video EEG) was used to assess the phenotypic effects of Cacna1g gene overexpression on thalamocortical network activity in freely moving mice. We observed that both transgenic lines generated frequent stereotyped, rhythmic cortical spike-wave discharges (SWDs), while WT littermate mice showed normal brain EEG activity without developing SWDs (Fig. 6). The SWDs detected in each transgenic line were associated with periods of behavioral arrest, a typical characteristic of absence seizures (see supplemental video EEG data, available at www.jneurosci.org as supplemental material). Analysis of the number of SWD events per hour revealed that the α1G-Tg2 line produced more seizures (25.8 ± 4.9, n = 12; ranging from 5 to 55 seizures/h) compared with the α1G-Tg1 line (11.0 ± 2.4, n = 23; ranging from 1 to 45 seizures/h). The α1G-Tg1 mouse line exhibited an average SWD frequency of 9.5 ± 0.7 Hz (ranging from 5.8 to 15.0 Hz) with individual burst durations lasting 0.7–1.7 s, and the α1G-Tg2 line showed an average SWD frequency of 9.8 ± 0.3 Hz (ranging from 7.9 to 11.8 Hz) with individual burst durations lasting 0.8–1.9 s. The average SWD frequency of each transgenic mouse line falls within the range of oscillatory sleep spindles (7–15 Hz); nevertheless, EEG seizures in all of these models represent sharp, spike-like discharges in an awakened state, which are dissimilar to the spindle EEG discharges occurring during sleep (Pinault et al., 2006).
Figure 6.

Spontaneous synchronous ethosuximide-sensitive spike-wave seizures in α1G transgenic mice. Representative bilateral cortical EEG recordings (L, left; R, right) of freely moving WT, α1G-Tg1, and α1G-Tg2 mice demonstrating that both the α1G-Tg1 and α1G-Tg2 mice develop spike-wave seizures, while WT mice show normal EEG activity. Administration of the anti-epileptic drug ethosuximide (ETX) suppresses the spike-wave seizures produced in both the α1G-Tg1 and α1G-Tg2 mice. Comparison of the average number of observed spike-wave seizures per hour reveals an increased incidence in the α1G-Tg2 line (25.8 ± 4.9; ranging from 5 to 55 seizures/h; 12 h from 4 mice) over the α1G-Tg1 line (11.0 ± 2.4; ranging from 1 to 45 seizures/h; 23 h from 4 mice). Comparisons of individual SWD frequency and duration show no significant differences between the α1G-Tg1 (16 seizures from 6 mice) and α1G-Tg2 (16 seizures from 5 mice) lines.
Injection of the anti-absence epileptic drug ethosuximide promptly suppressed SWD activity in both transgenic lines, so that the EEG activity resembled WT traces (Fig. 6). On average, α1G-Tg1 and α1G-Tg2 mice produced 2.3 ± 0.9 (n = 3) and 16.7 ± 3.8 (n = 3) seizures, respectively, during a 1 h period before ethosuximide injection and no seizures during the hour after injection. Injection of a saline control vehicle had no effect on the discharge rate. These results, combined with the observed lack of motor coordination defects (Fig. 1 B), demonstrate the development of the first defined calcium channel absence epilepsy mouse model exhibiting spike-wave seizures without an ancillary ataxic phenotype.
Cardiac α1G overexpression fails to alter resting cardiac rate
To assess the extent and fidelity of BAC transgene expression, we also examined regions outside of the brain. The Cacna1g gene is normally expressed within the myocardium, where it participates in sinoatrial pacemaking activity and cardiac conduction (Mangoni et al., 2006). In whole-heart samples, qRT-PCR experiments revealed increased Cacna1g mRNA levels of 47% (average fold change = 1.47 ± 0.14, n = 4, p < 0.005) for the α1G-Tg1 line and 27% (average fold change = 1.27 ± 0.09, n = 6, p < 0.05) for the α1G-Tg2 line. The elevated Cacna1g mRNA expression does not influence the basal cardiac rate, as electrocardiogram (ECG) recordings from unanesthetized animals during periods of behavioral immobility while at rest in their home cage reveal similar cardiac rhythms between WT and both transgenic mouse lines (Fig. 7), as WT, α1G-Tg1, and α1G-Tg2 mice possess average heart rates of 662.4 ± 18.3 beats per minute (BPM) (n = 5), 662.0 ± 29.5 BPM (n = 3), and 648.0 ± 21.1 BPM (n = 3), respectively.
Figure 7.

Overexpression of cardiac α1G spares basal cardiac rate and rhythm in α1G transgenic mice. Representative ECG recordings sampled from unanesthetized WT, α1G-Tg1, and α1G-Tg2 mice during periods of immobility revealing no alterations in resting cardiac rate.
Discussion
In this study we have identified Cacna1g overexpression as a sufficient mechanism for the generation of pure absence epilepsy, a phenotype that has thus far eluded gene mutational modeling attempts. Spontaneous epileptic mouse models of SWDs include three bearing high-voltage-activated (HVA) calcium channel subunit mutations (Cacna1atg, tg; Cacna1a −/−; and Cacnb4lh, lh); one expressing the HVA calcium channel-interacting AMPA receptor clustering mutant protein, stargazin (Cacng2stg, stg); and the last expressing the HVA calcium channel-interacting SNARE mutant protein, SNAP25 (Cm). Interestingly, these mutants all show comparable downstream elevations in thalamic T-type currents mediated by α1G channels, suggesting a pathogenic contribution in these complex models (see below). Since this channel expresses only partial overlap with the other two related T-type channel genes, Cacna1h and Cacna1i, responsible for neuronal LVA calcium current (see model in Fig. 8), the finding further subdivides the necessary and sufficient elements of the neuronal network subserving SWD generation.
Figure 8.
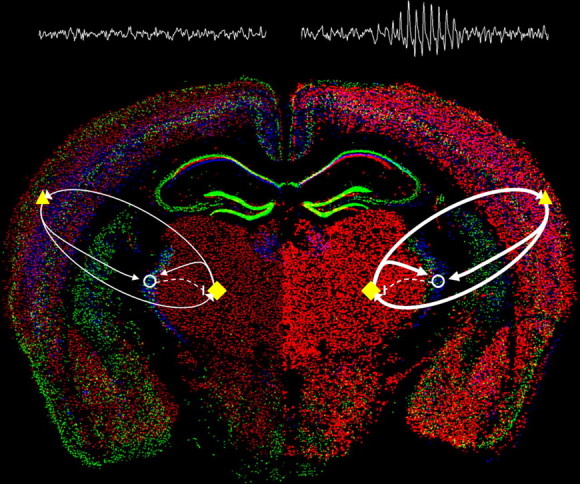
Enhanced α1G-mediated thalamocortical network activity evokes absence seizures. Model of relative changes in thalamocortical activity arising from selective enhancement of α1G T-type calcium channel expression within the brain (WT, left; α1G transgenic, right) illustrated by merged in situ hybridization images (courtesy of the Allen Brain Atlas) of the three T-type channel subunits (Cacna1g, red; Cacna1h, green; and Cacna1i, blue). Major elements of the critical thalamocortical loop consist of ascending TC cells (yellow diamonds) that excite (solid arrows) cortical cells (yellow triangles) and interneurons in the nRT (open circles), descending cortical cells that excite the TC and nRT, and nRT cells that inhibit (dashed line) the TC. Within the WT brain, a balanced network produces normal EEG activity, while in the α1G transgenic brain, transgenic overexpression of the Cacna1g gene (intense red cells) initiates hypersynchronized excitatory activity in the loop between the TC and cortex (bolder arrows), sufficient to generate SWDs and an absence epilepsy phenotype.
Elevated T-type current and the absence epilepsy phenotype
Despite their well defined role in membrane excitability, inherited disorders of single-ion channels reveal a surprising degree of phenotypic complexity, and it is frequently difficult to predict or explain the mechanism of one or more elements of the clinical syndrome, requiring the search for intermediate molecular pathogenic mechanisms induced downstream of the inherited gene defect. As each endophenotype is isolated, its homeostatic role, whether beneficial or deleterious, can be evaluated. Calcium channelopathies are an eloquent example, where loss of function mutations in HVA P/Q-type calcium channel subunits decrease neurotransmitter release and produce frequent episodes of behavioral arrest due to thalamocortical SWDs in the third postnatal week, whereas cerebellar ataxia may appear either earlier or some weeks later depending on the mutant allele. While decreased presynaptic and postsynaptic calcium entry can readily explain depressed cerebellar function, the mechanism for epileptic hypersynchronization is unclear.
In the index P/Q-type calcium channel mutant mouse, tottering (tg), decreased evoked cortical glutamate and GABA release reduce feedforward cortical synaptic inhibition (Ayata et al., 2000; Sasaki et al., 2006). This mutant also shows CNS noradrenergic hyperinnervation, and neonatal denervation of this transmitter prevents not only the expression of spike-wave epilepsy, but ataxia as well (Levitt and Noebels, 1981; Noebels, 1984), presumably by relieving the G-protein-mediated inhibition of N-type calcium channels that sustain transmission at P/Q-deficient mutant CNS terminals (Qian and Noebels, 2001; Zhou et al., 2003). More recently, elevated T-type calcium currents were identified in thalamic neurons of tg and four other mouse models of absence epilepsy (Zhang et al., 2002, 2004; Song et al., 2004), constituting an additional important candidate mechanism for epileptic hypersynchronization. In these models, elevated T-type currents were not a result of increased Cacna1g mRNA expression and are likely due to kinetic modulation of channel availability (Zhang et al., 2002; Song et al., 2004). The complete genetic ablation of α1G T-type current in α1A−/− and tg mutant mice eliminated spontaneous SWD activity, however when α1G-mediated currents were deleted in mice with auxiliary calcium channel subunit mutations (lh and stg), a low level of SWD activity remained, presumably due to other developmental abnormalities in these mutants. Similarly, the removal of only one Cacna1g allele in these models reduced T-type currents to below those seen in WT mice, yet had little effect on spontaneous SWD activity, indicating that elevation of T-type currents is not essential in these models (Song et al., 2004). The present experiments demonstrate however, that direct enhancement of thalamocortical activity through elevations of α1G current, in the absence of developmental rearrangements secondary to other known channel mutations, can effectively induce the epileptic phenotype. Together, these data isolate α1G calcium channels as both necessary in all mouse models and sufficient in this model for the expression of absence epilepsy, and implicate the ascending thalamocortical and descending corticothalamic limbs of the loop as sufficient to sustain aberrant synchronization by virtue of the restricted expression pattern of the Cacna1g gene in these two nodes of the circuit (Fig. 8). A similar strategy to test the overexpression of the Cacna1h and Cacna1i genes, which mediate the majority of LVA currents in the nRT, will be needed to determine whether enhanced T-type current at this critical inhibitory node of the thalamocortical loop is also sufficient to drive SWDs.
Gene dose effects
The two independent Cacna1g transgenic mouse lines bear different transgene copy numbers and express corresponding increases in whole-brain α1G mRNA and protein levels. Transgenic expression of α1G channels produced increases in LVA T-type calcium current densities in the low (1–2 additional copies) α1G-Tg1 line (36%) and the high (>10 additional copies) α1G-Tg2 line (51%), when compared with WT mice. The higher-dosage line (α1G-Tg2) showed a disproportionately smaller increase in functional thalamic T-type calcium currents produced from the relatively high levels of protein expression suggesting a saturable component, perhaps due to more rapid turnover. The kinetic properties of the elevated currents were similar to those observed following heterologous in vitro expression of α1G calcium channels (Lee et al., 1999; Delisle and Satin, 2000; Zhang et al., 2000; Perez-Reyes, 2003) and in dissociated rat TC neurons (Destexhe et al., 1998). The magnitude of enhanced LVA current densities in both α1G-Tg1 and α1G-Tg2 thalamic LDN TC neurons is comparable to the 45–54% increase in LVA calcium current density in the same cells found in the tg, lh, stg, and Cm mutant models (Zhang et al., 2002, 2004) and in thalamic VB neurons in Cacna1a −/− mice (Song et al., 2004), and were accompanied by similar patterns of ethosuximide-sensitive SWDs. Despite these gene dose effects, it is worth noting that the only apparent difference between the two α1G transgenic lines consisted of an increased number of spontaneous seizures per hour, rather than other discharge parameters. Further comparisons between the two transgenic lines and previously established mouse models of absence epilepsy reveal mild differences in the incidence of SWDs per hour and increased spike frequencies in the discharge that may be attributed to other gene-specific downstream alterations affecting thalamocortical excitability.
T-type overexpression is phenotypically silent in other oscillating networks
Spike-wave EEG phenotypes defined by P/Q-type calcium channel mutations in humans and mouse models coexist with other neurological deficits, including severe ataxia and episodic dyskinesia (Imbrici et al., 2004), yet these and other potential comorbid phenotypes such as tremor or cardiac arrhythmia were notably absent in both transgenic Cacna1g mouse lines. Cerebellar α1G T-type channels are elevated within the Purkinje cell layer in P/Q-type calcium channel mutant mice (Nahm et al., 2005), along with other pleiotropic gene changes (Campbell and Hess, 1998; Kaja et al., 2007). Given this downstream complexity, the specific contribution of elevated T-type calcium channel expression to the cerebellar neurological phenotype is unclear. In our study, despite elevated Cacna1g levels in the cerebellum, neither transgenic line developed any cerebellar signs, namely gait ataxia or episodic dyskinesias. In addition, removal of the Cacna1g gene within α1A−/− mice fails to rescue the ataxia phenotype (Song et al., 2004), further suggesting that enhanced rebound burst properties in Purkinje cells are not the source of the movement disorder.
Also surprising was the lack of pathological tremor in both transgenic lines. Rebound bursting in either the globus pallidus externa–subthalamic nucleus loop or in inferior olive neurons is believed to be the basis of resting and action tremor (Llinás and Yarom, 1981; Nambu and Llinás, 1994; Wang et al., 2006), and while Cacna1g α-subunits are normally expressed in both of these pathways, overexpression fails to initiate a tremor phenotype, indicating that α1G T-type calcium channel elevations alone are not tremorogenic.
Similarly, although α1G T-type calcium channels are localized in the cardiac sinoatrial node (Bohn et al., 2000), we observed no effect of Cacna1g overexpression on heart rate, despite the sinus bradycardia reported in the Cacna1g knock-out mutant (Mangoni et al., 2006). Myocardial Cacna1g mRNA levels were increased by 47% and 27% in the α1G-Tg1 and α1G-Tg2 lines, respectively. Curiously, while the α1G-Tg1 line showed concordant expression increases in heart and brain, the α1G-Tg2 strain bearing a higher transgene copy number had a lower relative cardiac expression increase. The mechanism for this differential tissue-specific regulation of Cacna1g mRNA expression observed within the α1G-Tg2 line is unclear. The failure of α1G overexpression to produce the expected tachycardia phenotype in either transgenic line may be due to developmental homeostatic responses compensating for the over expression, such as altered modulation of this channel or remodeling of other pacemaking currents (Chemin et al., 2006).
In conclusion, these findings are compatible with the observation that most typical childhood spike-wave epilepsy cases appear as “pure absence seizures” without ataxia or other neurological or cardiac disturbances, and are consistent with the hypothesis that T-type calcium channelopathy is one mechanism that closely models this human disorder. The Cacna1g transgenic mice demonstrate that α1G overexpression and elevated T-type calcium currents are a sufficient molecular defect contributing to the pathogenesis of spike-wave seizures, and together with the results of Kim et al. (2001), establish this channel as a definitive molecular target, and the mouse models as valuable tools, for development of novel anti-absence epilepsy therapy.
Footnotes
This work was supported by the National Institute of Neurological Disorders and Stroke Grant NS29709 (J.L.N.), the National Institute of Child Health and Human Development Grant HD024064 (to the Stem Cell, Neurophysiology, and Gene Expression Cores of the Eunice Kennedy Shriver Intellectual and Developmental Disabilities Research Center), and the Blue Bird Circle Foundation. We thank Daniel L. Burgess, Kristen R. Senechal, Isabel Lorenzo, Christine Thaller, and Agnes Liang for technical advice and assistance.
References
- Ayata C, Shimizu-Sasamata M, Lo EH, Noebels JL, Moskowitz MA. Impaired neurotransmitter release and elevated threshold for cortical spreading depression in mice with mutations in the alpha1A subunit of P/Q type calcium channels. Neuroscience. 2000;95:639–645. doi: 10.1016/s0306-4522(99)00446-7. [DOI] [PubMed] [Google Scholar]
- Ballester M, Castelló A, Ibáñez E, Sánchez A, Folch JM. Real-time quantitative PCR-based system for determining transgene copy number in transgenic animals. Biotechniques. 2004;37:610–613. doi: 10.2144/04374ST06. [DOI] [PubMed] [Google Scholar]
- Belinsky MG, Dawson PA, Shchaveleva I, Bain LJ, Wang R, Ling V, Chen ZS, Grinberg A, Westphal H, Klein-Szanto A, Lerro A, Kruh GD. Analysis of the in vivo functions of Mrp3. Mol Pharmacol. 2005;68:160–168. doi: 10.1124/mol.104.010587. [DOI] [PubMed] [Google Scholar]
- Bohn G, Moosmang S, Conrad H, Ludwig A, Hofmann F, Klugbauer N. Expression of T- and L-type calcium channel mRNA in murine sinoatrial node. FEBS Lett. 2000;481:73–76. doi: 10.1016/s0014-5793(00)01979-7. [DOI] [PubMed] [Google Scholar]
- Campbell DB, Hess EJ. Cerebellar circuitry is activated during convulsive episodes in the tottering (tg/tg) mutant mouse. Neuroscience. 1998;85:773–783. doi: 10.1016/s0306-4522(97)00672-6. [DOI] [PubMed] [Google Scholar]
- Carson JP, Eichele G, Chiu W. A method for automated detection of gene expression required for the establishment of a digital transcriptome-wide gene expression atlas. J Microsc. 2005;217:275–281. doi: 10.1111/j.1365-2818.2005.01450.x. [DOI] [PubMed] [Google Scholar]
- Chemin J, Traboulsie A, Lory P. Molecular pathways underlying the modulation of T-type calcium channels by neurotransmitters and hormones. Cell Calcium. 2006;40:121–134. doi: 10.1016/j.ceca.2006.04.015. [DOI] [PubMed] [Google Scholar]
- Chen Y, Lu J, Pan H, Zhang Y, Wu H, Xu K, Liu X, Jiang Y, Bao X, Yao Z, Ding K, Lo WH, Qiang B, Chan P, Shen Y, Wu X. Association between genetic variation of CACNA1H and childhood absence epilepsy. Ann Neurol. 2003;54:239–243. doi: 10.1002/ana.10607. [DOI] [PubMed] [Google Scholar]
- Crunelli V, Cope DW, Hughes SW. Thalamic T-type Ca2+ channels and NREM sleep. Cell Calcium. 2006;40:175–190. doi: 10.1016/j.ceca.2006.04.022. [DOI] [PMC free article] [PubMed] [Google Scholar]
- Delisle BP, Satin J. pH modification of human T-type calcium channel gating. Biophys J. 2000;78:1895–1905. doi: 10.1016/S0006-3495(00)76738-5. [DOI] [PMC free article] [PubMed] [Google Scholar]
- Destexhe A, Neubig M, Ulrich D, Huguenard J. Dendritic low-threshold calcium currents in thalamic relay cells. J Neurosci. 1998;18:3574–3588. doi: 10.1523/JNEUROSCI.18-10-03574.1998. [DOI] [PMC free article] [PubMed] [Google Scholar]
- Emerick MC, Stein R, Kunze R, McNulty MM, Regan MR, Hanck DA, Agnew WS. Profiling the array of Ca(v)3.1 variants from the human T-type calcium channel gene CACNA1G: alternative structures, developmental expression, and biophysical variations. Proteins. 2006;64:320–342. doi: 10.1002/prot.20877. [DOI] [PubMed] [Google Scholar]
- Heintz N. Analysis of mammalian central nervous system gene expression and function using bacterial artificial chromosome-mediated transgenesis. Hum Mol Genet. 2000;9:937–943. doi: 10.1093/hmg/9.6.937. [DOI] [PubMed] [Google Scholar]
- Heron SE, Khosravani H, Varela D, Bladen C, Williams TC, Newman MR, Scheffer IE, Berkovic SF, Mulley JC, Zamponi GW. Extended spectrum of idiopathic generalized epilepsies associated with CACNA1H functional variants. Ann Neurol. 2007;62:560–568. doi: 10.1002/ana.21169. [DOI] [PubMed] [Google Scholar]
- Huguenard JR, McCormick DA. Thalamic synchrony and dynamic regulation of global forebrain oscillations. Trends Neurosci. 2007;30:350–356. doi: 10.1016/j.tins.2007.05.007. [DOI] [PubMed] [Google Scholar]
- Imbrici P, Jaffe SL, Eunson LH, Davies NP, Herd C, Robertson R, Kullmann DM, Hanna MG. Dysfunction of the brain calcium channel CaV2.1 in absence epilepsy and episodic ataxia. Brain. 2004;127:2682–2692. doi: 10.1093/brain/awh301. [DOI] [PubMed] [Google Scholar]
- Jahnsen H, Llinás R. Electrophysiological properties of guinea-pig thalamic neurones: an in vitro study. J Physiol. 1984;349:205–226. doi: 10.1113/jphysiol.1984.sp015153. [DOI] [PMC free article] [PubMed] [Google Scholar]
- Kaja S, Hann V, Payne HL, Thompson CL. Aberrant cerebellar granule cell-specific GABAA receptor expression in the epileptic and ataxic mouse mutant, Tottering. Neuroscience. 2007;148:115–125. doi: 10.1016/j.neuroscience.2007.03.055. [DOI] [PubMed] [Google Scholar]
- Khosravani H, Zamponi GW. Voltage-gated calcium channels and idiopathic generalized epilepsies. Physiol Rev. 2006;86:941–966. doi: 10.1152/physrev.00002.2006. [DOI] [PubMed] [Google Scholar]
- Khosravani H, Altier C, Simms B, Hamming KS, Snutch TP, Mezeyova J, McRory JE, Zamponi GW. Gating effects of mutations in the Cav3.2 T-type calcium channel associated with childhood absence epilepsy. J Biol Chem. 2004;279:9681–9684. doi: 10.1074/jbc.C400006200. [DOI] [PubMed] [Google Scholar]
- Khosravani H, Bladen C, Parker DB, Snutch TP, McRory JE, Zamponi GW. Effects of Cav3.2 channel mutations linked to idiopathic generalized epilepsy. Ann Neurol. 2005;57:745–749. doi: 10.1002/ana.20458. [DOI] [PubMed] [Google Scholar]
- Kim D, Song I, Keum S, Lee T, Jeong MJ, Kim SS, McEnery MW, Shin HS. Lack of the burst firing of thalamocortical relay neurons and resistance to absence seizures in mice lacking alpha(1G) T-type Ca(2+) channels. Neuron. 2001;31:35–45. doi: 10.1016/s0896-6273(01)00343-9. [DOI] [PubMed] [Google Scholar]
- Kruh GD, Zeng H, Rea PA, Liu G, Chen ZS, Lee K, Belinsky MG. MRP subfamily transporters and resistance to anticancer agents. J Bioenerg Biomembr. 2001;33:493–501. doi: 10.1023/a:1012827221844. [DOI] [PubMed] [Google Scholar]
- Lee JH, Daud AN, Cribbs LL, Lacerda AE, Pereverzev A, Klöckner U, Schneider T, Perez-Reyes E. Cloning and expression of a novel member of the low voltage-activated T-type calcium channel family. J Neurosci. 1999;19:1912–1921. doi: 10.1523/JNEUROSCI.19-06-01912.1999. [DOI] [PMC free article] [PubMed] [Google Scholar]
- Levitt P, Noebels J. Mutant mouse tottering: selective increase of locus ceruleus axons in a defined single-locus mutation. Proc Natl Acad Sci U S A. 1981;78:4630–4634. doi: 10.1073/pnas.78.7.4630. [DOI] [PMC free article] [PubMed] [Google Scholar]
- Li J, Mahajan A, Tsai MD. Ankyrin repeat: a unique motif mediating protein-protein interactions. Biochemistry. 2006;45:15168–15178. doi: 10.1021/bi062188q. [DOI] [PubMed] [Google Scholar]
- Llinás R, Yarom Y. Properties and distribution of ionic conductances generating electroresponsiveness of mammalian inferior olivary neurones in vitro. J Physiol. 1981;315:569–584. doi: 10.1113/jphysiol.1981.sp013764. [DOI] [PMC free article] [PubMed] [Google Scholar]
- Ludwig A, Budde T, Stieber J, Moosmang S, Wahl C, Holthoff K, Langebartels A, Wotjak C, Munsch T, Zong X, Feil S, Feil R, Lancel M, Chien KR, Konnerth A, Pape HC, Biel M, Hofmann F. Absence epilepsy and sinus dysrhythmia in mice lacking the pacemaker channel HCN2. EMBO J. 2003;22:216–224. doi: 10.1093/emboj/cdg032. [DOI] [PMC free article] [PubMed] [Google Scholar]
- Mangoni ME, Traboulsie A, Leoni AL, Couette B, Marger L, Le Quang K, Kupfer E, Cohen-Solal A, Vilar J, Shin HS, Escande D, Charpentier F, Nargeot J, Lory P. Bradycardia and slowing of the atrioventricular conduction in mice lacking CaV3.1/alpha1G T-type calcium channels. Circ Res. 2006;98:1422–1430. doi: 10.1161/01.RES.0000225862.14314.49. [DOI] [PubMed] [Google Scholar]
- McCormick DA, Bal T. Sleep and arousal: thalamocortical mechanisms. Annu Rev Neurosci. 1997;20:185–215. doi: 10.1146/annurev.neuro.20.1.185. [DOI] [PubMed] [Google Scholar]
- McKay BE, McRory JE, Molineux ML, Hamid J, Snutch TP, Zamponi GW, Turner RW. Ca(V)3 T-type calcium channel isoforms differentially distribute to somatic and dendritic compartments in rat central neurons. Eur J Neurosci. 2006;24:2581–2594. doi: 10.1111/j.1460-9568.2006.05136.x. [DOI] [PubMed] [Google Scholar]
- McRory JE, Santi CM, Hamming KS, Mezeyova J, Sutton KG, Baillie DL, Stea A, Snutch TP. Molecular and functional characterization of a family of rat brain T-type calcium channels. J Biol Chem. 2001;276:3999–4011. doi: 10.1074/jbc.M008215200. [DOI] [PubMed] [Google Scholar]
- Monteil A, Chemin J, Bourinet E, Mennessier G, Lory P, Nargeot J. Molecular and functional properties of the human alpha(1G) subunit that forms T-type calcium channels. J Biol Chem. 2000;275:6090–6100. doi: 10.1074/jbc.275.9.6090. [DOI] [PubMed] [Google Scholar]
- Nahm SS, Jung KY, Enger MK, Griffith WH, Abbott LC. Differential expression of T-type calcium channels in P/Q-type calcium channel mutant mice with ataxia and absence epilepsy. J Neurobiol. 2005;62:352–360. doi: 10.1002/neu.20107. [DOI] [PubMed] [Google Scholar]
- Nambu A, Llinás R. Electrophysiology of globus pallidus neurons in vitro. J Neurophysiol. 1994;72:1127–1139. doi: 10.1152/jn.1994.72.3.1127. [DOI] [PubMed] [Google Scholar]
- Noebels JL. A single gene error of noradrenergic axon growth synchronizes central neurones. Nature. 1984;310:409–411. doi: 10.1038/310409a0. [DOI] [PubMed] [Google Scholar]
- Paxinos G, Franklin KBJ. The mouse brain in stereotaxic coordinates. San Diego: Academic; 2001. [Google Scholar]
- Peloquin JB, Khosravani H, Barr W, Bladen C, Evans R, Mezeyova J, Parker D, Snutch TP, McRory JE, Zamponi GW. Functional analysis of Ca3.2 T-type calcium channel mutations linked to childhood absence epilepsy. Epilepsia. 2006;47:655–658. doi: 10.1111/j.1528-1167.2006.00482.x. [DOI] [PubMed] [Google Scholar]
- Perez-Reyes E. Molecular physiology of low-voltage-activated t-type calcium channels. Physiol Rev. 2003;83:117–161. doi: 10.1152/physrev.00018.2002. [DOI] [PubMed] [Google Scholar]
- Perez-Reyes E. Molecular characterization of T-type calcium channels. Cell Calcium. 2006;40:89–96. doi: 10.1016/j.ceca.2006.04.012. [DOI] [PubMed] [Google Scholar]
- Pinault D, Slézia A, Acsády L. Corticothalamic 5–9 Hz oscillations are more pro-epileptogenic than sleep spindles in rats. J Physiol. 2006;574:209–227. doi: 10.1113/jphysiol.2006.108498. [DOI] [PMC free article] [PubMed] [Google Scholar]
- Qian J, Noebels JL. Presynaptic Ca2+ channels and neurotransmitter release at the terminal of a mouse cortical neuron. J Neurosci. 2001;21:3721–3728. doi: 10.1523/JNEUROSCI.21-11-03721.2001. [DOI] [PMC free article] [PubMed] [Google Scholar]
- Sasaki S, Huda K, Inoue T, Miyata M, Imoto K. Impaired feedforward inhibition of the thalamocortical projection in epileptic Ca2+ channel mutant mice, tottering. J Neurosci. 2006;26:3056–3065. doi: 10.1523/JNEUROSCI.5422-05.2006. [DOI] [PMC free article] [PubMed] [Google Scholar]
- Singh B, Monteil A, Bidaud I, Sugimoto Y, Suzuki T, Hamano S, Oguni H, Osawa M, Alonso ME, Delgado-Escueta AV, Inoue Y, Yasui-Furukori N, Kaneko S, Lory P, Yamakawa K. Mutational analysis of CACNA1G in idiopathic generalized epilepsy. Hum Mutat. 2007;28:524–525. doi: 10.1002/humu.9491. Mutation in brief #962. Online. [DOI] [PubMed] [Google Scholar]
- Song I, Kim D, Choi S, Sun M, Kim Y, Shin HS. Role of the α1G T-type calcium channel in spontaneous absence seizures in mutant mice. J Neurosci. 2004;24:5249–5257. doi: 10.1523/JNEUROSCI.5546-03.2004. [DOI] [PMC free article] [PubMed] [Google Scholar]
- Steriade M, McCormick DA, Sejnowski TJ. Thalamocortical oscillations in the sleeping and aroused brain. Science. 1993;262:679–685. doi: 10.1126/science.8235588. [DOI] [PubMed] [Google Scholar]
- Talley EM, Cribbs LL, Lee JH, Daud A, Perez-Reyes E, Bayliss DA. Differential distribution of three members of a gene family encoding low voltage-activated (T-type) calcium channels. J Neurosci. 1999;19:1895–1911. doi: 10.1523/JNEUROSCI.19-06-01895.1999. [DOI] [PMC free article] [PubMed] [Google Scholar]
- Talley EM, Solórzano G, Depaulis A, Perez-Reyes E, Bayliss DA. Low-voltage-activated calcium channel subunit expression in a genetic model of absence epilepsy in the rat. Brain Res Mol Brain Res. 2000;75:159–165. doi: 10.1016/s0169-328x(99)00307-1. [DOI] [PubMed] [Google Scholar]
- Tsakiridou E, Bertollini L, de Curtis M, Avanzini G, Pape HC. Selective increase in T-type calcium conductance of reticular thalamic neurons in a rat model of absence epilepsy. J Neurosci. 1995;15:3110–3117. doi: 10.1523/JNEUROSCI.15-04-03110.1995. [DOI] [PMC free article] [PubMed] [Google Scholar]
- Vitko I, Chen Y, Arias JM, Shen Y, Wu XR, Perez-Reyes E. Functional characterization and neuronal modeling of the effects of childhood absence epilepsy variants of CACNA1H, a T-type calcium channel. J Neurosci. 2005;25:4844–4855. doi: 10.1523/JNEUROSCI.0847-05.2005. [DOI] [PMC free article] [PubMed] [Google Scholar]
- Vitko I, Bidaud I, Arias JM, Mezghrani A, Lory P, Perez-Reyes E. The I-II loop controls plasma membrane expression and gating of Cav3.2 T-type Ca2+ channels: a paradigm for childhood absence epilepsy mutations. J Neurosci. 2007;27:322–330. doi: 10.1523/JNEUROSCI.1817-06.2007. [DOI] [PMC free article] [PubMed] [Google Scholar]
- Wang L, Kitai ST, Xiang Z. Activity-dependent bidirectional modification of inhibitory synaptic transmission in rat subthalamic neurons. J Neurosci. 2006;26:7321–7327. doi: 10.1523/JNEUROSCI.4656-05.2006. [DOI] [PMC free article] [PubMed] [Google Scholar]
- Yaylaoglu MB, Titmus A, Visel A, Alvarez-Bolado G, Thaller C, Eichele G. Comprehensive expression atlas of fibroblast growth factors and their receptors generated by a novel robotic in situ hybridization platform. Dev Dyn. 2005;234:371–386. doi: 10.1002/dvdy.20441. [DOI] [PubMed] [Google Scholar]
- Zhang Y, Cribbs LL, Satin J. Arachidonic acid modulation of alpha1H, a cloned human T-type calcium channel. Am J Physiol Heart Circ Physiol. 2000;278:H184–H193. doi: 10.1152/ajpheart.2000.278.1.H184. [DOI] [PubMed] [Google Scholar]
- Zhang Y, Mori M, Burgess DL, Noebels JL. Mutations in high-voltage-activated calcium channel genes stimulate low-voltage-activated currents in mouse thalamic relay neurons. J Neurosci. 2002;22:6362–6371. doi: 10.1523/JNEUROSCI.22-15-06362.2002. [DOI] [PMC free article] [PubMed] [Google Scholar]
- Zhang Y, Vilaythong AP, Yoshor D, Noebels JL. Elevated thalamic low-voltage-activated currents precede the onset of absence epilepsy in the SNAP25-deficient mouse mutant coloboma. J Neurosci. 2004;24:5239–5248. doi: 10.1523/JNEUROSCI.0992-04.2004. [DOI] [PMC free article] [PubMed] [Google Scholar]
- Zhou YD, Turner TJ, Dunlap K. Enhanced G protein-dependent modulation of excitatory synaptic transmission in the cerebellum of the Ca2+ channel-mutant mouse, tottering. J Physiol. 2003;547:497–507. doi: 10.1113/jphysiol.2002.033415. [DOI] [PMC free article] [PubMed] [Google Scholar]